| Param | Original file | Final file |
|---|---|---|
| Filename | modeM0/AS1C05_004T01_9000003308_22352cztM0_level2.evt | modeM0/AS1C05_004T01_9000003308_22352cztM0_level2_quad_clean.evt |
| Size (bytes) | 458,648,640 | 86,120,640 |
| Size | 437.4 MB | 82.1 MB |
| Events in quadrant A | 3,238,968 | 544,000 |
| Events in quadrant B | 3,208,325 | 555,806 |
| Events in quadrant C | 3,126,888 | 529,165 |
| Events in quadrant D | 3,858,559 | 509,909 |
| Mode M0 | |||
|---|---|---|---|
| Quadrant | BADHDUFLAG | Total packets | Discarded packets |
| A | 0 | 14036 | 1 |
| B | 0 | 13840 | 1 |
| C | 0 | 13709 | 1 |
| D | 0 | 16257 | 1 |
| Mode SS | |||
|---|---|---|---|
| Quadrant | BADHDUFLAG | Total packets | Discarded packets |
| A | 0 | 138 | 0 |
| B | 0 | 138 | 0 |
| C | 0 | 138 | 0 |
| D | 0 | 136 | 0 |
| Mode M9 | |||
|---|---|---|---|
| Quadrant | BADHDUFLAG | Total packets | Discarded packets |
| A | 0 | 5 | 0 |
| B | 0 | 5 | 0 |
| C | 0 | 5 | 0 |
| D | 0 | 5 | 0 |
| Quadrant | Total seconds | Saturated seconds | Saturation percentage |
|---|---|---|---|
| A | 6725 | 108 | 1.605948% |
| B | 6726 | 120 | 1.784121% |
| C | 6726 | 125 | 1.858460% |
| D | 6725 | 150 | 2.230483% |
Noise dominated data is calculated using 1-second bins in cleaned event files. If a bin has >2000 counts, and if more than 50% of those come from <1% of pixels, then it is considered to be noise-dominated and hence unusable.
| Quadrant | # 1 sec bins | Bins with >0 counts | Bins with >2000 counts | High rate bins dominated by noise | Noise dominated (total time) | Noise dominated (detector-on time) | Marked lightcurve |
|---|---|---|---|---|---|---|---|
| A | 7265 | 6725 | 14 | 14 | 0.19% | 0.21% | 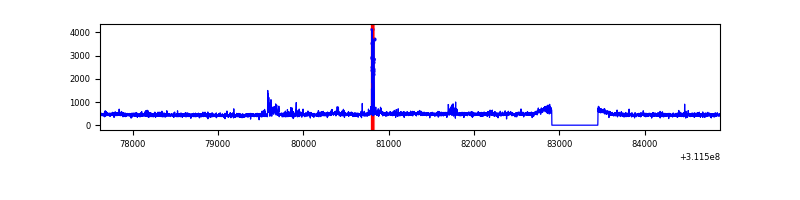 |
| B | 7266 | 6726 | 1 | 1 | 0.01% | 0.01% | 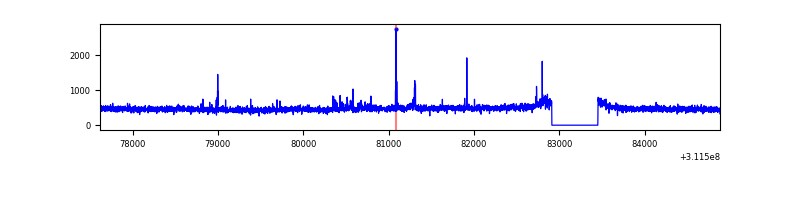 |
| C | 7266 | 6726 | 0 | 0 | 0.00% | 0.00% | 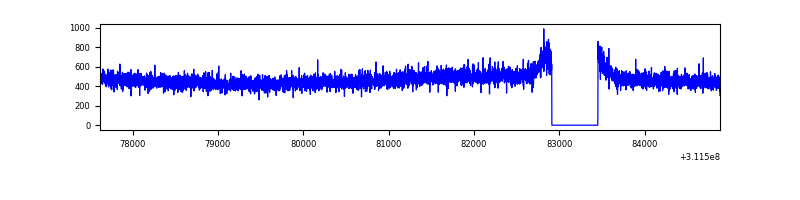 |
| D | 7265 | 6725 | 73 | 73 | 1.00% | 1.09% | 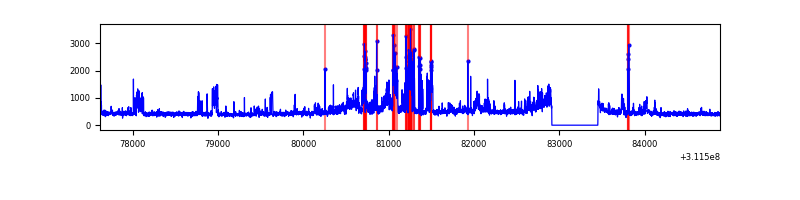 |
Top three noisy pixels from each quadrant. If the there are fewer than three noisy pixels in the level2.evt file, extra rows are filled as -1
| Pixel properties | Quadrant properties | ||||||
|---|---|---|---|---|---|---|---|
| Quadrant | DetID | PixID | Counts | Sigma | Mean | Median | Sigma |
| A | 3 | 1 | 121149 | 755.03 | 795 | 777 | 159.4 |
| A | 4 | 2 | 51839 | 320.28 | 795 | 777 | 159.4 |
| A | 13 | 254 | 10276 | 59.58 | 795 | 777 | 159.4 |
| B | 0 | 190 | 34212 | 220.47 | 798 | 777 | 151.7 |
| B | 12 | 111 | 18796 | 118.82 | 798 | 777 | 151.7 |
| B | 11 | 111 | 16566 | 104.11 | 798 | 777 | 151.7 |
| C | 14 | 238 | 125196 | 700.07 | 768 | 773 | 177.7 |
| C | 13 | 61 | 5416 | 26.12 | 768 | 773 | 177.7 |
| C | 3 | 9 | 5336 | 25.67 | 768 | 773 | 177.7 |
| D | 1 | 52 | 623555 | 3326.06 | 770 | 746 | 187.3 |
| D | 12 | 227 | 248852 | 1324.99 | 770 | 746 | 187.3 |
| D | 2 | 234 | 26365 | 136.82 | 770 | 746 | 187.3 |
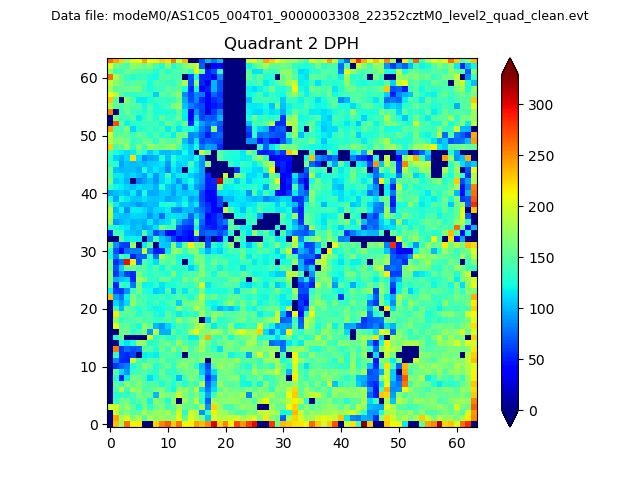
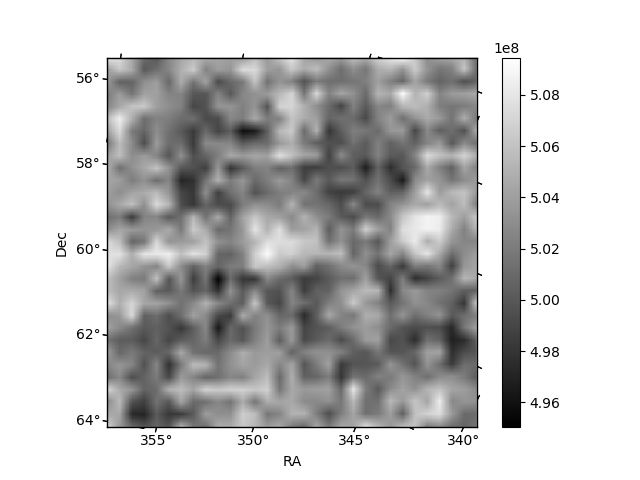
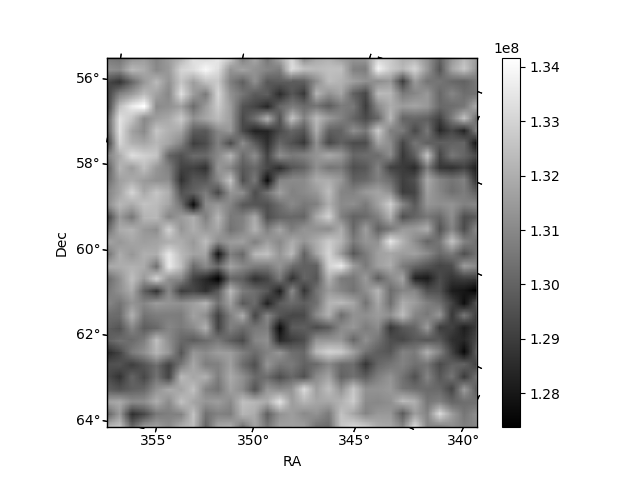
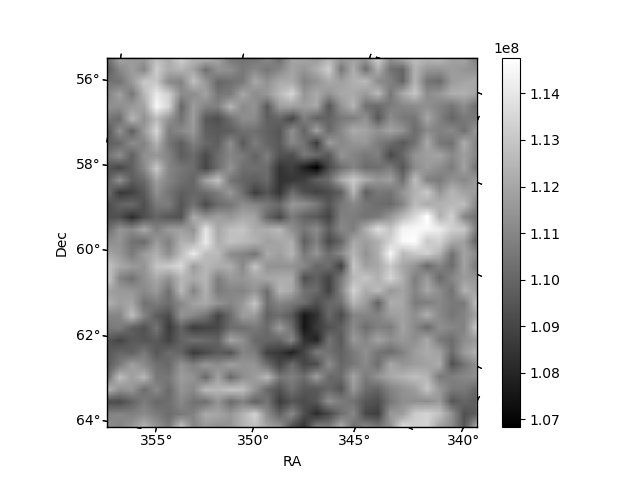
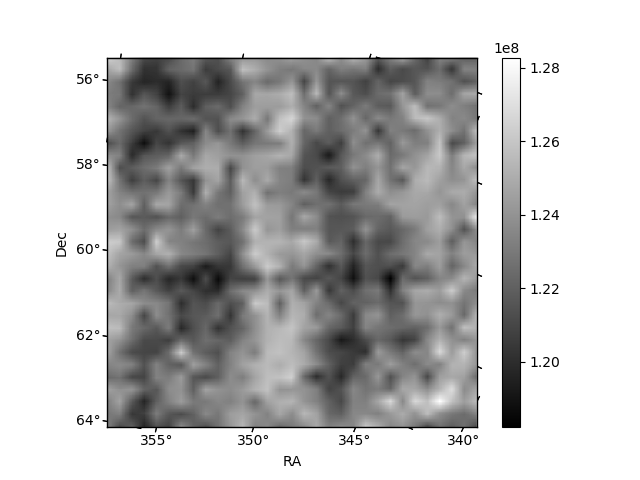
Histogram calculated using DETX and DETY for each event in the final _common_clean file
| Quadrant A | 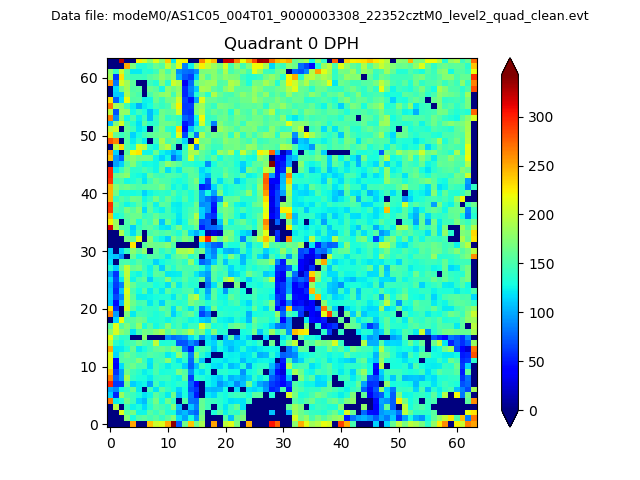 |
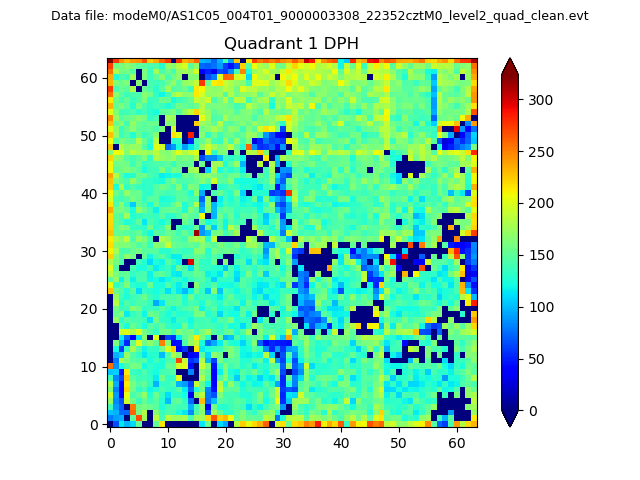 |
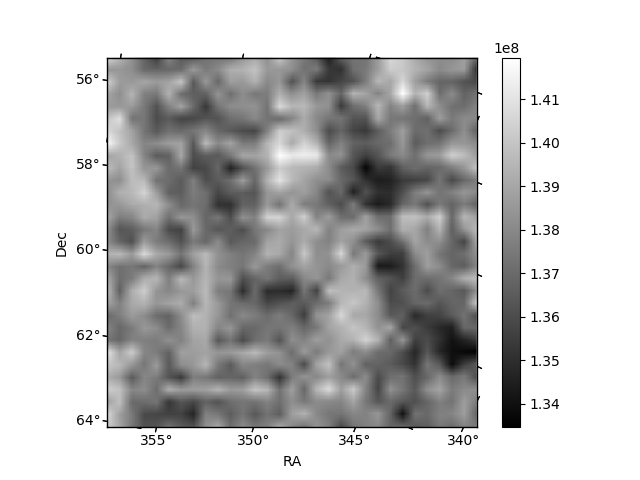
Quadrant B |
|---|---|---|---|
| Quadrant D | 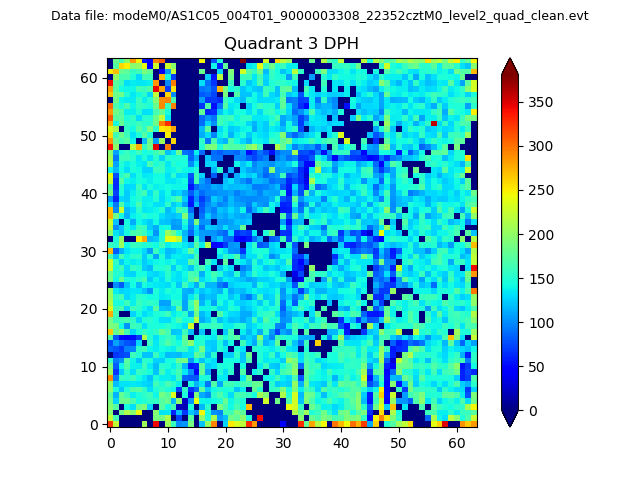 |
 |
Quadrant C |
| Plot type | Count rate plots | Images |
|---|---|---|
| Comparison with Poisson distribution Blue bars denote a histogram of data divided into 1 sec bins. Red curve is a Poisson curve with rate = median count rate of data. |
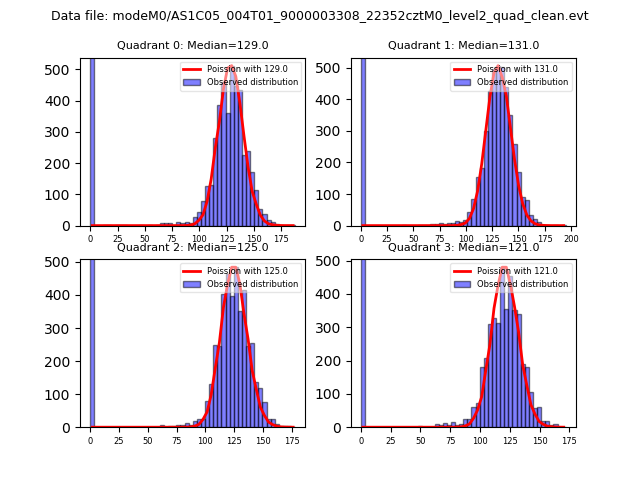 |
 |
| Quadrant-wise count rates Data is divided into 100 sec bins |
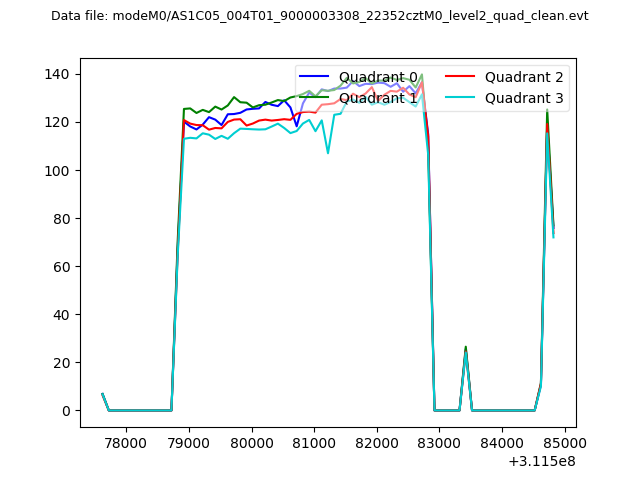 |
|
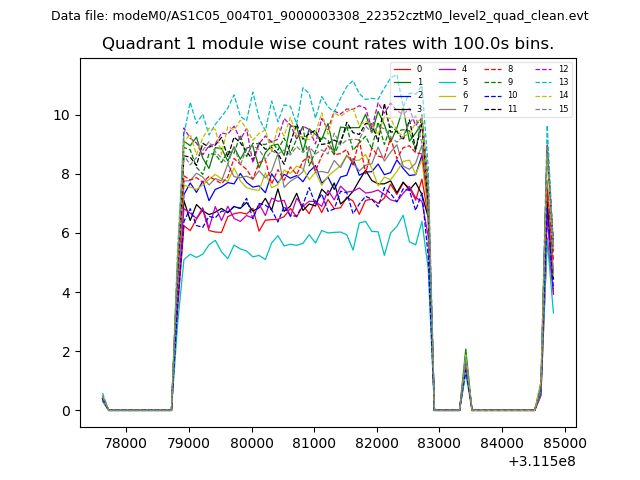
| Module-wise count rates for Quadrant A Data is divided into 100 sec bins |
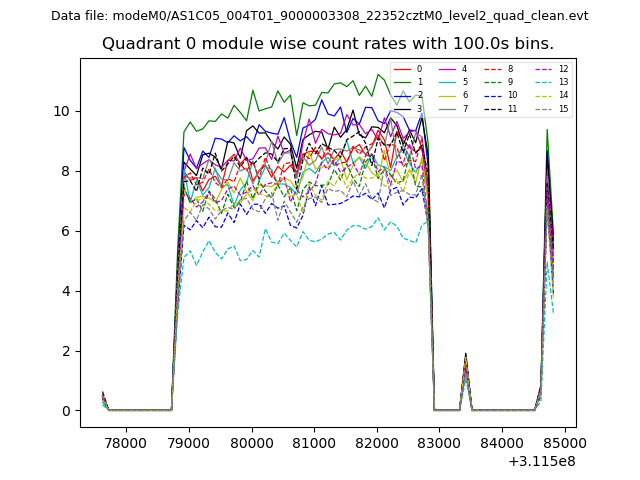 |
 |
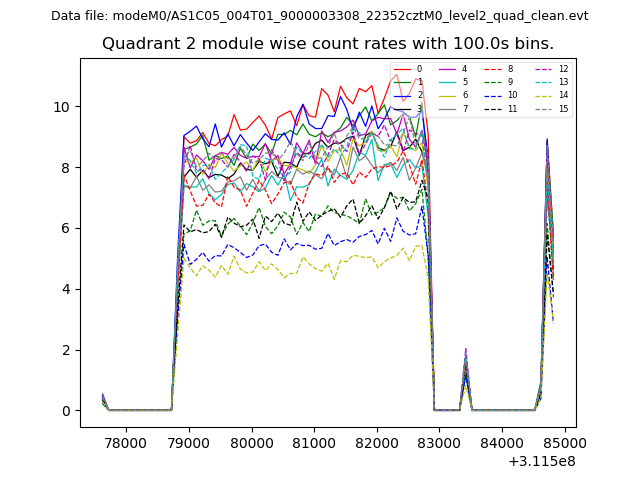
| Module-wise count rates for Quadrant B Data is divided into 100 sec bins |
 |
 |
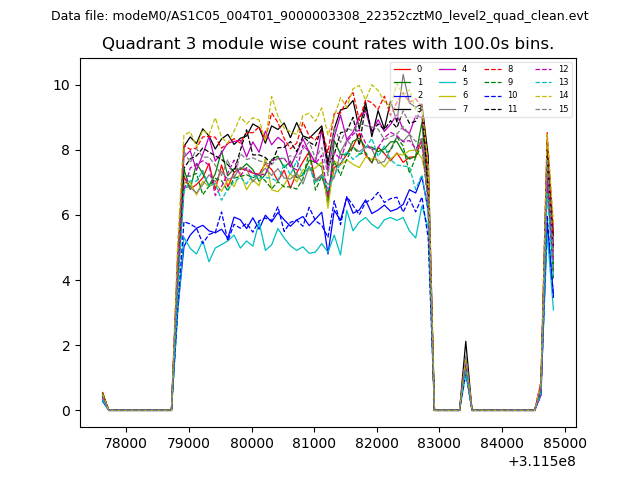
| Module-wise count rates for Quadrant C Data is divided into 100 sec bins |
 |
 |
| Module-wise count rates for Quadrant D Data is divided into 100 sec bins |
 |
 |
| Parameter | Plot |
|---|---|
| CZT HV Monitor | 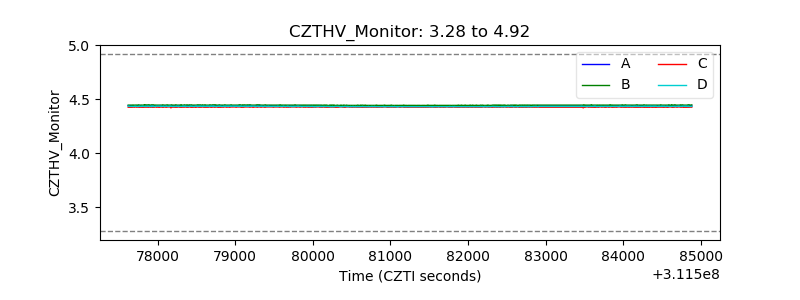 |
| D_VDD | 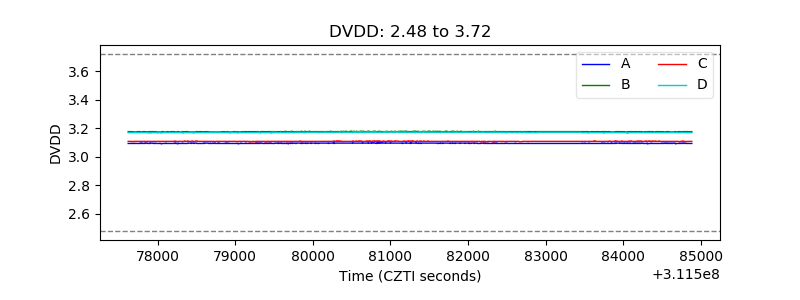 |
| Temperature 1 |  |
| Veto HV Monitor | 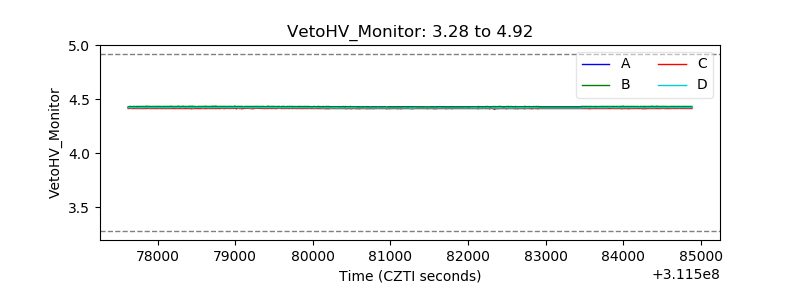 |
| Veto LLD | 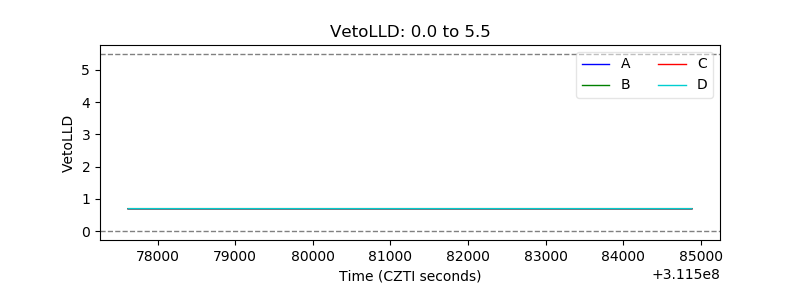 |
| Alpha Counter | 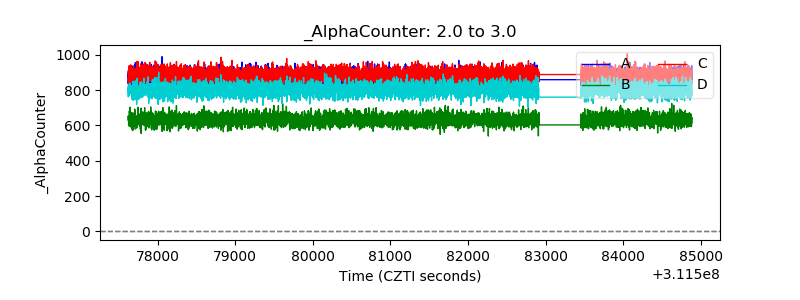 |
| _CPM_Rate | 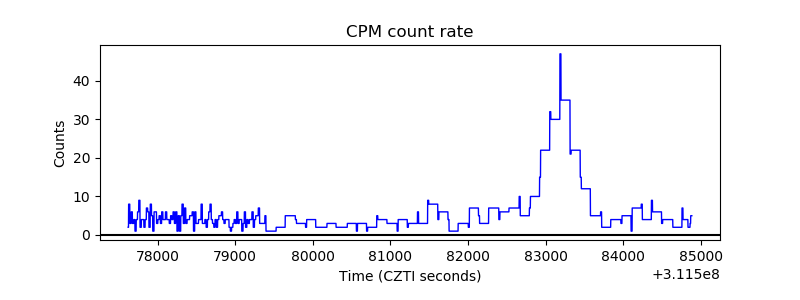 |
| CZT Counter | 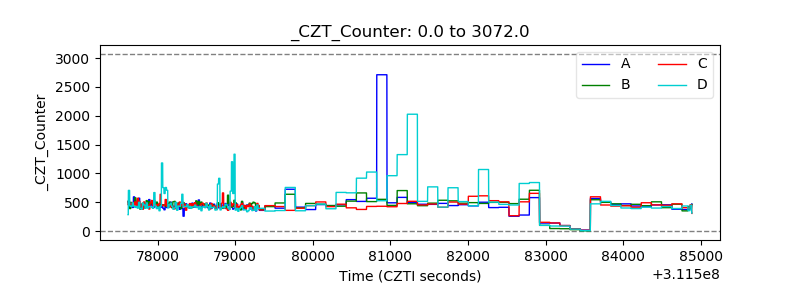 |
| +2.5 Volts monitor |  |
| +5 Volts monitor | 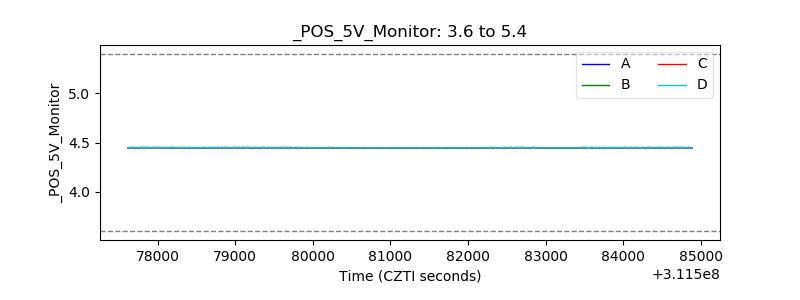 |
| _ROLL_ROT | 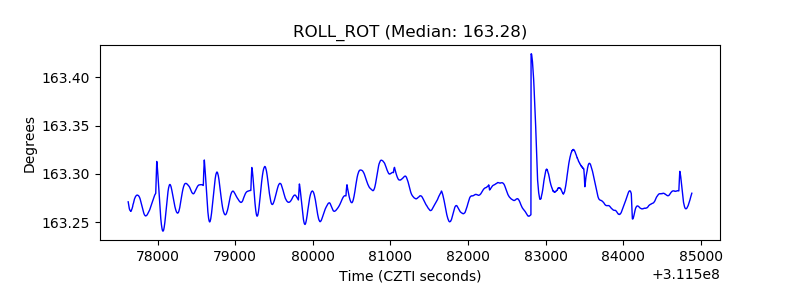 |
| _Roll_DEC |  |
| _Roll_RA | 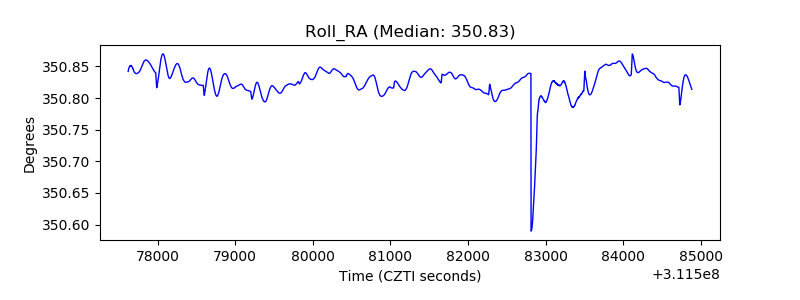 |
| Veto Counter | 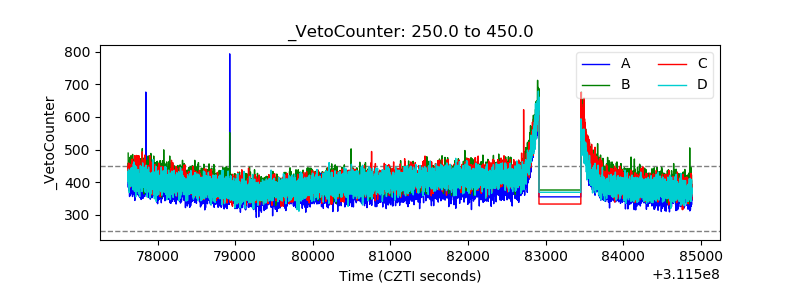 |