| Param | Original file | Final file |
|---|---|---|
| Filename | modeM0/AS1C05_004T01_9000003308_22354cztM0_level2.evt | modeM0/AS1C05_004T01_9000003308_22354cztM0_level2_quad_clean.evt |
| Size (bytes) | 521,449,920 | 109,512,000 |
| Size | 497.3 MB | 104.4 MB |
| Events in quadrant A | 3,422,907 | 713,404 |
| Events in quadrant B | 4,114,258 | 719,657 |
| Events in quadrant C | 3,437,351 | 694,668 |
| Events in quadrant D | 4,313,235 | 672,025 |
| Mode M0 | |||
|---|---|---|---|
| Quadrant | BADHDUFLAG | Total packets | Discarded packets |
| A | 0 | 15217 | 1 |
| B | 0 | 17009 | 1 |
| C | 0 | 15147 | 1 |
| D | 0 | 17742 | 1 |
| Mode SS | |||
|---|---|---|---|
| Quadrant | BADHDUFLAG | Total packets | Discarded packets |
| A | 0 | 150 | 0 |
| B | 0 | 150 | 0 |
| C | 0 | 150 | 0 |
| D | 0 | 150 | 0 |
| Mode M9 | |||
|---|---|---|---|
| Quadrant | BADHDUFLAG | Total packets | Discarded packets |
| A | 0 | 2 | 0 |
| B | 0 | 2 | 0 |
| C | 0 | 2 | 0 |
| D | 0 | 2 | 0 |
| Quadrant | Total seconds | Saturated seconds | Saturation percentage |
|---|---|---|---|
| A | 7427 | 138 | 1.858085% |
| B | 7428 | 256 | 3.446419% |
| C | 7428 | 118 | 1.588584% |
| D | 7428 | 198 | 2.665590% |
Noise dominated data is calculated using 1-second bins in cleaned event files. If a bin has >2000 counts, and if more than 50% of those come from <1% of pixels, then it is considered to be noise-dominated and hence unusable.
| Quadrant | # 1 sec bins | Bins with >0 counts | Bins with >2000 counts | High rate bins dominated by noise | Noise dominated (total time) | Noise dominated (detector-on time) | Marked lightcurve |
|---|---|---|---|---|---|---|---|
| A | 7587 | 7428 | 0 | 0 | 0.00% | 0.00% | 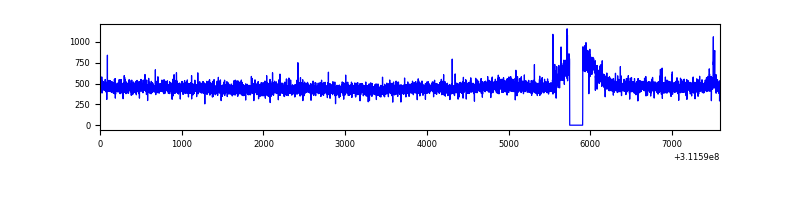 |
| B | 7588 | 7429 | 105 | 105 | 1.38% | 1.41% | 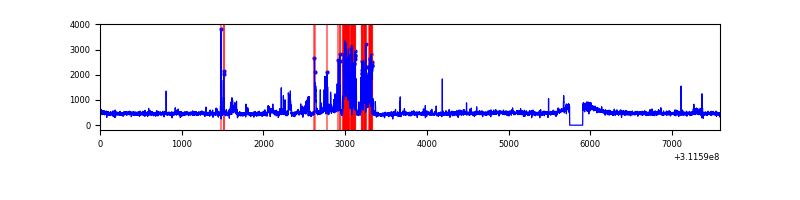 |
| C | 7588 | 7429 | 0 | 0 | 0.00% | 0.00% | 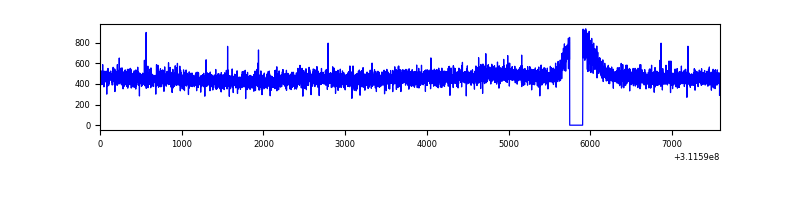 |
| D | 7588 | 7429 | 97 | 97 | 1.28% | 1.31% | 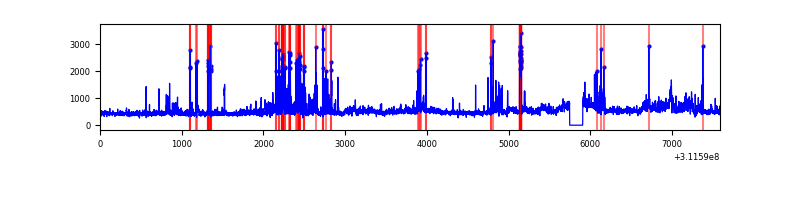 |
Top three noisy pixels from each quadrant. If the there are fewer than three noisy pixels in the level2.evt file, extra rows are filled as -1
| Pixel properties | Quadrant properties | ||||||
|---|---|---|---|---|---|---|---|
| Quadrant | DetID | PixID | Counts | Sigma | Mean | Median | Sigma |
| A | 3 | 1 | 19378 | 103.56 | 881 | 861 | 178.8 |
| A | 4 | 2 | 10363 | 53.14 | 881 | 861 | 178.8 |
| A | 13 | 254 | 8713 | 43.91 | 881 | 861 | 178.8 |
| B | 3 | 64 | 558196 | 3306.0 | 876 | 850 | 168.6 |
| B | 0 | 197 | 41394 | 240.49 | 876 | 850 | 168.6 |
| B | 0 | 190 | 36858 | 213.59 | 876 | 850 | 168.6 |
| C | 14 | 238 | 133286 | 670.22 | 844 | 850 | 197.6 |
| C | 13 | 61 | 6024 | 26.18 | 844 | 850 | 197.6 |
| C | 3 | 9 | 4602 | 18.99 | 844 | 850 | 197.6 |
| D | 1 | 52 | 566420 | 2737.38 | 849 | 823 | 206.6 |
| D | 12 | 227 | 441719 | 2133.85 | 849 | 823 | 206.6 |
| D | 13 | 104 | 51489 | 245.21 | 849 | 823 | 206.6 |
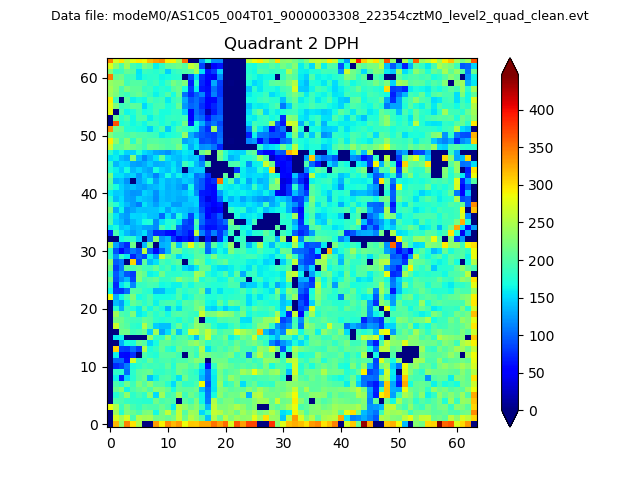
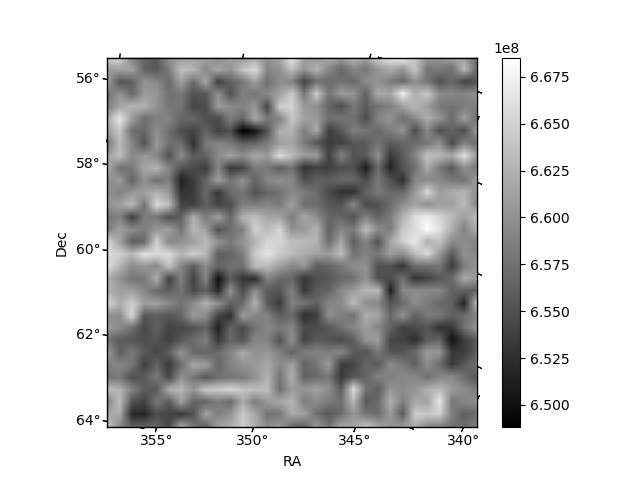
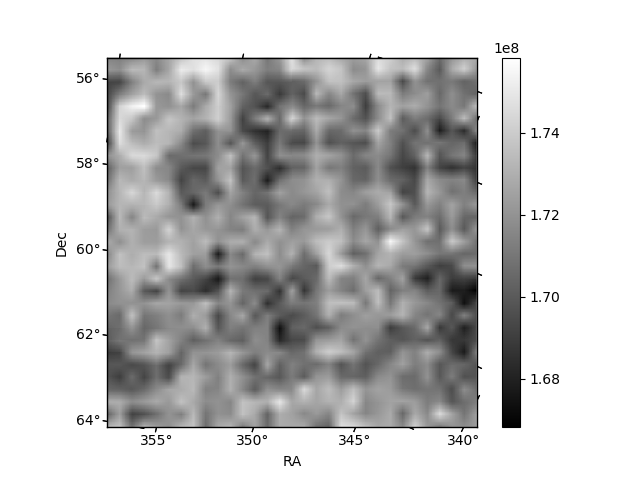
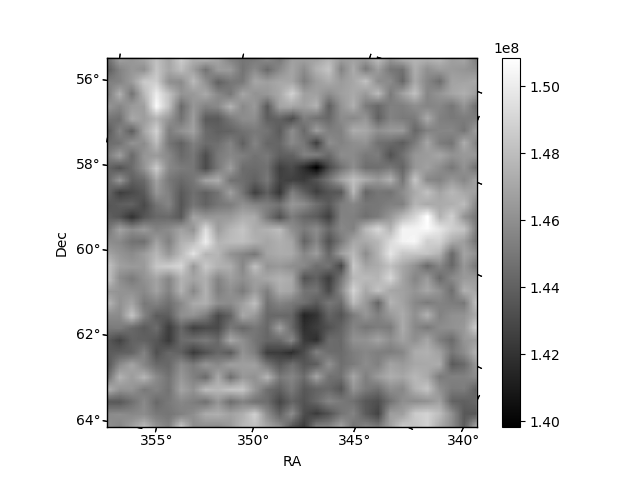
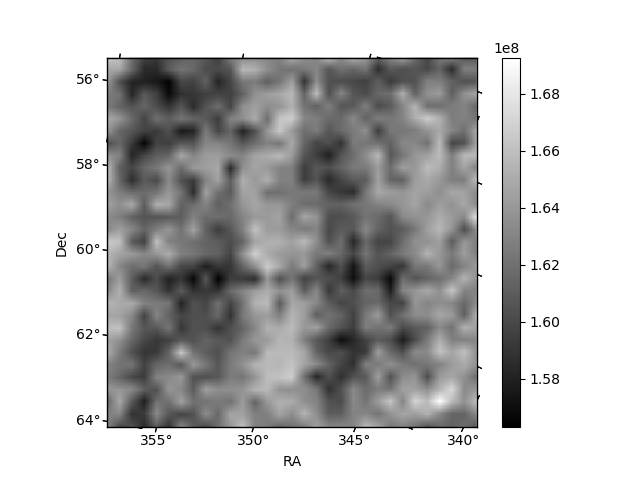
Histogram calculated using DETX and DETY for each event in the final _common_clean file
| Quadrant A | 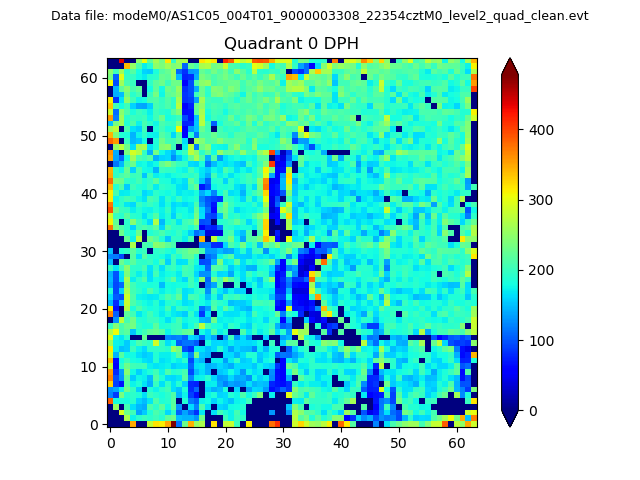 |
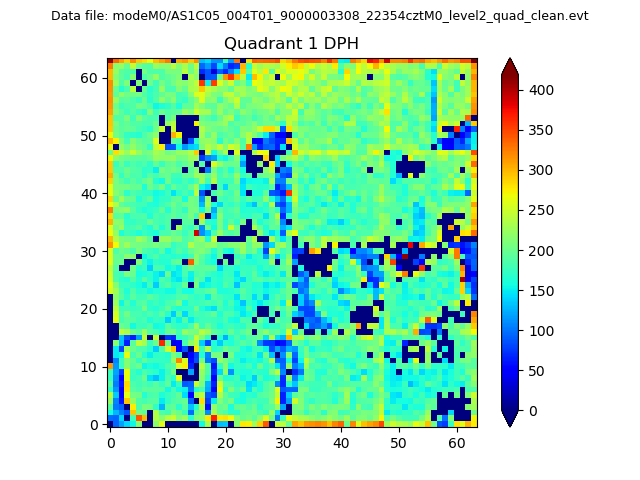 |
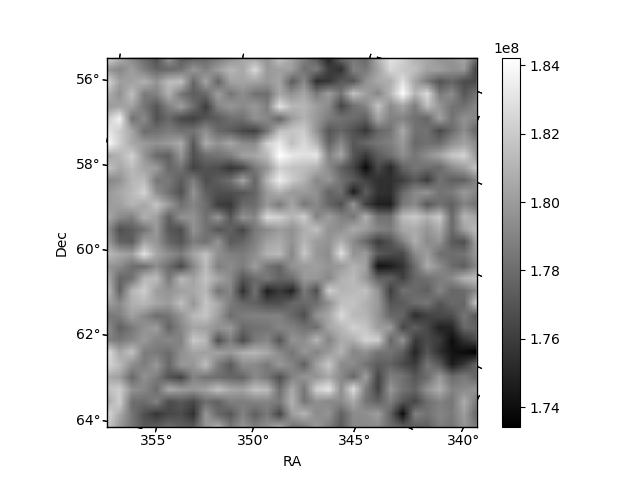
Quadrant B |
|---|---|---|---|
| Quadrant D | 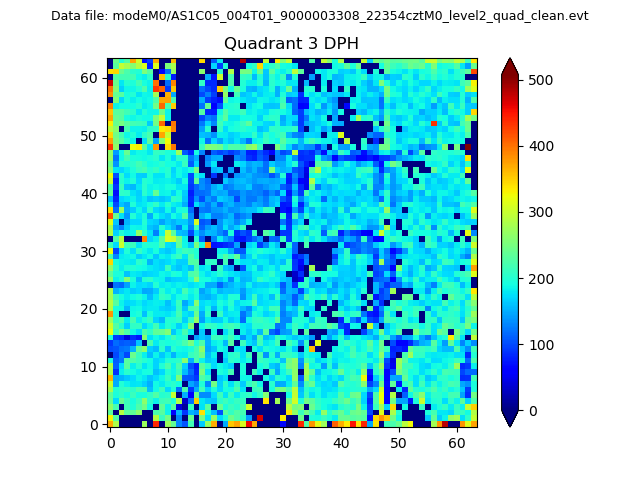 |
 |
Quadrant C |
| Plot type | Count rate plots | Images |
|---|---|---|
| Comparison with Poisson distribution Blue bars denote a histogram of data divided into 1 sec bins. Red curve is a Poisson curve with rate = median count rate of data. |
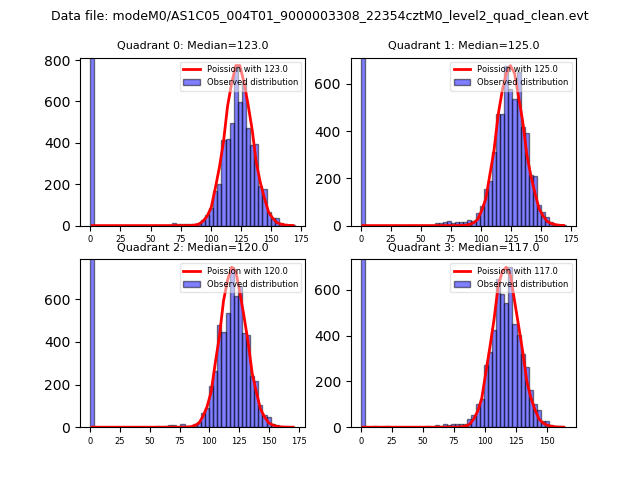 |
 |
| Quadrant-wise count rates Data is divided into 100 sec bins |
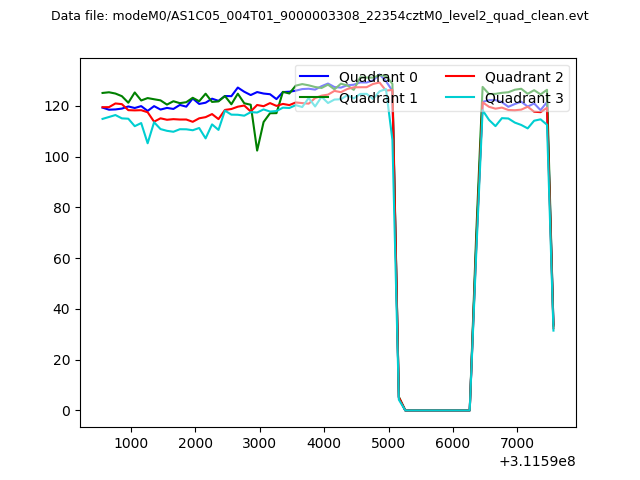 |
|
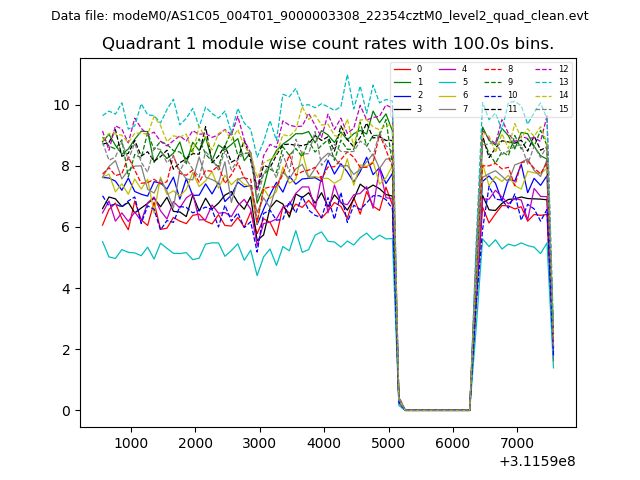
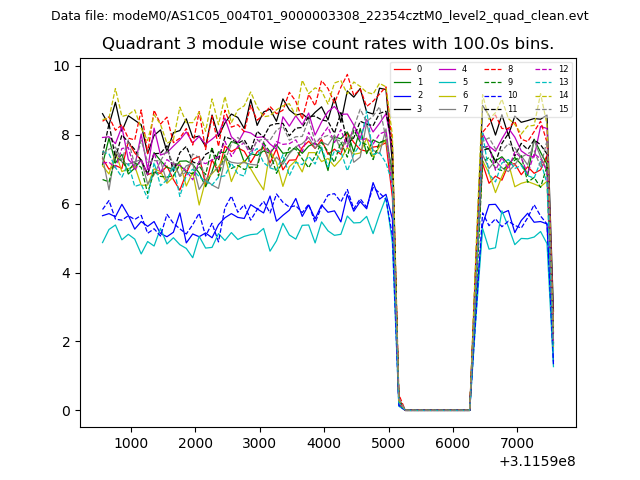
| Module-wise count rates for Quadrant A Data is divided into 100 sec bins |
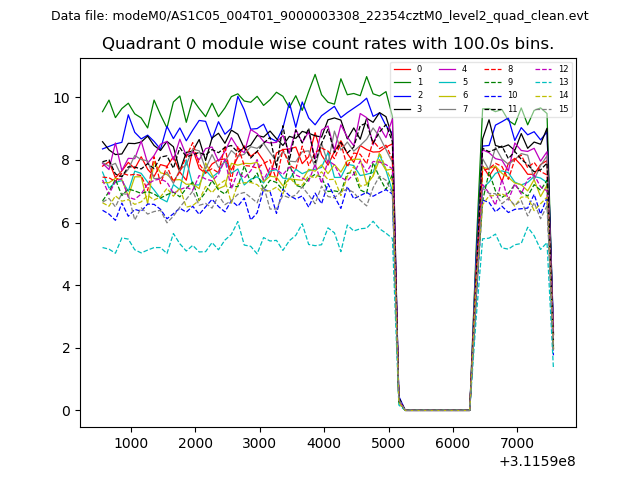 |
 |
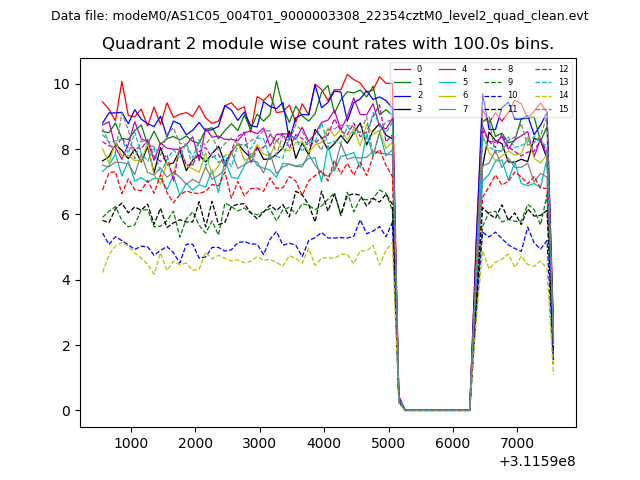
| Module-wise count rates for Quadrant B Data is divided into 100 sec bins |
 |
 |
| Module-wise count rates for Quadrant C Data is divided into 100 sec bins |
 |
 |
| Module-wise count rates for Quadrant D Data is divided into 100 sec bins |
 |
 |
| Parameter | Plot |
|---|---|
| CZT HV Monitor | 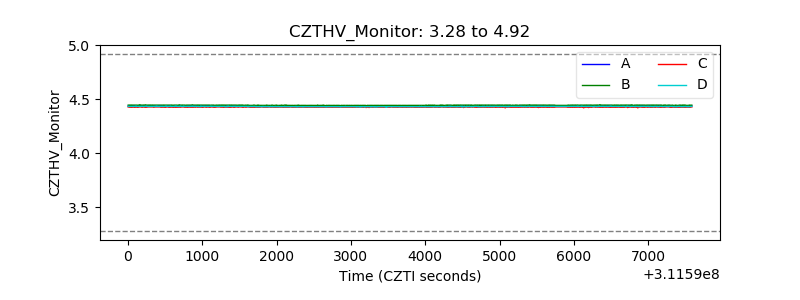 |
| D_VDD | 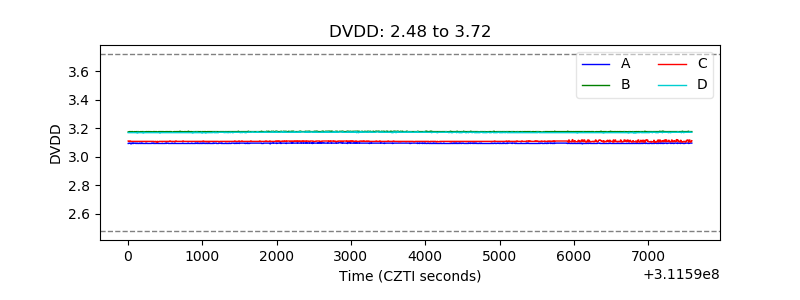 |
| Temperature 1 | 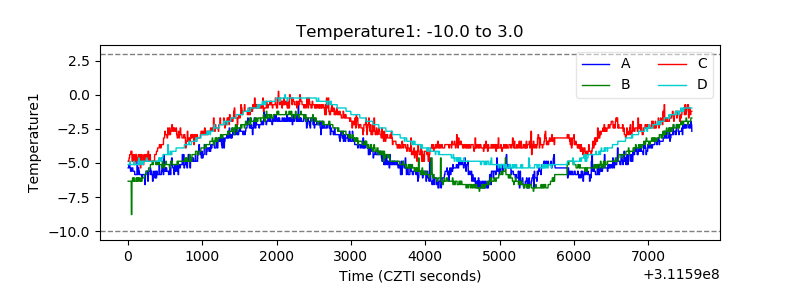 |
| Veto HV Monitor | 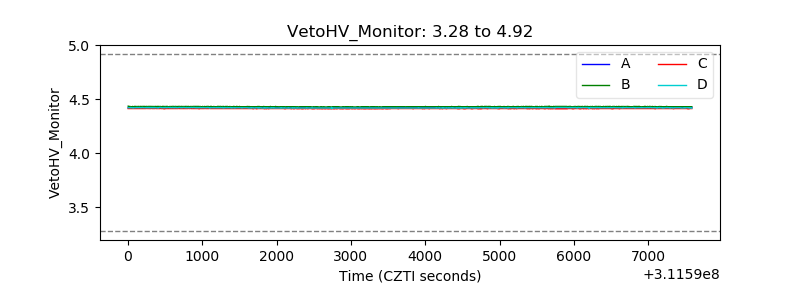 |
| Veto LLD |  |
| Alpha Counter | 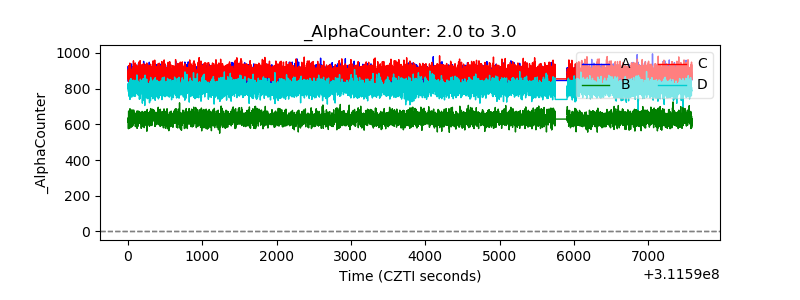 |
| _CPM_Rate | 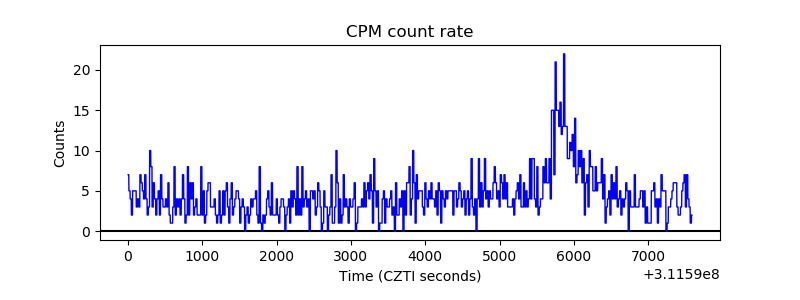 |
| CZT Counter | 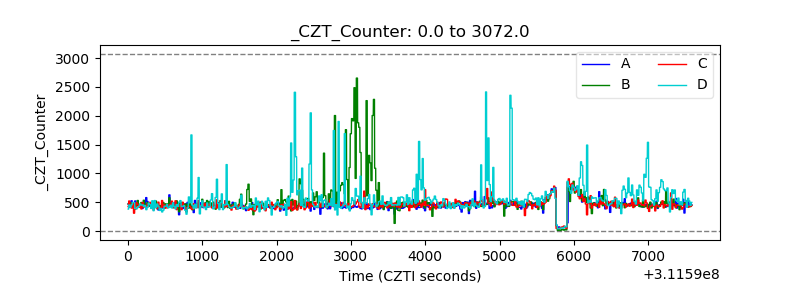 |
| +2.5 Volts monitor |  |
| +5 Volts monitor |  |
| _ROLL_ROT |  |
| _Roll_DEC | 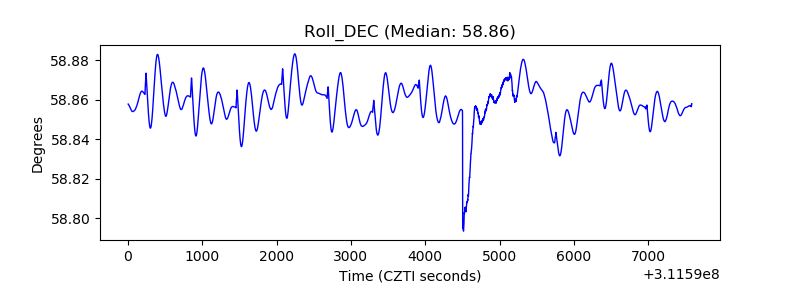 |
| _Roll_RA | 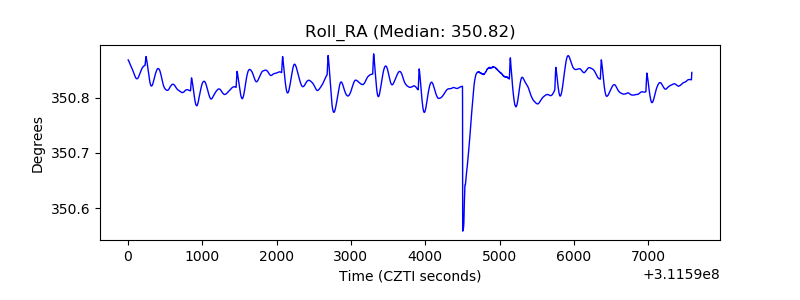 |
| Veto Counter | 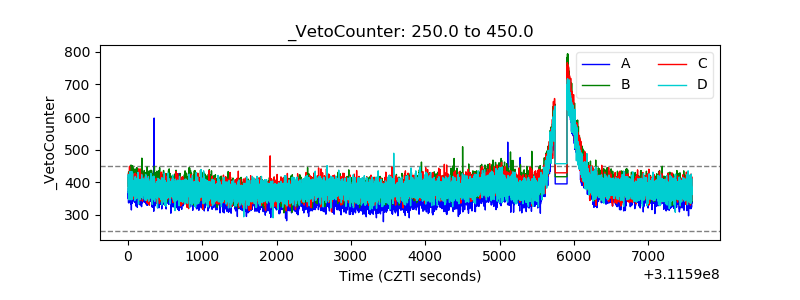 |