| Param | Original file | Final file |
|---|---|---|
| Filename | modeM0/AS1T03_156T01_9000003312cztM0_level2.fits | modeM0/AS1T03_156T01_9000003312cztM0_level2_quad_clean.evt |
| Size (bytes) | 444,827,520 | 288,339,840 |
| Size | 424.2 MB | 275.0 MB |
| Events in quadrant A | 2,754,158 | 1,486,026 |
| Events in quadrant B | 2,652,474 | 1,493,035 |
| Events in quadrant C | 2,685,162 | 1,413,755 |
| Events in quadrant D | 2,334,248 | 1,290,625 |
| Mode M9 | |||
|---|---|---|---|
| Quadrant | BADHDUFLAG | Total packets | Discarded packets |
| A | 0 | 81 | 0 |
| B | 0 | 81 | 0 |
| C | 0 | 81 | 0 |
| D | 0 | 81 | 0 |
| Mode SS | |||
|---|---|---|---|
| Quadrant | BADHDUFLAG | Total packets | Discarded packets |
| A | 0 | 910 | 0 |
| B | 0 | 910 | 0 |
| C | 0 | 910 | 0 |
| D | 0 | 910 | 0 |
| Mode M0 | |||
|---|---|---|---|
| Quadrant | BADHDUFLAG | Total packets | Discarded packets |
| A | 0 | 91635 | 0 |
| B | 0 | 93264 | 0 |
| C | 0 | 92286 | 0 |
| D | 0 | 100169 | 0 |
| Quadrant | Total seconds | Saturated seconds | Saturation percentage |
|---|---|---|---|
| A | 44361 | 369 | 0.831812% |
| B | 44361 | 544 | 1.226302% |
| C | 44361 | 625 | 1.408895% |
| D | 44361 | 484 | 1.091048% |
Noise dominated data is calculated using 1-second bins in cleaned event files. If a bin has >2000 counts, and if more than 50% of those come from <1% of pixels, then it is considered to be noise-dominated and hence unusable.
| Quadrant | # 1 sec bins | Bins with >0 counts | Bins with >2000 counts | High rate bins dominated by noise | Noise dominated (total time) | Noise dominated (detector-on time) | Marked lightcurve |
|---|---|---|---|---|---|---|---|
| A | 52666 | 44358 | 0 | 0 | 0.00% | 0.00% | 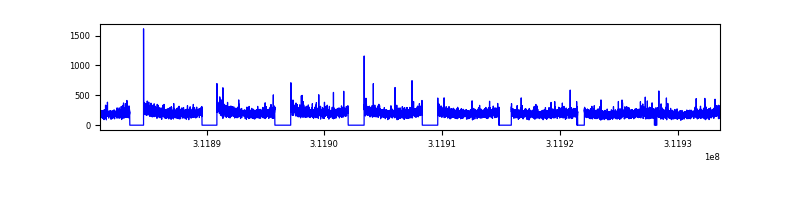 |
| B | 52666 | 44357 | 0 | 0 | 0.00% | 0.00% | 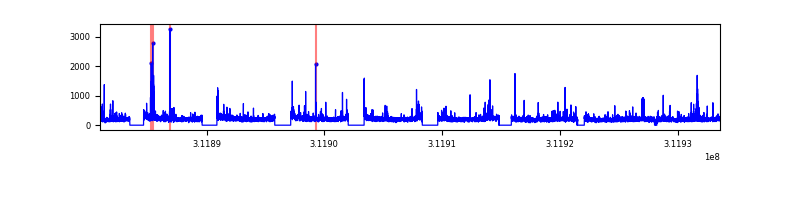 |
| C | 52666 | 44360 | 0 | 0 | 0.00% | 0.00% | 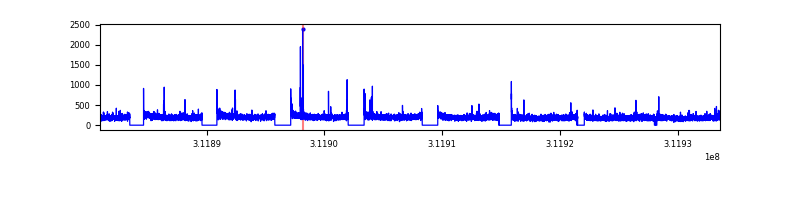 |
| D | 52666 | 44360 | 0 | 0 | 0.00% | 0.00% | 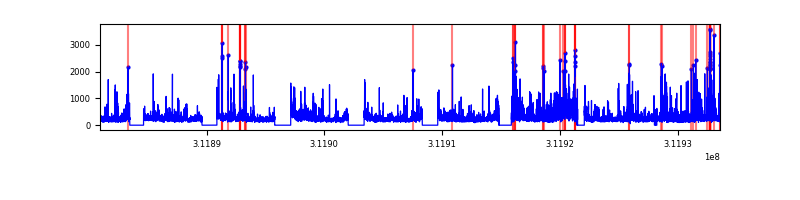 |
Top three noisy pixels from each quadrant. If the there are fewer than three noisy pixels in the level2.evt file, extra rows are filled as -1
| Pixel properties | Quadrant properties | ||||||
|---|---|---|---|---|---|---|---|
| Quadrant | DetID | PixID | Counts | Sigma | Mean | Median | Sigma |
| A | 0 | 29 | 2634 | 11.1 | 716 | 674 | 176.6 |
| A | 7 | 110 | 2159 | 8.41 | 716 | 674 | 176.6 |
| A | 9 | 19 | 2063 | 7.86 | 716 | 674 | 176.6 |
| B | 2 | 9 | 2050 | 10.02 | 701 | 671 | 137.6 |
| B | 5 | 128 | 1738 | 7.76 | 701 | 671 | 137.6 |
| B | 2 | 8 | 1727 | 7.68 | 701 | 671 | 137.6 |
| C | 3 | 234 | 1887 | 6.71 | 709 | 666 | 181.9 |
| C | 12 | 241 | 1851 | 6.52 | 709 | 666 | 181.9 |
| C | 3 | 126 | 1814 | 6.31 | 709 | 666 | 181.9 |
| D | 3 | 14 | 1686 | 6.08 | 665 | 605 | 177.7 |
| D | 10 | 189 | 1642 | 5.84 | 665 | 605 | 177.7 |
| D | 6 | 67 | 1632 | 5.78 | 665 | 605 | 177.7 |
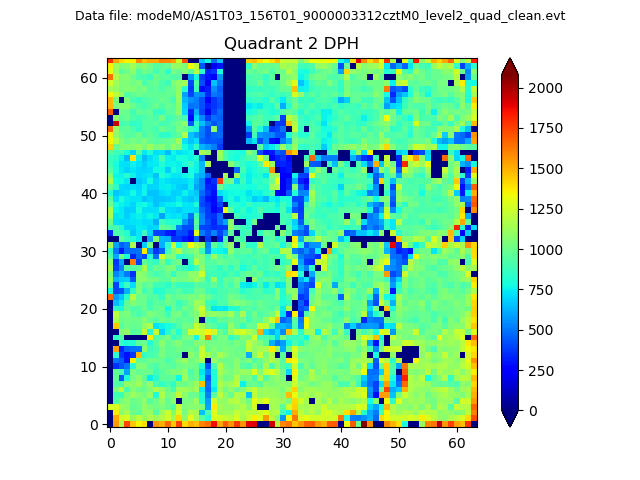
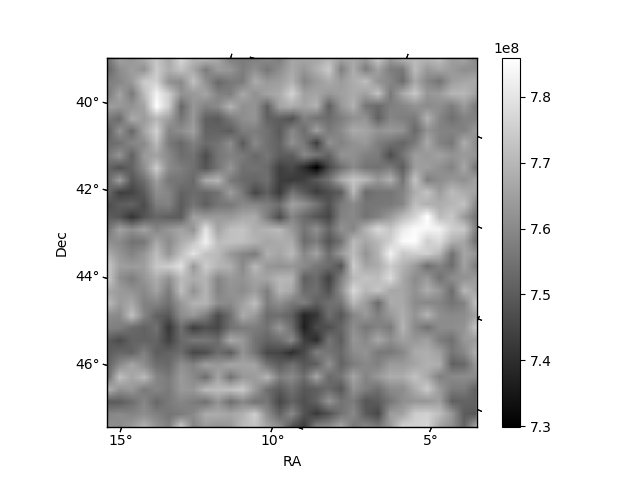
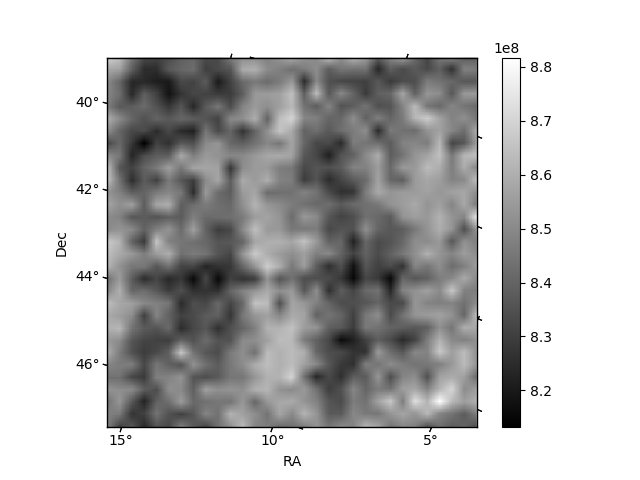
Histogram calculated using DETX and DETY for each event in the final _common_clean file
| Quadrant A | 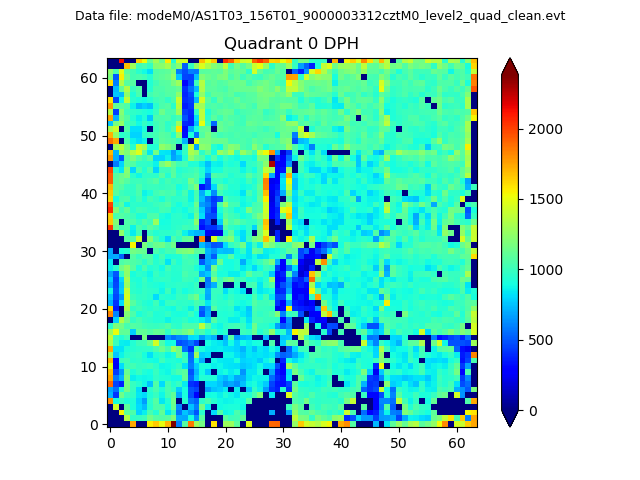 |
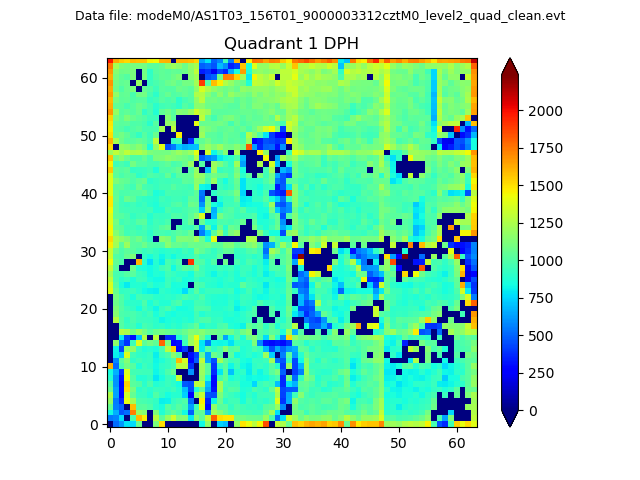 |
Quadrant B |
|---|---|---|---|
| Quadrant D | 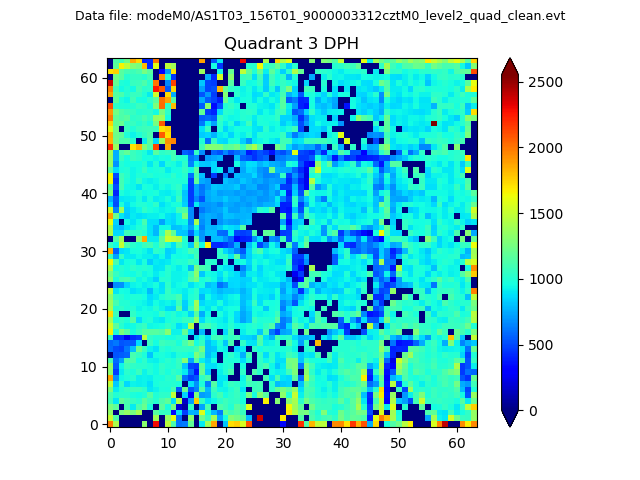 |
 |
Quadrant C |
| Plot type | Count rate plots | Images |
|---|---|---|
| Comparison with Poisson distribution Blue bars denote a histogram of data divided into 1 sec bins. Red curve is a Poisson curve with rate = median count rate of data. |
 |
 |
| Quadrant-wise count rates Data is divided into 100 sec bins |
 |
|
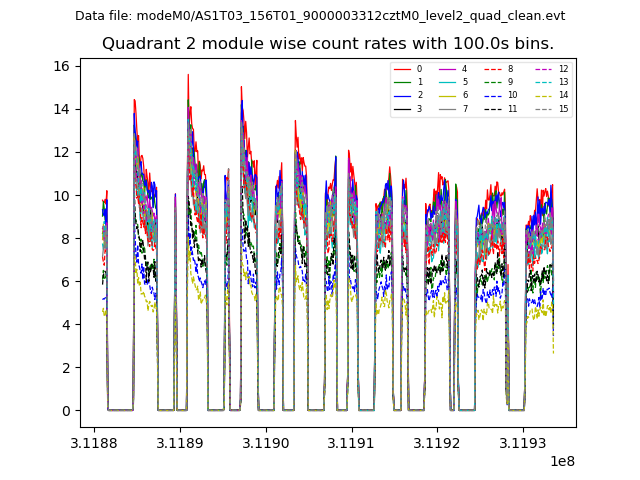
| Module-wise count rates for Quadrant A Data is divided into 100 sec bins |
 |
 |
| Module-wise count rates for Quadrant B Data is divided into 100 sec bins |
 |
 |
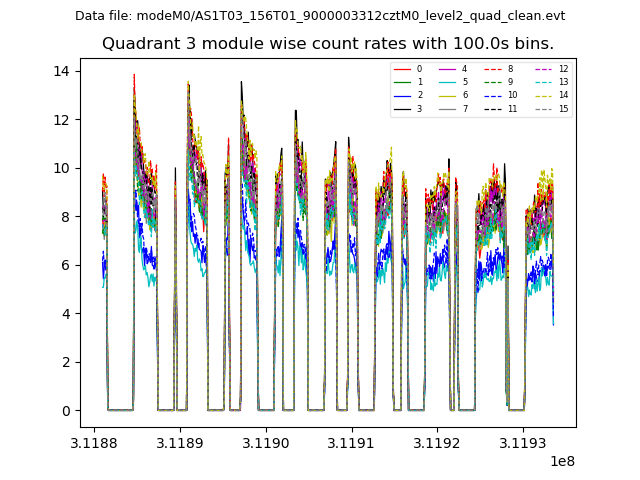
| Module-wise count rates for Quadrant C Data is divided into 100 sec bins |
 |
 |
| Module-wise count rates for Quadrant D Data is divided into 100 sec bins |
 |
 |
| Parameter | Plot |
|---|---|
| CZT HV Monitor | 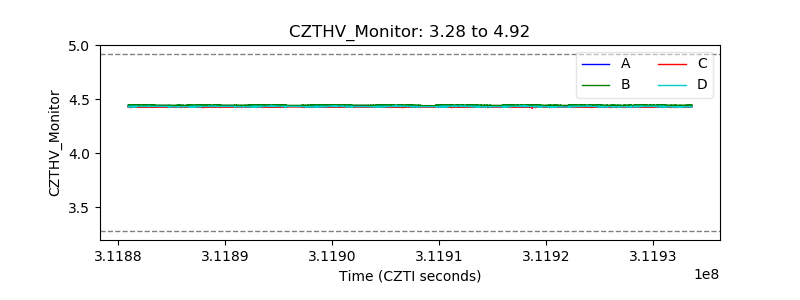 |
| D_VDD | 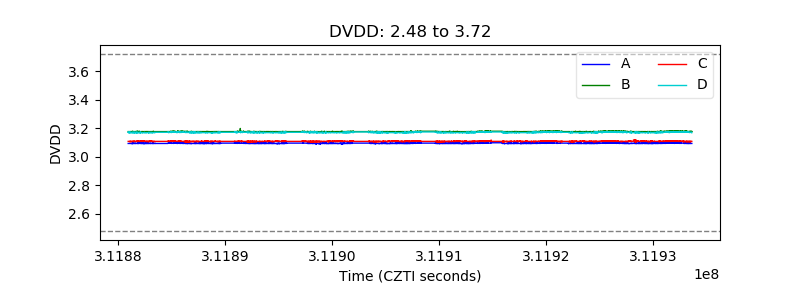 |
| Temperature 1 | 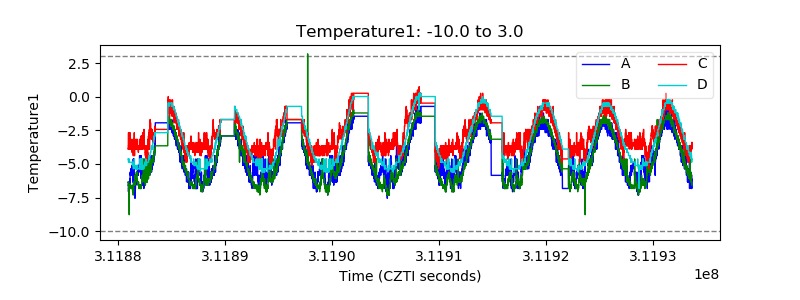 |
| Veto HV Monitor | 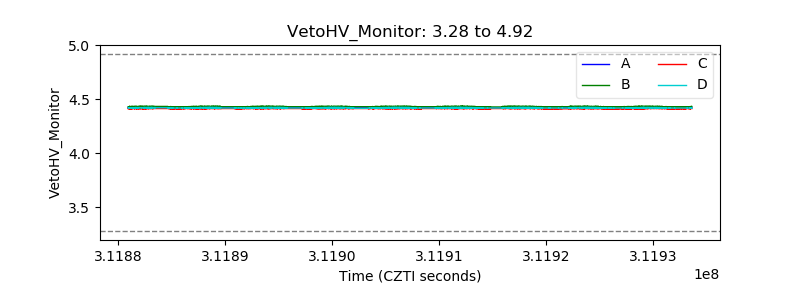 |
| Veto LLD | 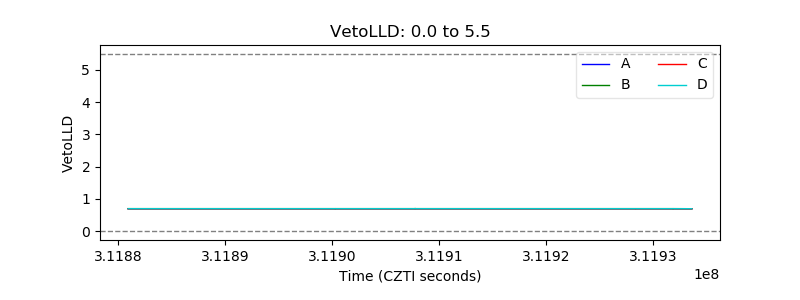 |
| Alpha Counter |  |
| _CPM_Rate |  |
| CZT Counter | 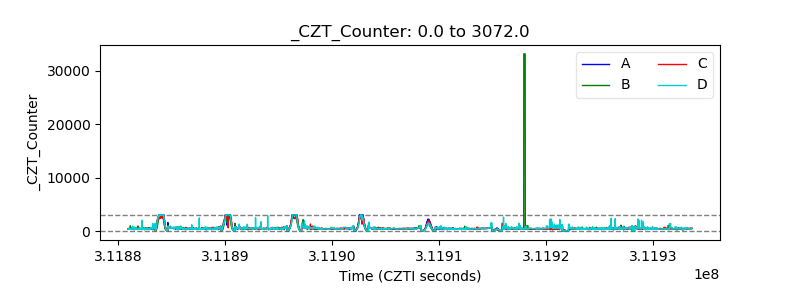 |
| +2.5 Volts monitor | 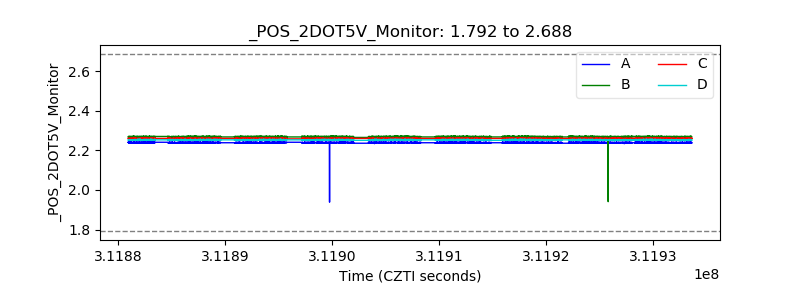 |
| +5 Volts monitor | 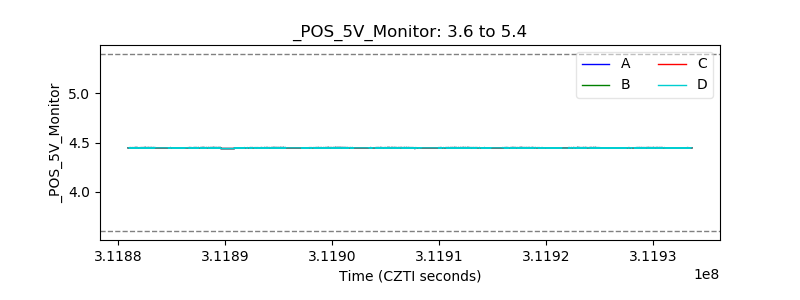 |
| _ROLL_ROT | 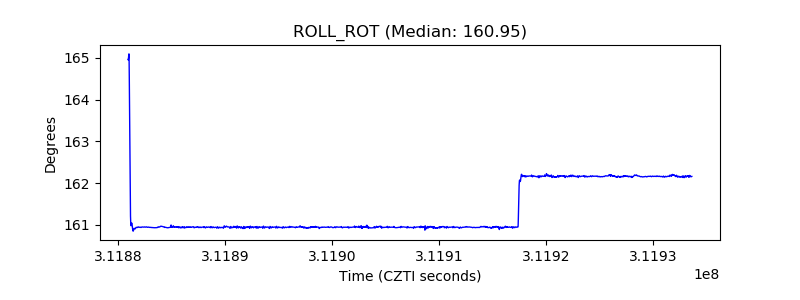 |
| _Roll_DEC | 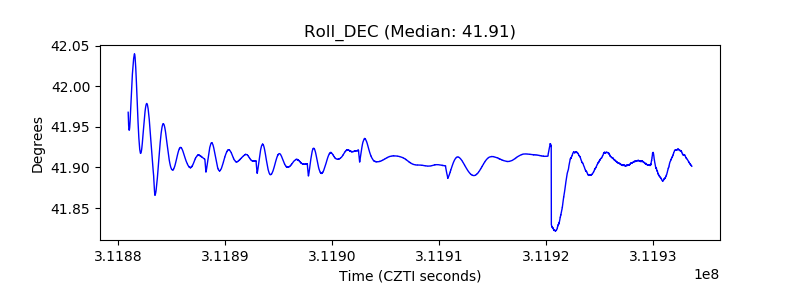 |
| _Roll_RA |  |
| Veto Counter | 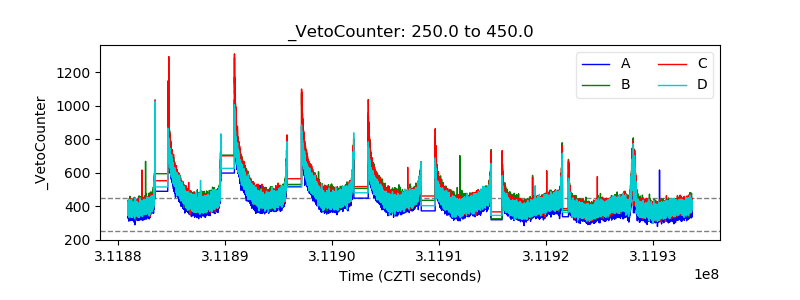 |