| Param | Original file | Final file |
|---|---|---|
| Filename | modeM0/AS1T03_156T01_9000003312_22404cztM0_level2.evt | modeM0/AS1T03_156T01_9000003312_22404cztM0_level2_quad_clean.evt |
| Size (bytes) | 263,318,400 | 45,803,520 |
| Size | 251.1 MB | 43.7 MB |
| Events in quadrant A | 1,862,286 | 285,108 |
| Events in quadrant B | 1,985,087 | 286,558 |
| Events in quadrant C | 1,896,110 | 276,175 |
| Events in quadrant D | 1,971,915 | 270,740 |
| Mode M9 | |||
|---|---|---|---|
| Quadrant | BADHDUFLAG | Total packets | Discarded packets |
| A | 0 | 12 | 0 |
| B | 0 | 12 | 0 |
| C | 0 | 12 | 0 |
| D | 0 | 12 | 0 |
| Mode SS | |||
|---|---|---|---|
| Quadrant | BADHDUFLAG | Total packets | Discarded packets |
| A | 0 | 78 | 0 |
| B | 0 | 78 | 0 |
| C | 0 | 78 | 0 |
| D | 0 | 78 | 0 |
| Mode M0 | |||
|---|---|---|---|
| Quadrant | BADHDUFLAG | Total packets | Discarded packets |
| A | 0 | 8086 | 2 |
| B | 0 | 8385 | 1 |
| C | 0 | 8102 | 1 |
| D | 0 | 8462 | 1 |
| Quadrant | Total seconds | Saturated seconds | Saturation percentage |
|---|---|---|---|
| A | 3791 | 44 | 1.160644% |
| B | 3791 | 70 | 1.846479% |
| C | 3791 | 66 | 1.740965% |
| D | 3791 | 49 | 1.292535% |
Noise dominated data is calculated using 1-second bins in cleaned event files. If a bin has >2000 counts, and if more than 50% of those come from <1% of pixels, then it is considered to be noise-dominated and hence unusable.
| Quadrant | # 1 sec bins | Bins with >0 counts | Bins with >2000 counts | High rate bins dominated by noise | Noise dominated (total time) | Noise dominated (detector-on time) | Marked lightcurve |
|---|---|---|---|---|---|---|---|
| A | 4966 | 3791 | 1 | 1 | 0.02% | 0.03% | 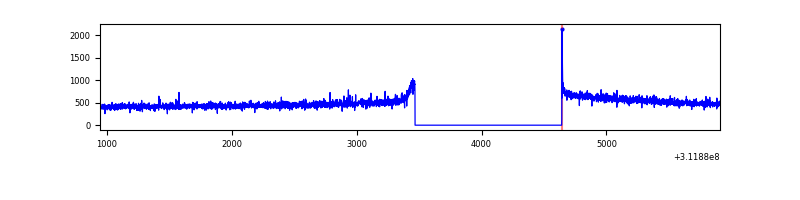 |
| B | 4966 | 3791 | 21 | 21 | 0.42% | 0.55% | 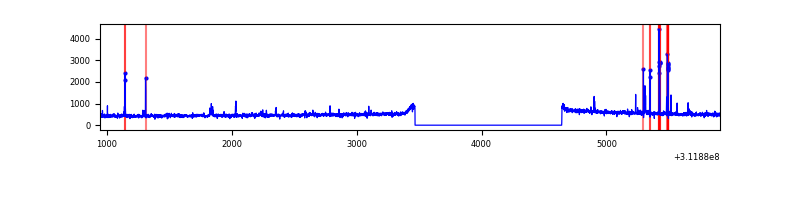 |
| C | 4966 | 3791 | 0 | 0 | 0.00% | 0.00% | 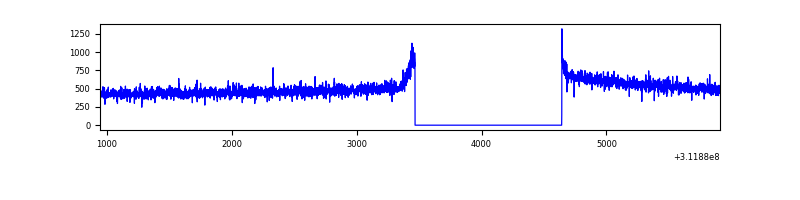 |
| D | 4966 | 3791 | 10 | 10 | 0.20% | 0.26% | 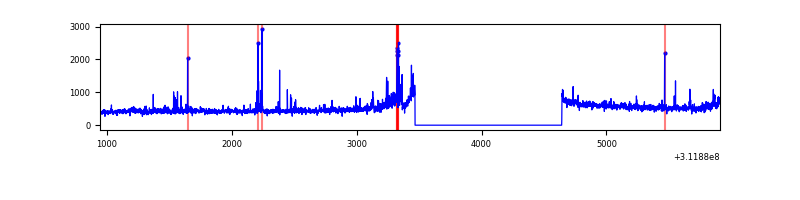 |
Top three noisy pixels from each quadrant. If the there are fewer than three noisy pixels in the level2.evt file, extra rows are filled as -1
| Pixel properties | Quadrant properties | ||||||
|---|---|---|---|---|---|---|---|
| Quadrant | DetID | PixID | Counts | Sigma | Mean | Median | Sigma |
| A | 13 | 254 | 4997 | 46.62 | 482 | 472 | 97.1 |
| A | 15 | 48 | 4723 | 43.8 | 482 | 472 | 97.1 |
| A | 0 | 226 | 4128 | 37.67 | 482 | 472 | 97.1 |
| B | 3 | 64 | 95040 | 1032.89 | 478 | 466 | 91.6 |
| B | 12 | 111 | 10895 | 113.9 | 478 | 466 | 91.6 |
| B | 11 | 111 | 9574 | 99.47 | 478 | 466 | 91.6 |
| C | 14 | 238 | 73346 | 668.42 | 465 | 469 | 109.0 |
| C | 10 | 22 | 6211 | 52.66 | 465 | 469 | 109.0 |
| C | 13 | 61 | 3175 | 24.82 | 465 | 469 | 109.0 |
| D | 7 | 223 | 72522 | 633.0 | 469 | 455 | 113.8 |
| D | 1 | 52 | 63467 | 553.47 | 469 | 455 | 113.8 |
| D | 12 | 227 | 31729 | 274.7 | 469 | 455 | 113.8 |
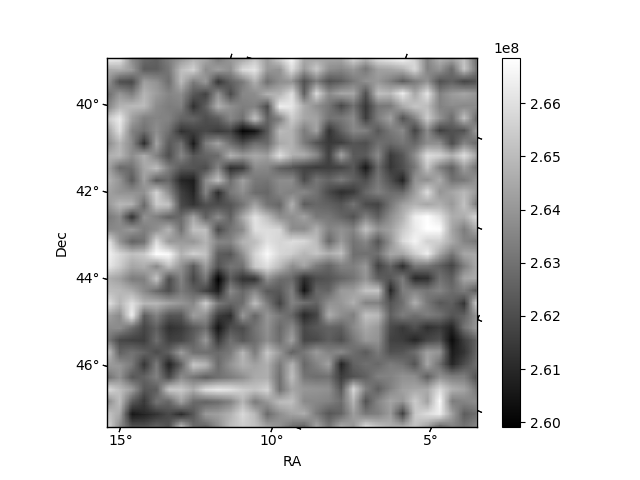
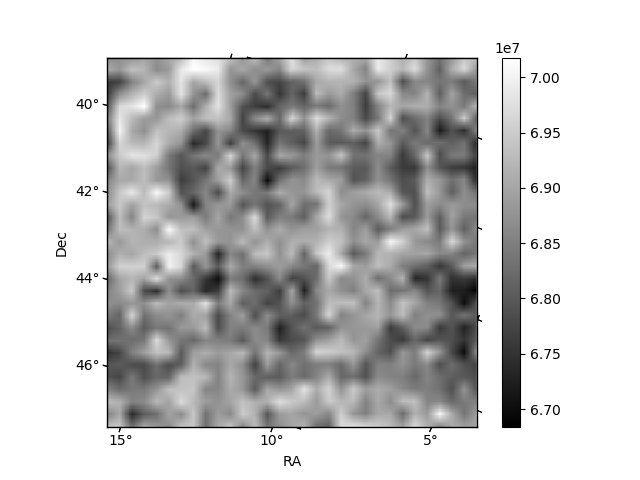
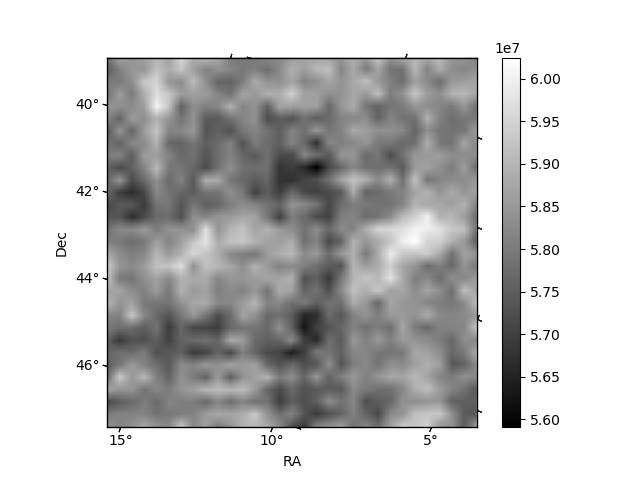
Histogram calculated using DETX and DETY for each event in the final _common_clean file
| Quadrant A | 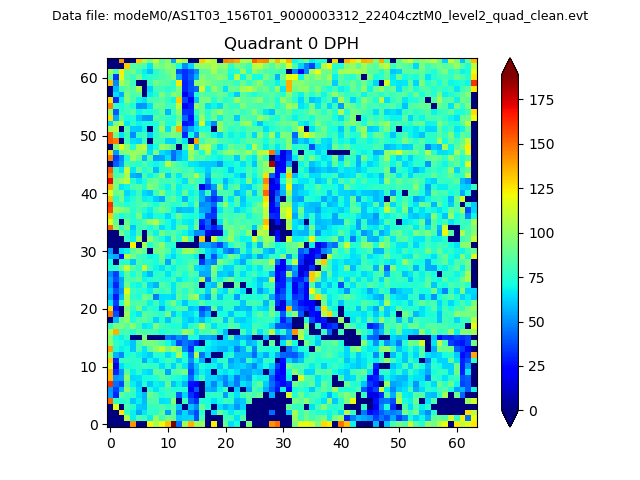 |
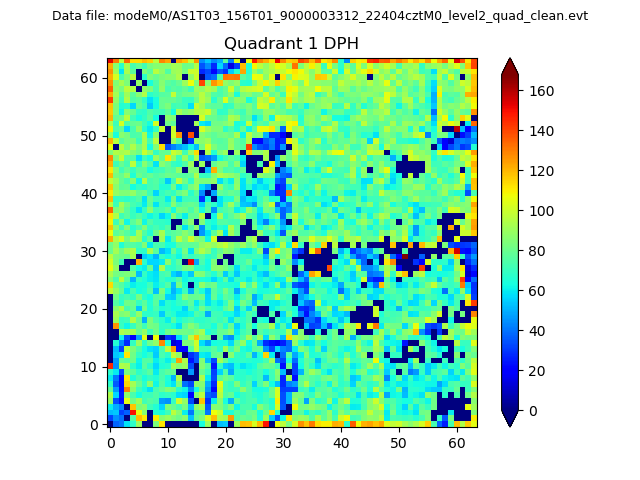 |
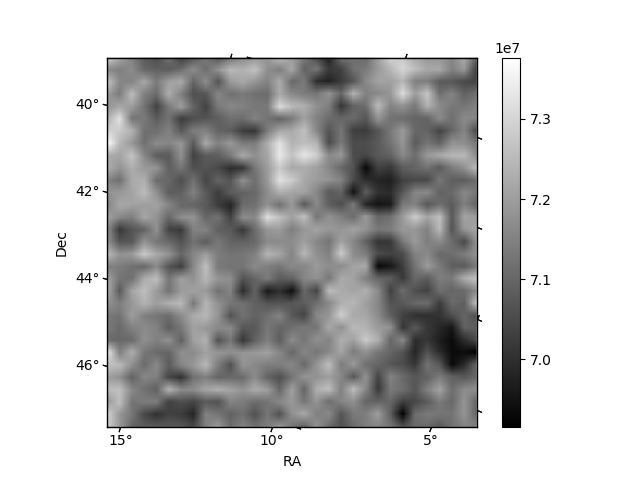
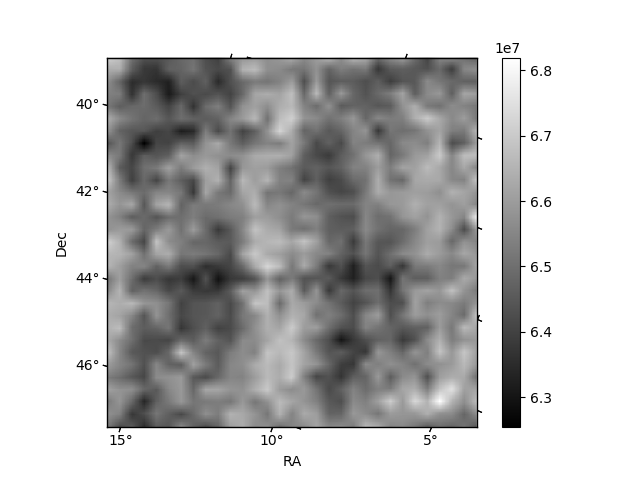
Quadrant B |
|---|---|---|---|
| Quadrant D | 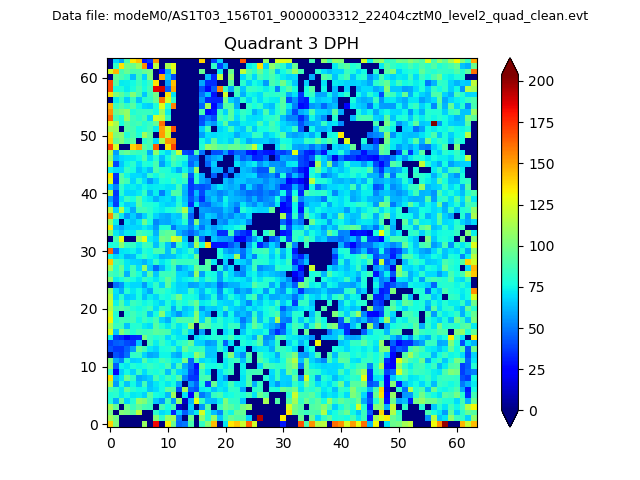 |
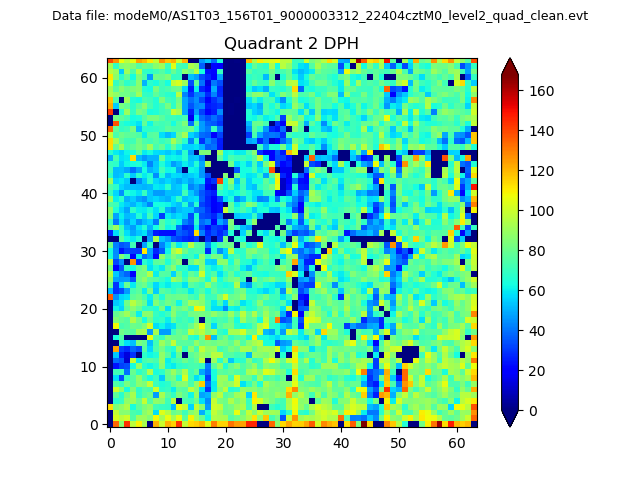 |
Quadrant C |
| Plot type | Count rate plots | Images |
|---|---|---|
| Comparison with Poisson distribution Blue bars denote a histogram of data divided into 1 sec bins. Red curve is a Poisson curve with rate = median count rate of data. |
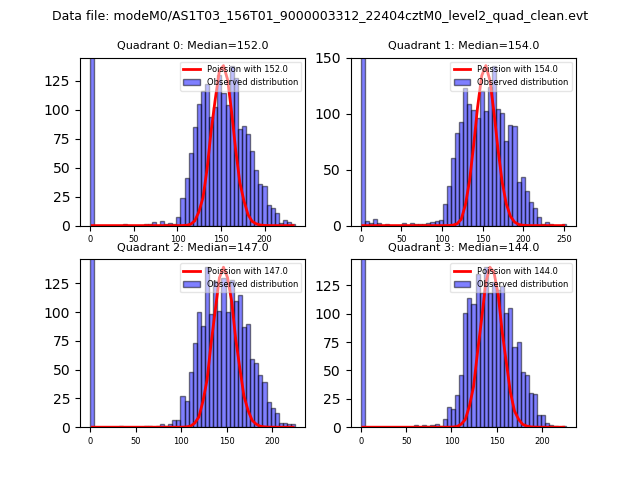 |
 |
| Quadrant-wise count rates Data is divided into 100 sec bins |
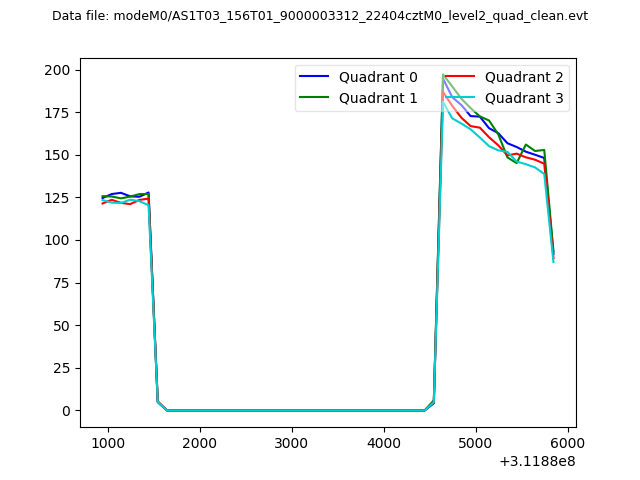 |
|
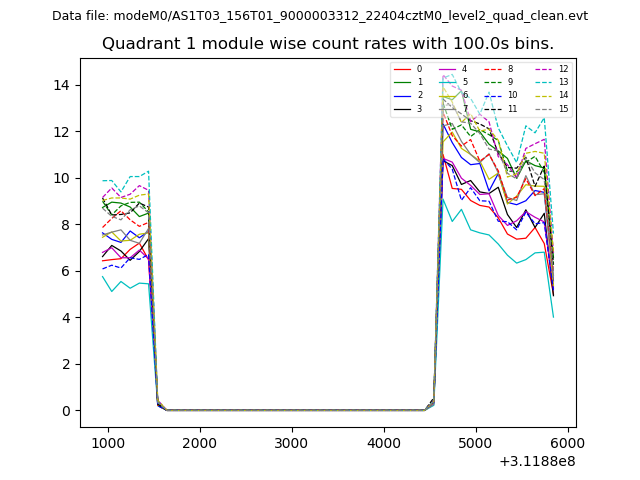
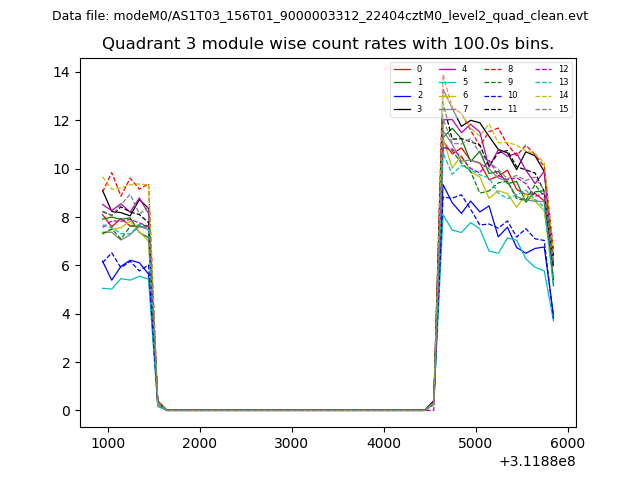
| Module-wise count rates for Quadrant A Data is divided into 100 sec bins |
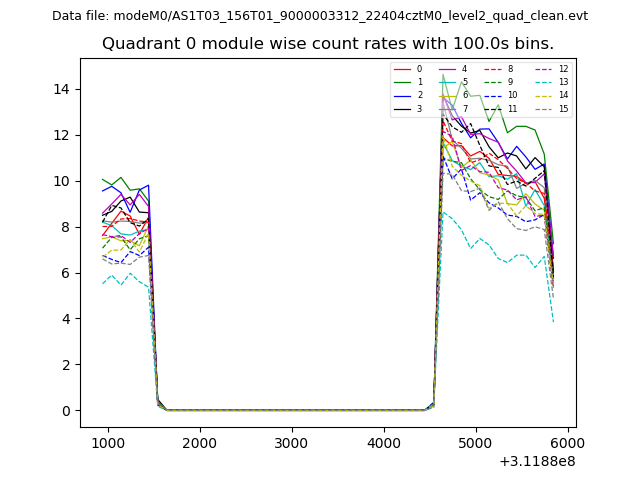 |
 |
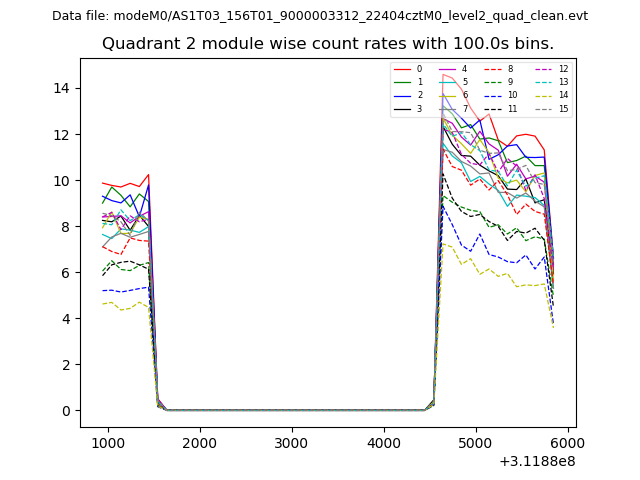
| Module-wise count rates for Quadrant B Data is divided into 100 sec bins |
 |
 |
| Module-wise count rates for Quadrant C Data is divided into 100 sec bins |
 |
 |
| Module-wise count rates for Quadrant D Data is divided into 100 sec bins |
 |
 |
| Parameter | Plot |
|---|---|
| CZT HV Monitor | 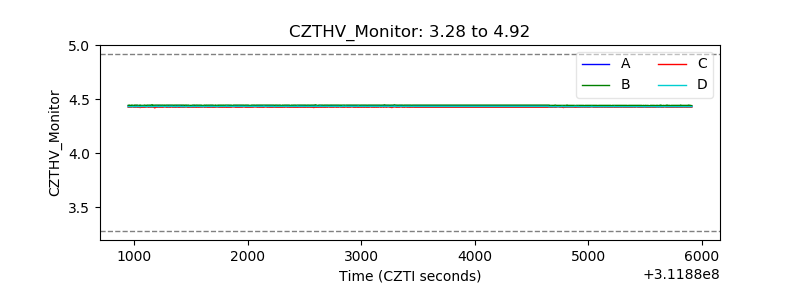 |
| D_VDD | 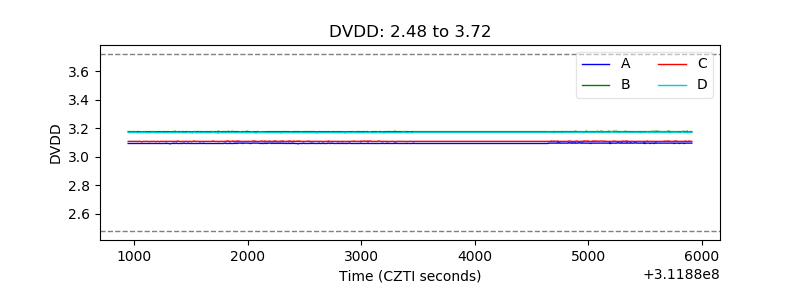 |
| Temperature 1 | 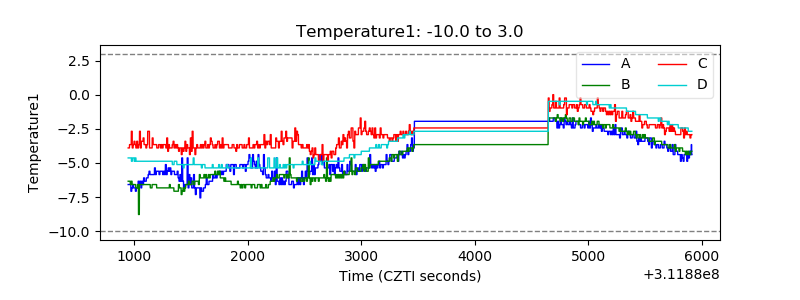 |
| Veto HV Monitor | 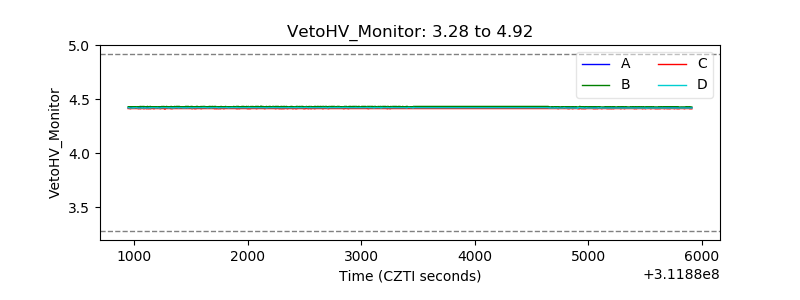 |
| Veto LLD | 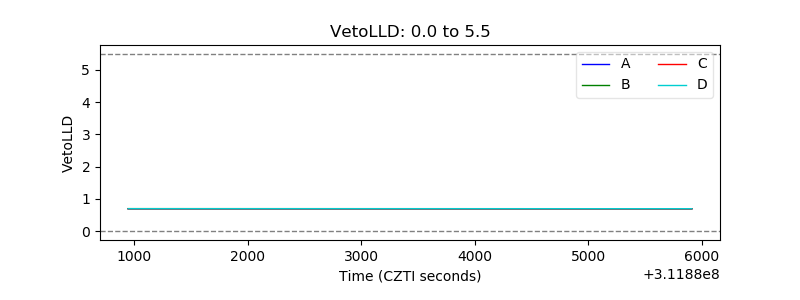 |
| Alpha Counter | 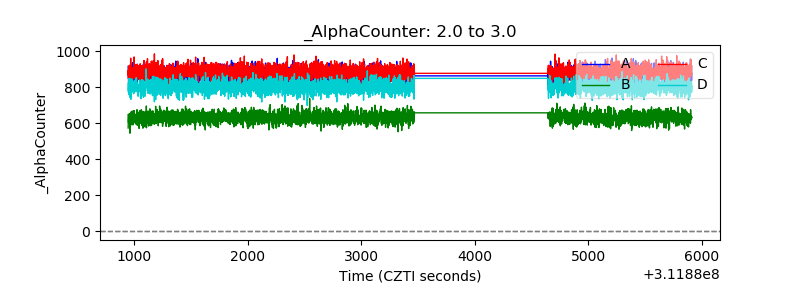 |
| _CPM_Rate | 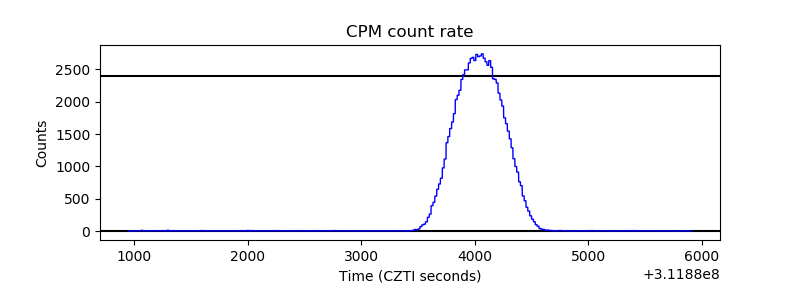 |
| CZT Counter | 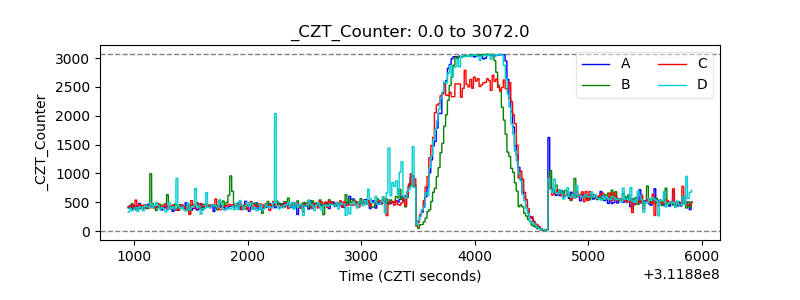 |
| +2.5 Volts monitor |  |
| +5 Volts monitor |  |
| _ROLL_ROT | 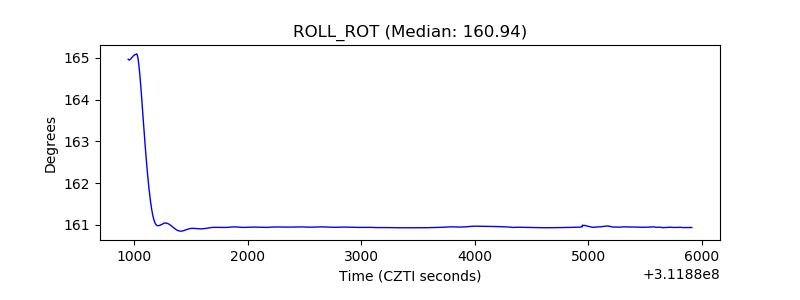 |
| _Roll_DEC | 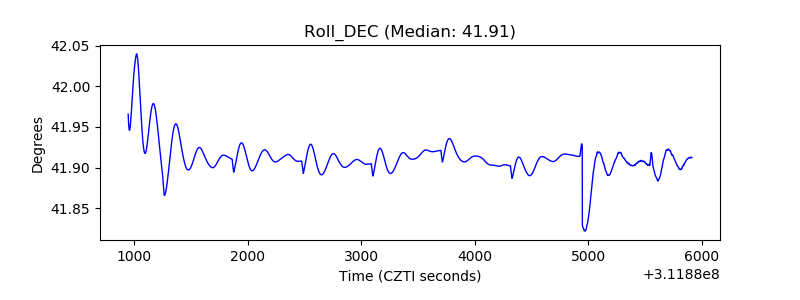 |
| _Roll_RA | 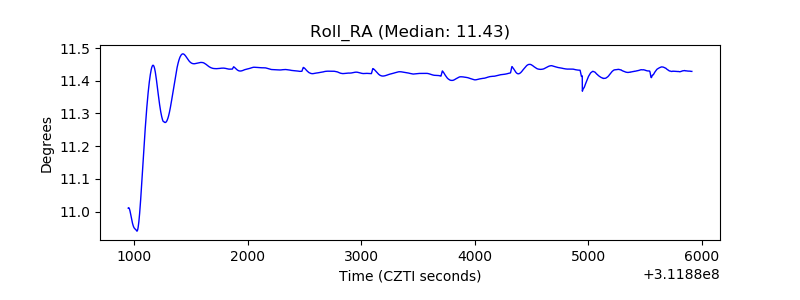 |
| Veto Counter | 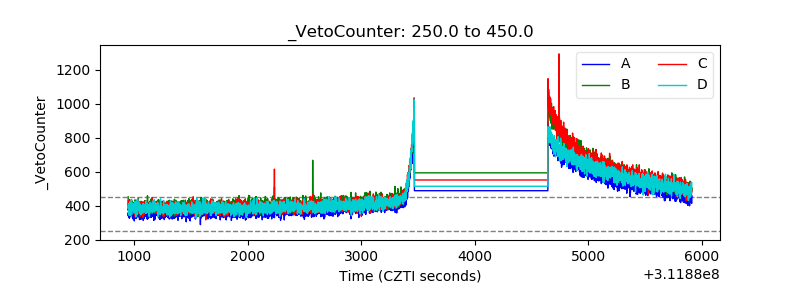 |