| Param | Original file | Final file |
|---|---|---|
| Filename | modeM0/AS1T03_156T01_9000003312_22405cztM0_level2.evt | modeM0/AS1T03_156T01_9000003312_22405cztM0_level2_quad_clean.evt |
| Size (bytes) | 438,658,560 | 100,128,960 |
| Size | 418.3 MB | 95.5 MB |
| Events in quadrant A | 3,119,815 | 661,059 |
| Events in quadrant B | 3,268,361 | 671,948 |
| Events in quadrant C | 3,199,301 | 641,520 |
| Events in quadrant D | 3,273,176 | 622,259 |
| Mode M9 | |||
|---|---|---|---|
| Quadrant | BADHDUFLAG | Total packets | Discarded packets |
| A | 0 | 19 | 0 |
| B | 0 | 20 | 0 |
| C | 0 | 20 | 0 |
| D | 0 | 20 | 0 |
| Mode SS | |||
|---|---|---|---|
| Quadrant | BADHDUFLAG | Total packets | Discarded packets |
| A | 0 | 128 | 0 |
| B | 0 | 128 | 0 |
| C | 0 | 128 | 0 |
| D | 0 | 128 | 0 |
| Mode M0 | |||
|---|---|---|---|
| Quadrant | BADHDUFLAG | Total packets | Discarded packets |
| A | 0 | 13377 | 2 |
| B | 0 | 13716 | 2 |
| C | 0 | 13509 | 2 |
| D | 0 | 13856 | 2 |
| Quadrant | Total seconds | Saturated seconds | Saturation percentage |
|---|---|---|---|
| A | 6237 | 40 | 0.641334% |
| B | 6237 | 68 | 1.090268% |
| C | 6237 | 86 | 1.378868% |
| D | 6237 | 43 | 0.689434% |
Noise dominated data is calculated using 1-second bins in cleaned event files. If a bin has >2000 counts, and if more than 50% of those come from <1% of pixels, then it is considered to be noise-dominated and hence unusable.
| Quadrant | # 1 sec bins | Bins with >0 counts | Bins with >2000 counts | High rate bins dominated by noise | Noise dominated (total time) | Noise dominated (detector-on time) | Marked lightcurve |
|---|---|---|---|---|---|---|---|
| A | 7507 | 6238 | 1 | 1 | 0.01% | 0.02% | 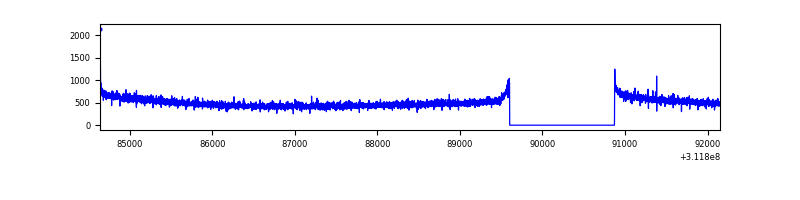 |
| B | 7507 | 6238 | 20 | 20 | 0.27% | 0.32% |  |
| C | 7507 | 6238 | 0 | 0 | 0.00% | 0.00% | 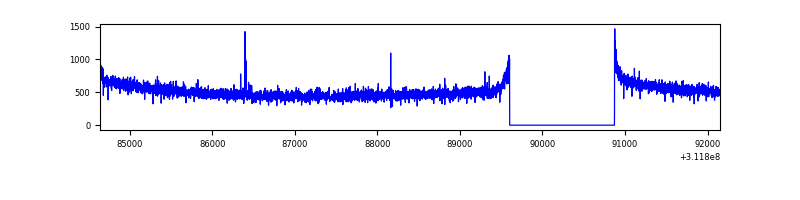 |
| D | 7507 | 6238 | 16 | 16 | 0.21% | 0.26% | 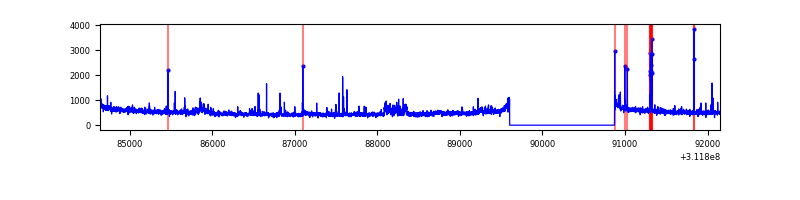 |
Top three noisy pixels from each quadrant. If the there are fewer than three noisy pixels in the level2.evt file, extra rows are filled as -1
| Pixel properties | Quadrant properties | ||||||
|---|---|---|---|---|---|---|---|
| Quadrant | DetID | PixID | Counts | Sigma | Mean | Median | Sigma |
| A | 13 | 254 | 9449 | 53.86 | 806 | 792 | 160.7 |
| A | 3 | 1 | 8495 | 47.92 | 806 | 792 | 160.7 |
| A | 0 | 226 | 7097 | 39.22 | 806 | 792 | 160.7 |
| B | 3 | 64 | 89500 | 599.65 | 803 | 785 | 147.9 |
| B | 12 | 111 | 17162 | 110.7 | 803 | 785 | 147.9 |
| B | 11 | 111 | 14982 | 95.96 | 803 | 785 | 147.9 |
| C | 14 | 238 | 124631 | 680.67 | 784 | 791 | 181.9 |
| C | 10 | 22 | 10402 | 52.82 | 784 | 791 | 181.9 |
| C | 0 | 10 | 9591 | 48.37 | 784 | 791 | 181.9 |
| D | 7 | 223 | 92158 | 481.02 | 789 | 766 | 190.0 |
| D | 12 | 227 | 68608 | 357.07 | 789 | 766 | 190.0 |
| D | 1 | 52 | 50891 | 263.82 | 789 | 766 | 190.0 |
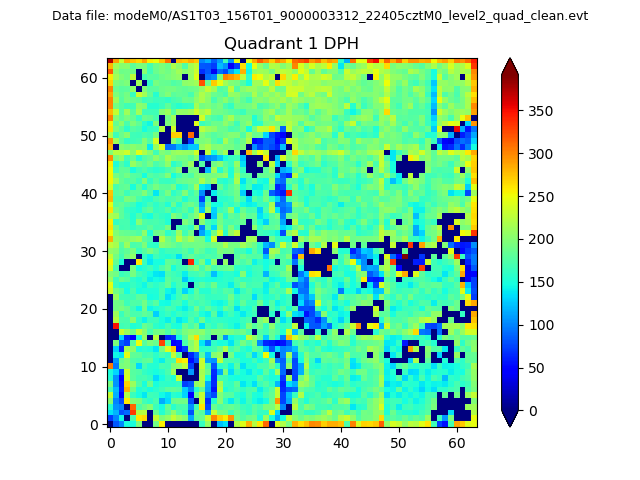
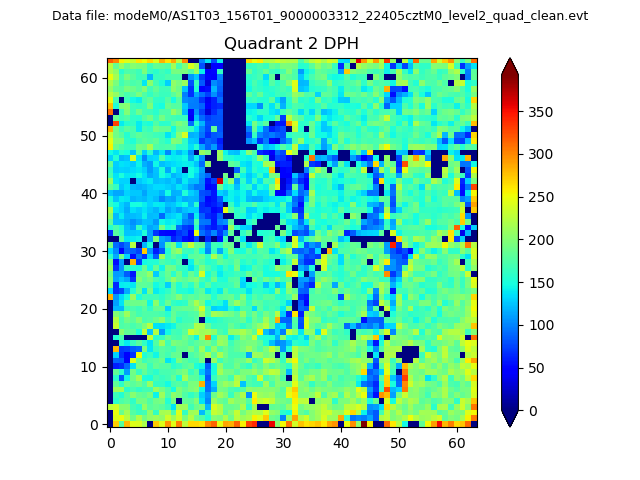
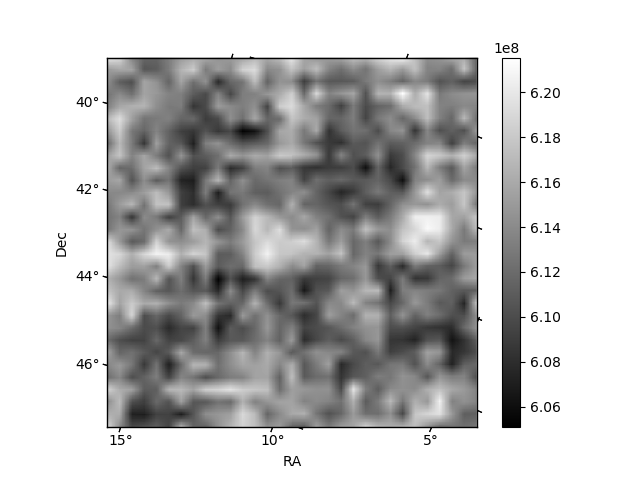
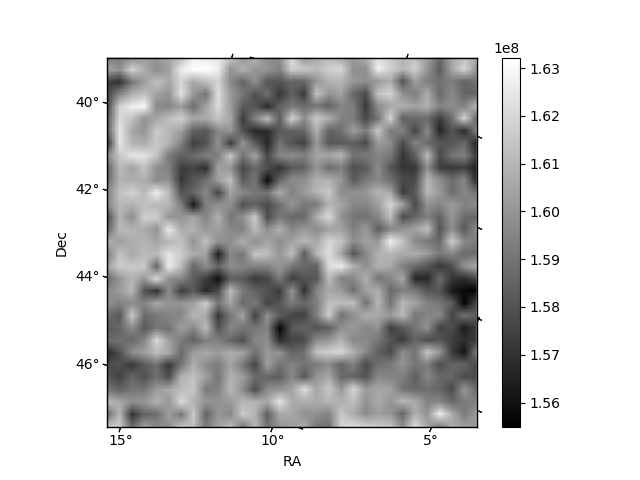
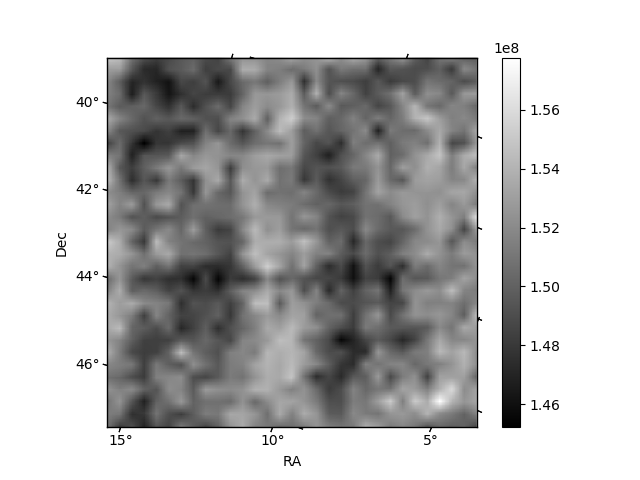
Histogram calculated using DETX and DETY for each event in the final _common_clean file
| Quadrant A | 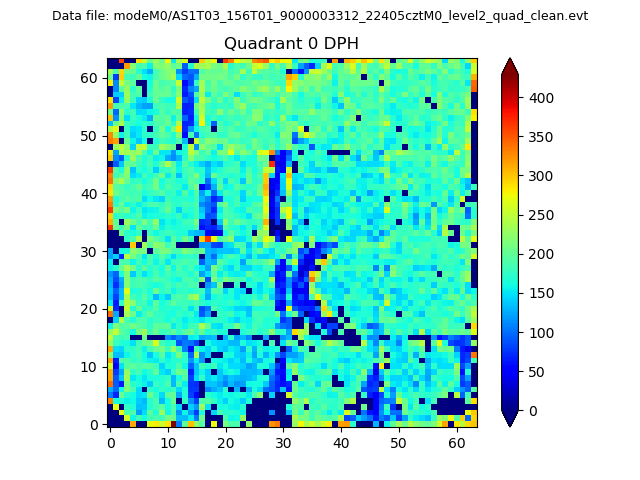 |
 |
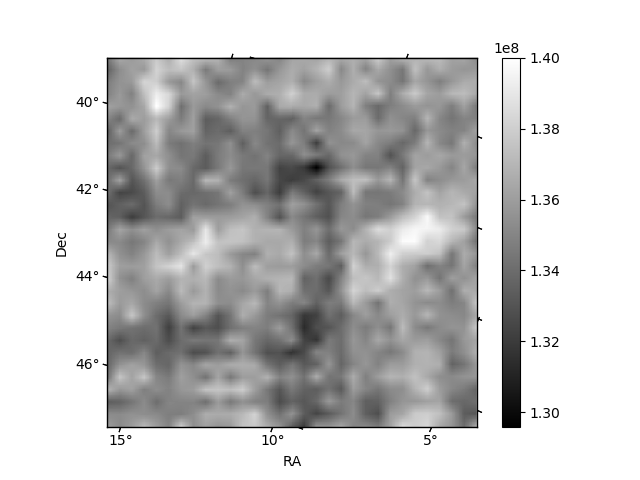
Quadrant B |
|---|---|---|---|
| Quadrant D | 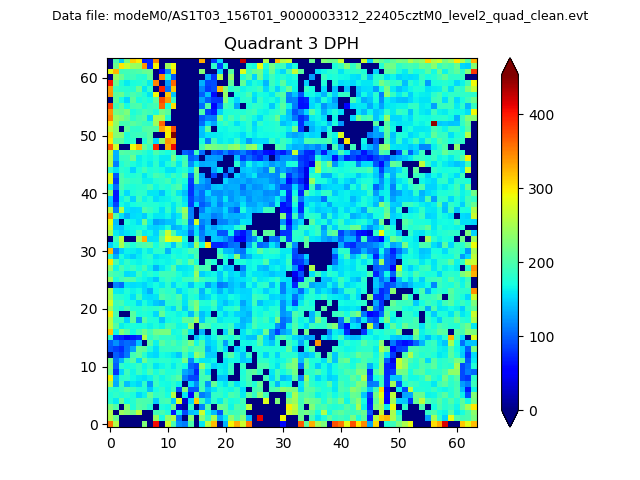 |
 |
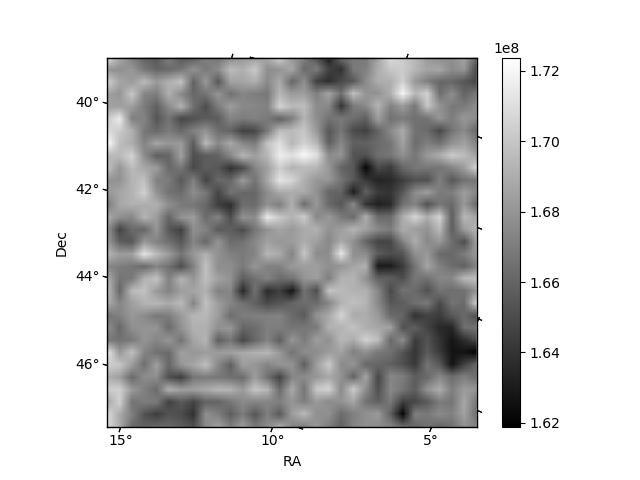
Quadrant C |
| Plot type | Count rate plots | Images |
|---|---|---|
| Comparison with Poisson distribution Blue bars denote a histogram of data divided into 1 sec bins. Red curve is a Poisson curve with rate = median count rate of data. |
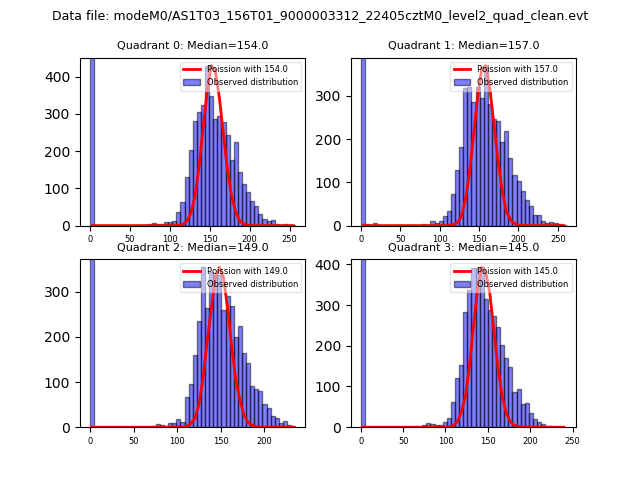 |
 |
| Quadrant-wise count rates Data is divided into 100 sec bins |
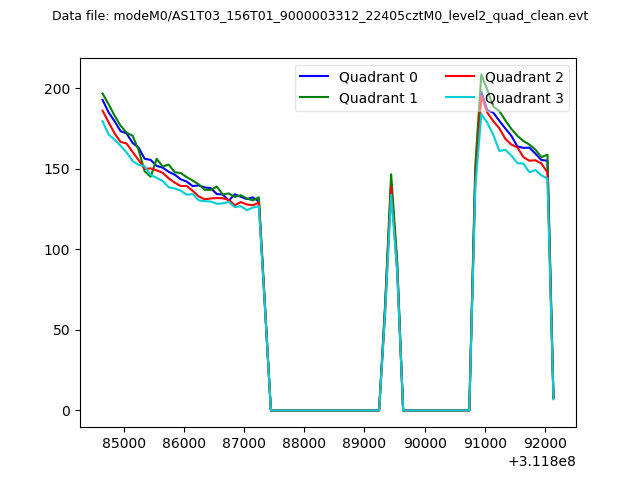 |
|
| Module-wise count rates for Quadrant A Data is divided into 100 sec bins |
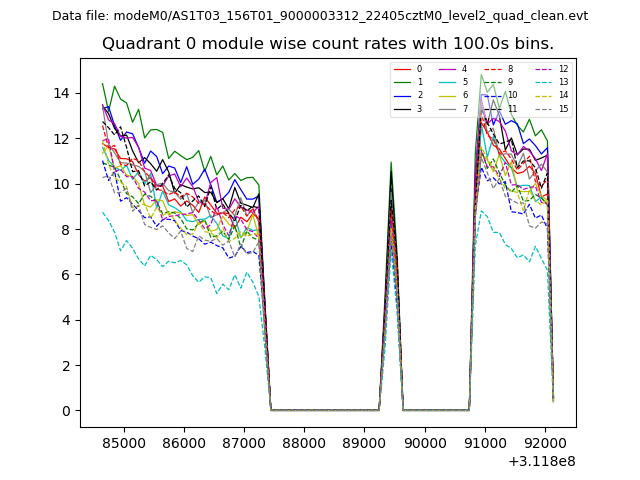 |
 |
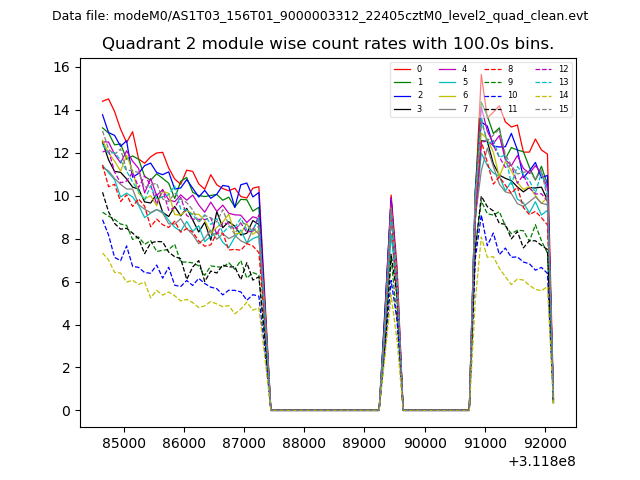
| Module-wise count rates for Quadrant B Data is divided into 100 sec bins |
 |
 |
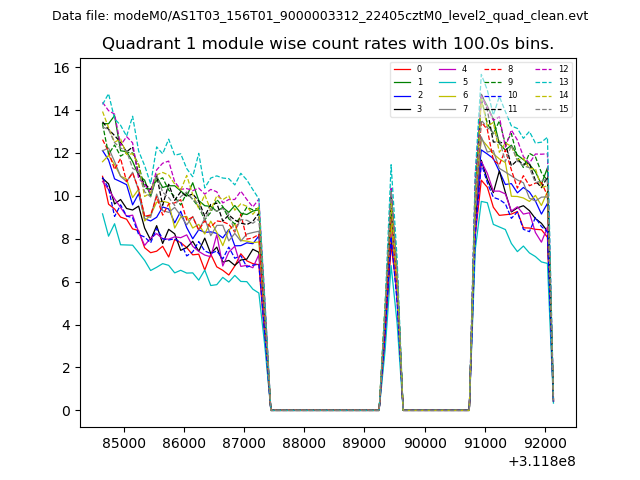
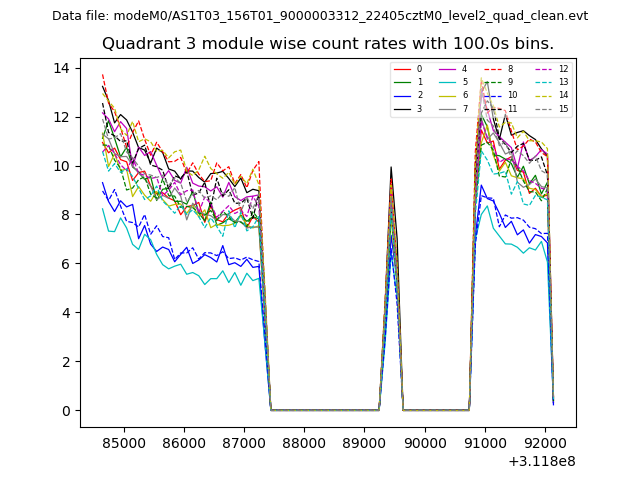
| Module-wise count rates for Quadrant C Data is divided into 100 sec bins |
 |
 |
| Module-wise count rates for Quadrant D Data is divided into 100 sec bins |
 |
 |
| Parameter | Plot |
|---|---|
| CZT HV Monitor | 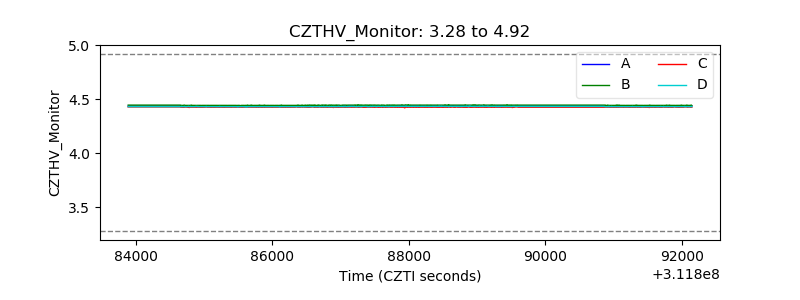 |
| D_VDD | 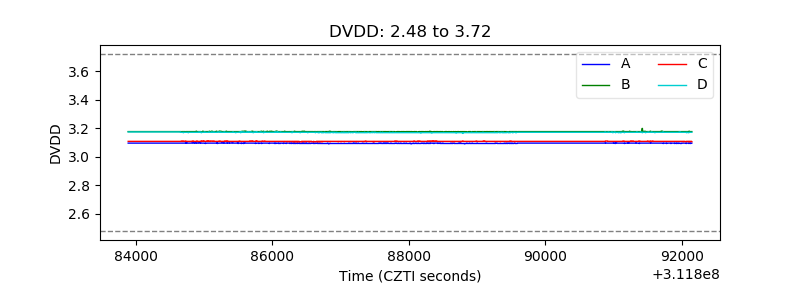 |
| Temperature 1 |  |
| Veto HV Monitor | 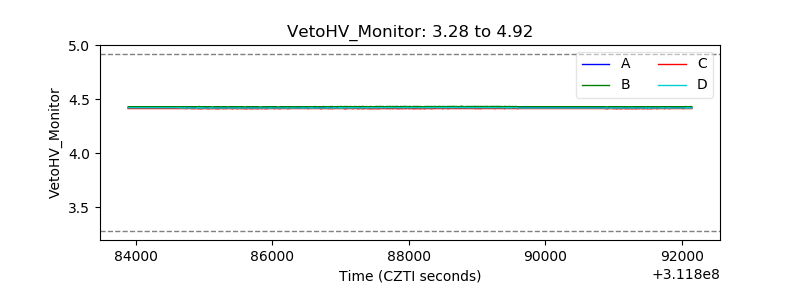 |
| Veto LLD | 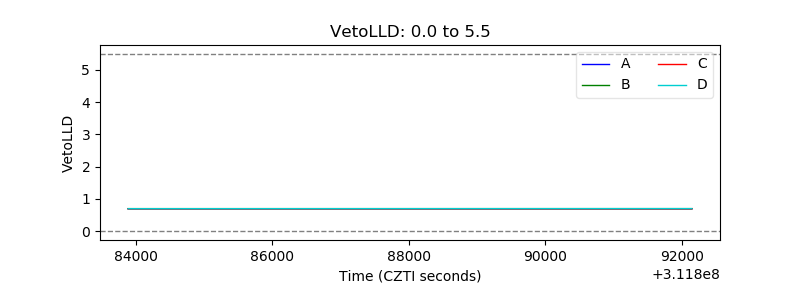 |
| Alpha Counter | 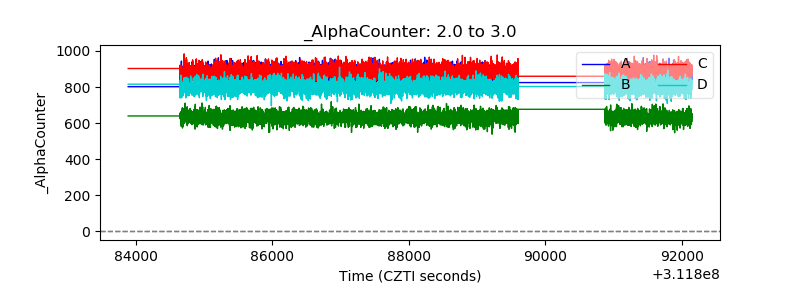 |
| _CPM_Rate | 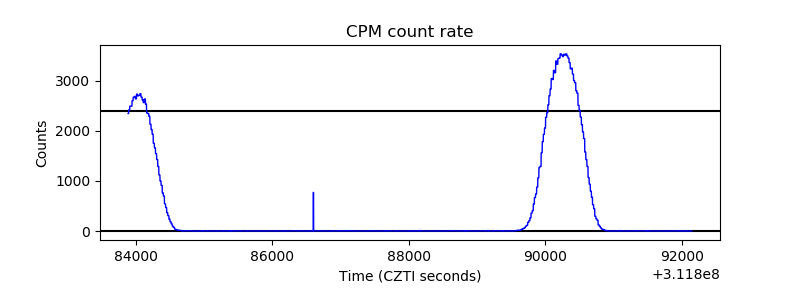 |
| CZT Counter | 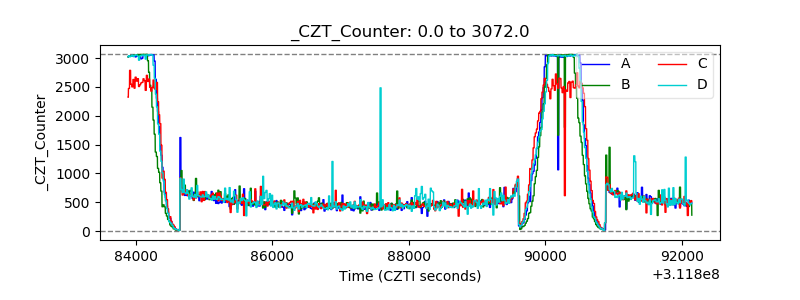 |
| +2.5 Volts monitor |  |
| +5 Volts monitor |  |
| _ROLL_ROT | 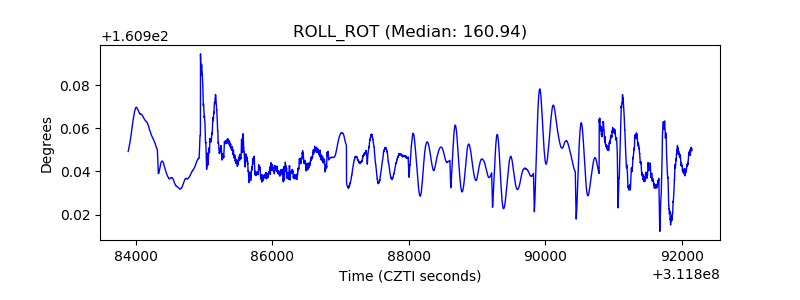 |
| _Roll_DEC | 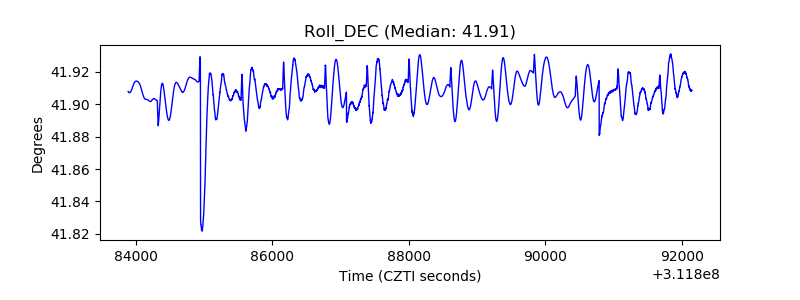 |
| _Roll_RA | 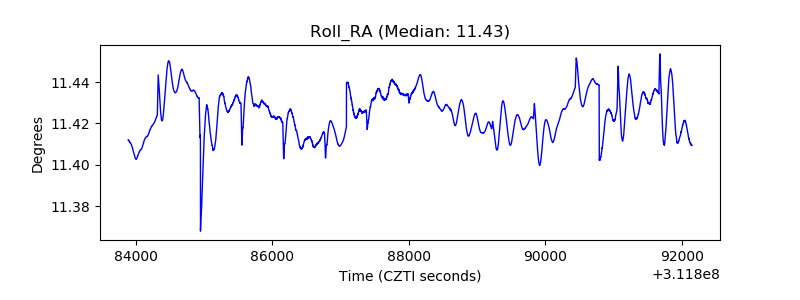 |
| Veto Counter | 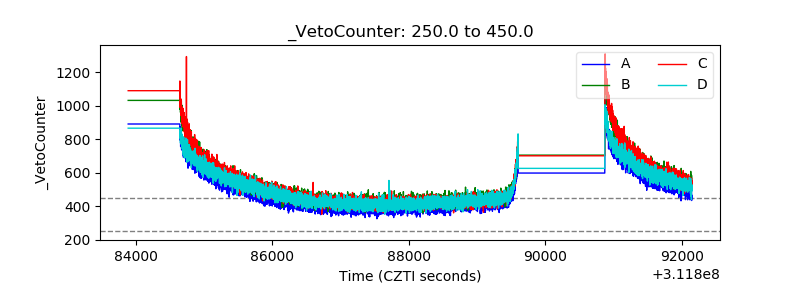 |