| Param | Original file | Final file |
|---|---|---|
| Filename | modeM0/AS1T03_156T01_9000003312_22406cztM0_level2.evt | modeM0/AS1T03_156T01_9000003312_22406cztM0_level2_quad_clean.evt |
| Size (bytes) | 447,554,880 | 101,416,320 |
| Size | 426.8 MB | 96.7 MB |
| Events in quadrant A | 3,131,161 | 670,840 |
| Events in quadrant B | 3,225,415 | 687,965 |
| Events in quadrant C | 3,259,783 | 654,842 |
| Events in quadrant D | 3,517,325 | 625,611 |
| Mode M9 | |||
|---|---|---|---|
| Quadrant | BADHDUFLAG | Total packets | Discarded packets |
| A | 0 | 17 | 0 |
| B | 0 | 18 | 0 |
| C | 0 | 18 | 0 |
| D | 0 | 18 | 0 |
| Mode SS | |||
|---|---|---|---|
| Quadrant | BADHDUFLAG | Total packets | Discarded packets |
| A | 0 | 126 | 0 |
| B | 0 | 126 | 0 |
| C | 0 | 126 | 0 |
| D | 0 | 126 | 0 |
| Mode M0 | |||
|---|---|---|---|
| Quadrant | BADHDUFLAG | Total packets | Discarded packets |
| A | 0 | 13192 | 2 |
| B | 0 | 13404 | 2 |
| C | 0 | 13523 | 2 |
| D | 0 | 14526 | 2 |
| Quadrant | Total seconds | Saturated seconds | Saturation percentage |
|---|---|---|---|
| A | 6192 | 36 | 0.581395% |
| B | 6192 | 48 | 0.775194% |
| C | 6192 | 92 | 1.485788% |
| D | 6191 | 53 | 0.856081% |
Noise dominated data is calculated using 1-second bins in cleaned event files. If a bin has >2000 counts, and if more than 50% of those come from <1% of pixels, then it is considered to be noise-dominated and hence unusable.
| Quadrant | # 1 sec bins | Bins with >0 counts | Bins with >2000 counts | High rate bins dominated by noise | Noise dominated (total time) | Noise dominated (detector-on time) | Marked lightcurve |
|---|---|---|---|---|---|---|---|
| A | 7552 | 6193 | 0 | 0 | 0.00% | 0.00% |  |
| B | 7552 | 6193 | 1 | 1 | 0.01% | 0.02% |  |
| C | 7552 | 6193 | 8 | 8 | 0.11% | 0.13% |  |
| D | 7551 | 6192 | 30 | 30 | 0.40% | 0.48% |  |
Top three noisy pixels from each quadrant. If the there are fewer than three noisy pixels in the level2.evt file, extra rows are filled as -1
| Pixel properties | Quadrant properties | ||||||
|---|---|---|---|---|---|---|---|
| Quadrant | DetID | PixID | Counts | Sigma | Mean | Median | Sigma |
| A | 3 | 1 | 10814 | 62.24 | 810 | 795 | 161.0 |
| A | 13 | 254 | 9190 | 52.15 | 810 | 795 | 161.0 |
| A | 0 | 226 | 7199 | 39.78 | 810 | 795 | 161.0 |
| B | 3 | 64 | 18886 | 121.22 | 815 | 797 | 149.2 |
| B | 12 | 111 | 17338 | 110.85 | 815 | 797 | 149.2 |
| B | 11 | 111 | 15224 | 96.68 | 815 | 797 | 149.2 |
| C | 14 | 238 | 124752 | 678.93 | 790 | 799 | 182.6 |
| C | 10 | 22 | 41964 | 225.47 | 790 | 799 | 182.6 |
| C | 0 | 10 | 12742 | 65.42 | 790 | 799 | 182.6 |
| D | 12 | 227 | 183313 | 967.85 | 787 | 765 | 188.6 |
| D | 7 | 223 | 181013 | 955.66 | 787 | 765 | 188.6 |
| D | 1 | 52 | 89186 | 468.8 | 787 | 765 | 188.6 |
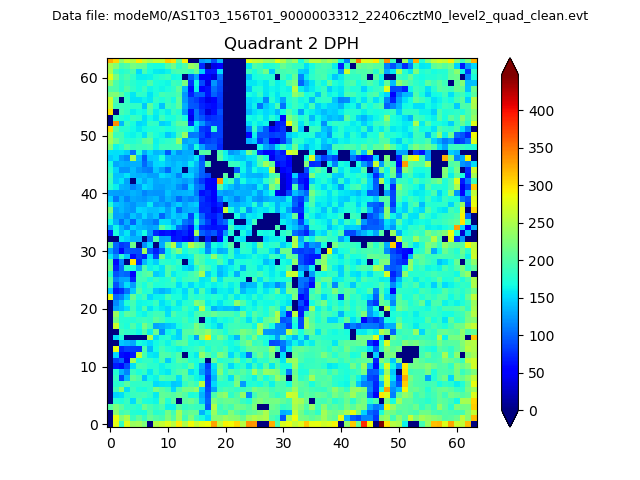
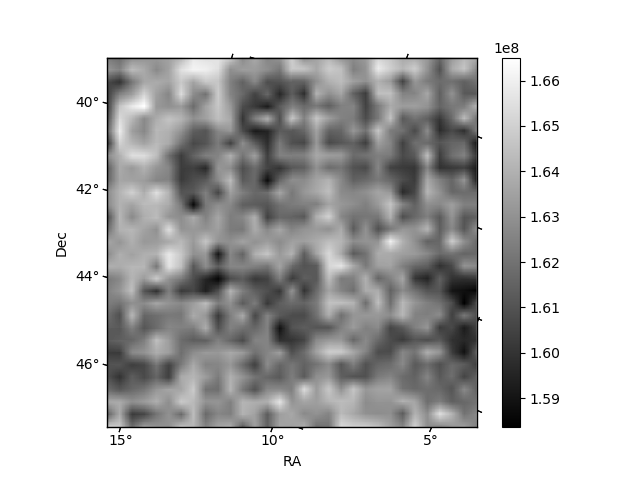
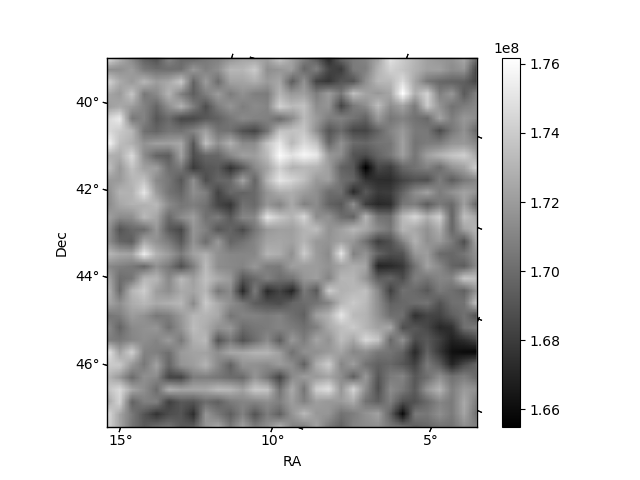
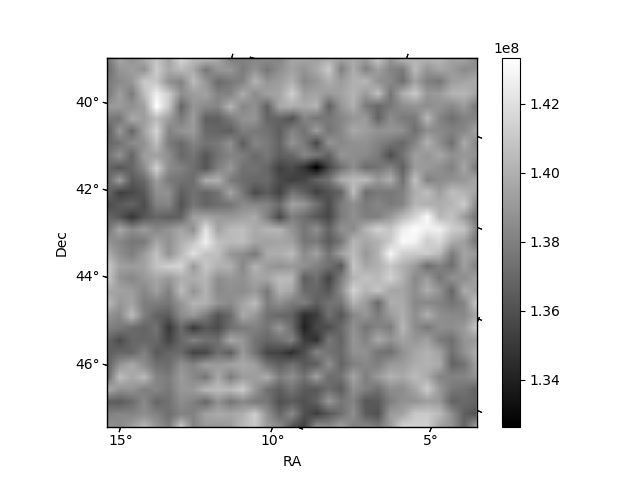
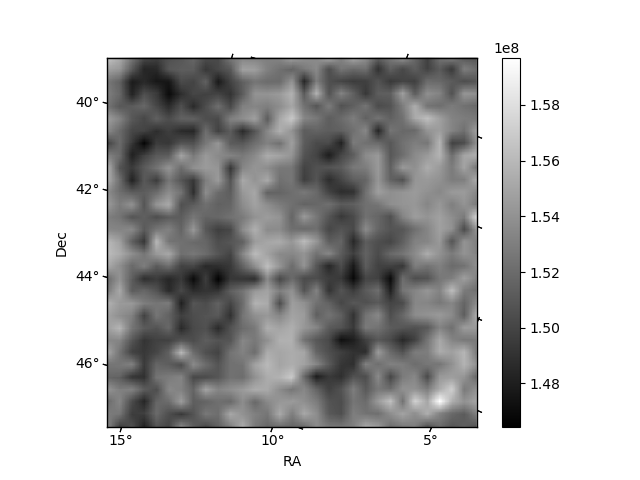
Histogram calculated using DETX and DETY for each event in the final _common_clean file
| Quadrant A | 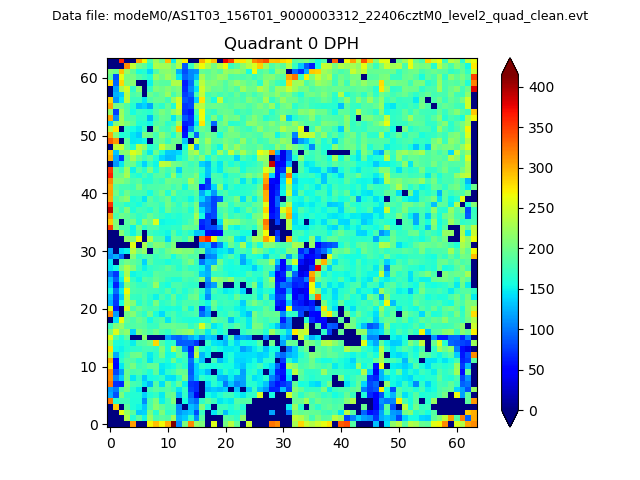 |
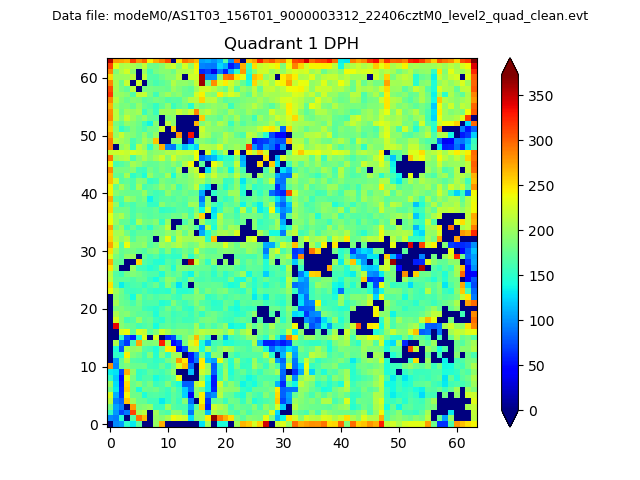 |
Quadrant B |
|---|---|---|---|
| Quadrant D | 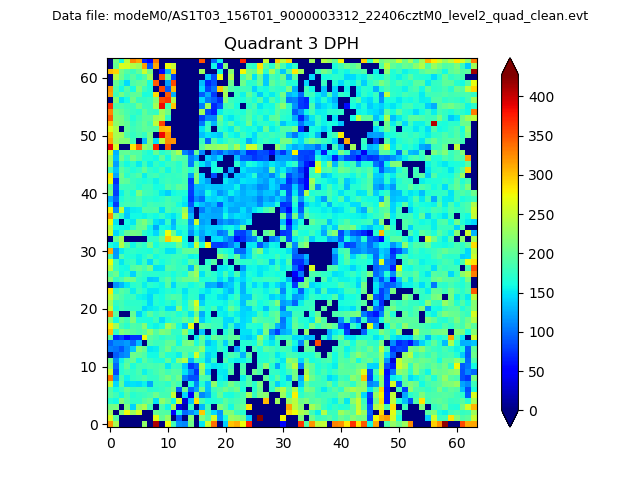 |
 |
Quadrant C |
| Plot type | Count rate plots | Images |
|---|---|---|
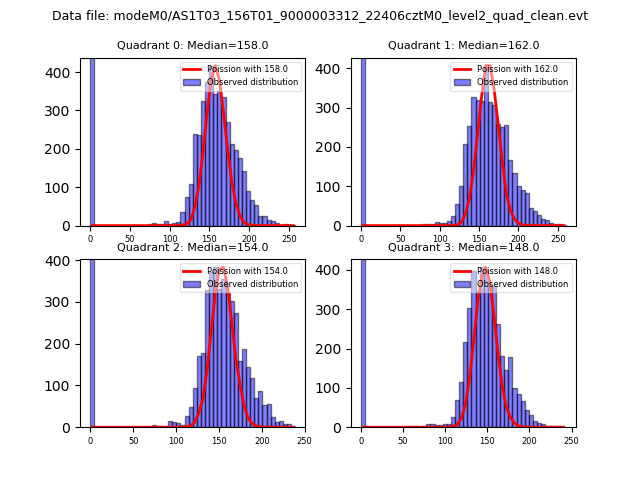
| Comparison with Poisson distribution Blue bars denote a histogram of data divided into 1 sec bins. Red curve is a Poisson curve with rate = median count rate of data. |
 |
 |
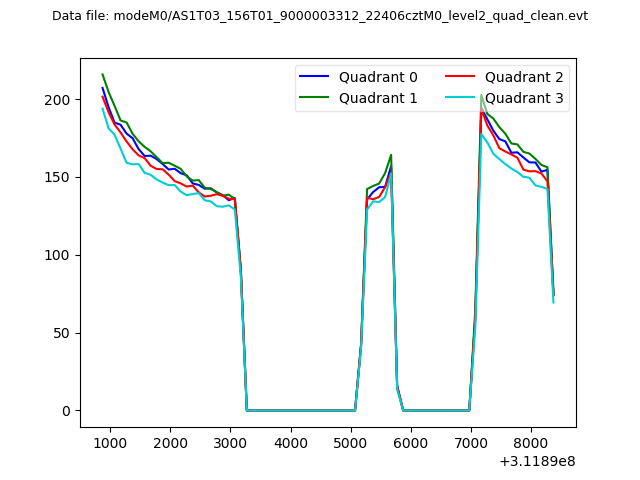
| Quadrant-wise count rates Data is divided into 100 sec bins |
 |
|
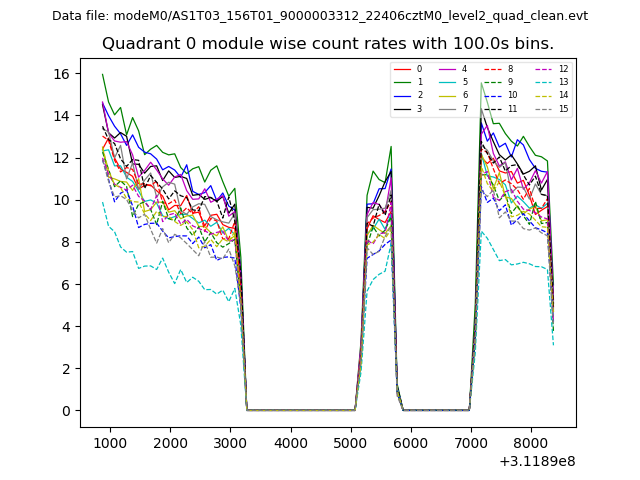
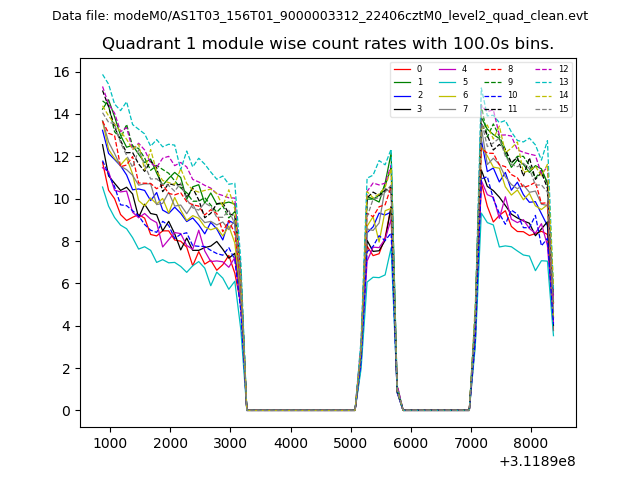
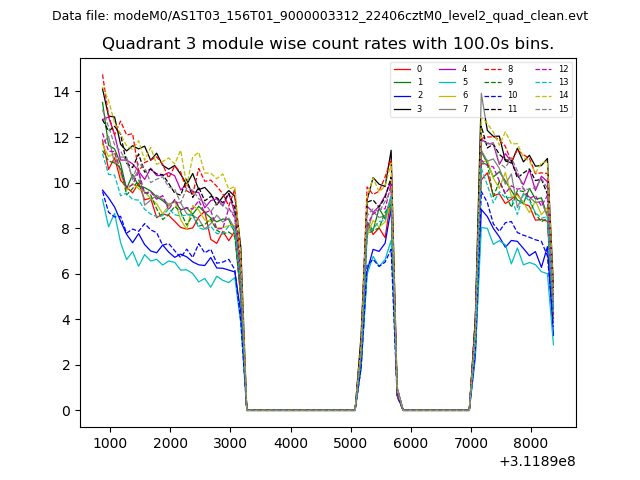
| Module-wise count rates for Quadrant A Data is divided into 100 sec bins |
 |
 |
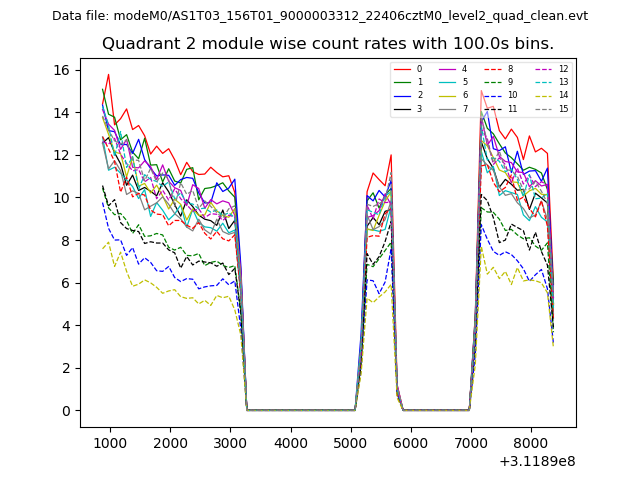
| Module-wise count rates for Quadrant B Data is divided into 100 sec bins |
 |
 |
| Module-wise count rates for Quadrant C Data is divided into 100 sec bins |
 |
 |
| Module-wise count rates for Quadrant D Data is divided into 100 sec bins |
 |
 |
| Parameter | Plot |
|---|---|
| CZT HV Monitor | 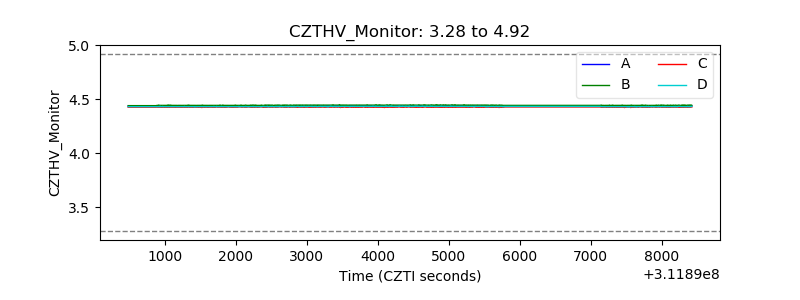 |
| D_VDD | 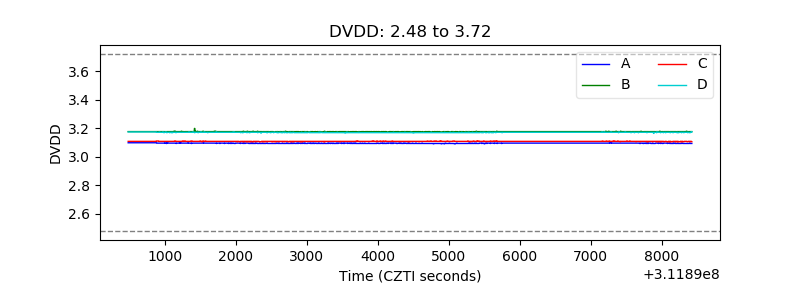 |
| Temperature 1 | 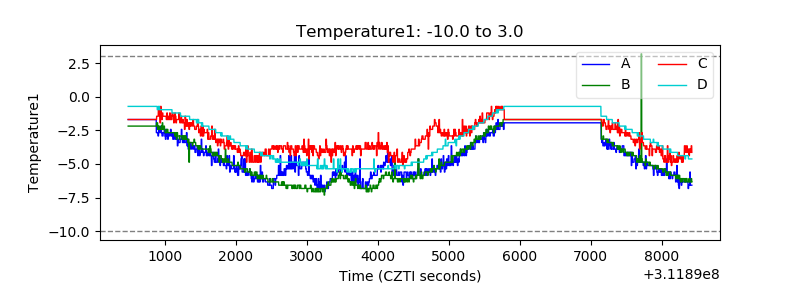 |
| Veto HV Monitor | 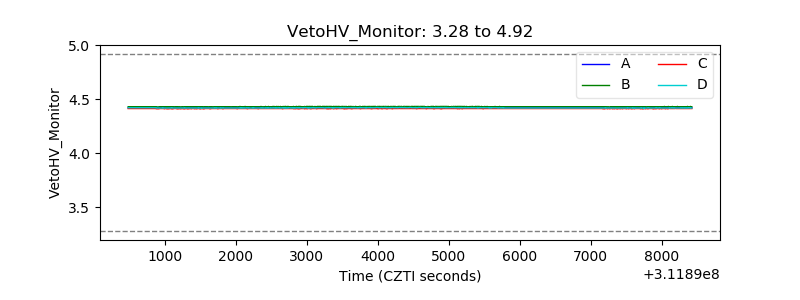 |
| Veto LLD |  |
| Alpha Counter | 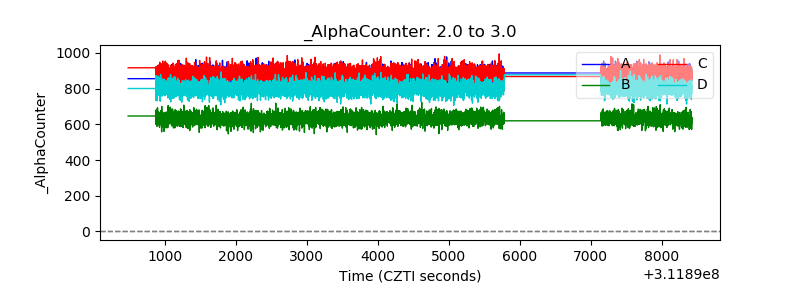 |
| _CPM_Rate | 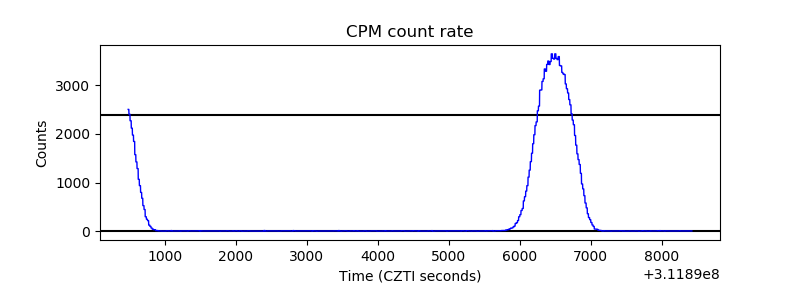 |
| CZT Counter | 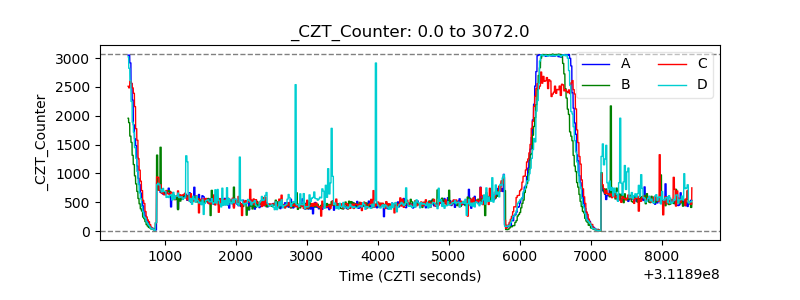 |
| +2.5 Volts monitor |  |
| +5 Volts monitor |  |
| _ROLL_ROT | 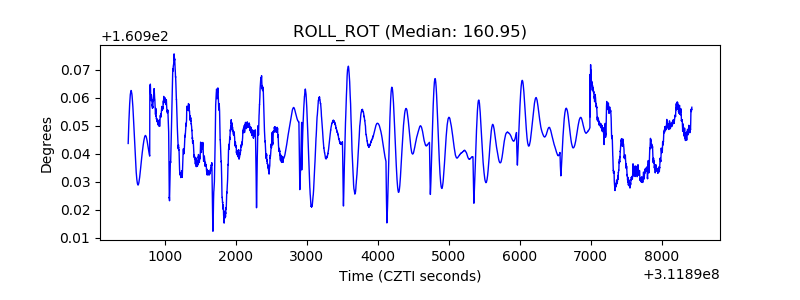 |
| _Roll_DEC | 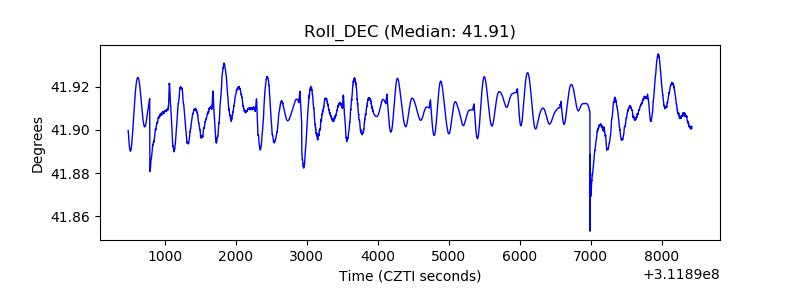 |
| _Roll_RA | 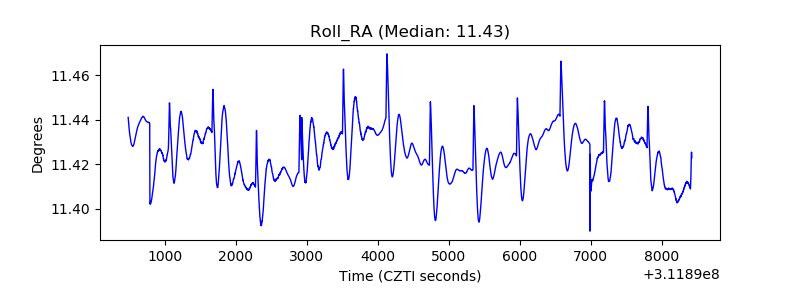 |
| Veto Counter | 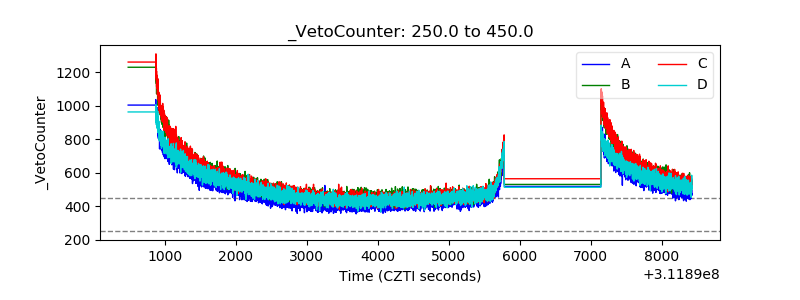 |