| Param | Original file | Final file |
|---|---|---|
| Filename | modeM0/AS1T03_156T01_9000003312_22407cztM0_level2.evt | modeM0/AS1T03_156T01_9000003312_22407cztM0_level2_quad_clean.evt |
| Size (bytes) | 430,416,000 | 96,341,760 |
| Size | 410.5 MB | 91.9 MB |
| Events in quadrant A | 3,021,301 | 632,876 |
| Events in quadrant B | 3,150,663 | 653,691 |
| Events in quadrant C | 3,159,227 | 618,336 |
| Events in quadrant D | 3,292,082 | 589,588 |
| Mode M9 | |||
|---|---|---|---|
| Quadrant | BADHDUFLAG | Total packets | Discarded packets |
| A | 0 | 24 | 0 |
| B | 0 | 25 | 0 |
| C | 0 | 25 | 0 |
| D | 0 | 25 | 0 |
| Mode SS | |||
|---|---|---|---|
| Quadrant | BADHDUFLAG | Total packets | Discarded packets |
| A | 0 | 124 | 0 |
| B | 0 | 124 | 0 |
| C | 0 | 124 | 0 |
| D | 0 | 124 | 0 |
| Mode M0 | |||
|---|---|---|---|
| Quadrant | BADHDUFLAG | Total packets | Discarded packets |
| A | 0 | 12736 | 2 |
| B | 0 | 13030 | 2 |
| C | 0 | 13051 | 2 |
| D | 0 | 13789 | 2 |
| Quadrant | Total seconds | Saturated seconds | Saturation percentage |
|---|---|---|---|
| A | 6057 | 31 | 0.511805% |
| B | 6057 | 64 | 1.056629% |
| C | 6057 | 98 | 1.617963% |
| D | 6056 | 28 | 0.462351% |
Noise dominated data is calculated using 1-second bins in cleaned event files. If a bin has >2000 counts, and if more than 50% of those come from <1% of pixels, then it is considered to be noise-dominated and hence unusable.
| Quadrant | # 1 sec bins | Bins with >0 counts | Bins with >2000 counts | High rate bins dominated by noise | Noise dominated (total time) | Noise dominated (detector-on time) | Marked lightcurve |
|---|---|---|---|---|---|---|---|
| A | 7412 | 6058 | 0 | 0 | 0.00% | 0.00% | 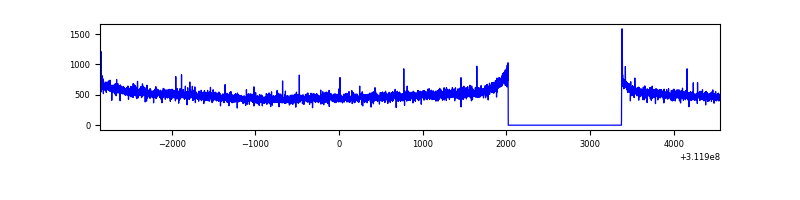 |
| B | 7412 | 6058 | 5 | 5 | 0.07% | 0.08% | 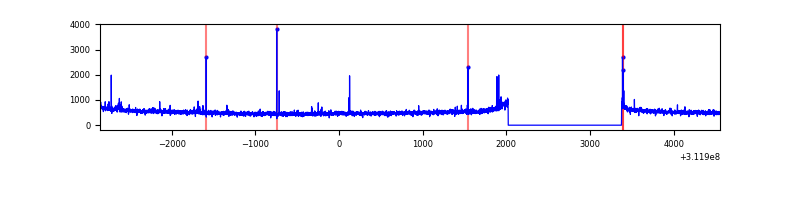 |
| C | 7412 | 6058 | 8 | 8 | 0.11% | 0.13% |  |
| D | 7411 | 6057 | 5 | 5 | 0.07% | 0.08% |  |
Top three noisy pixels from each quadrant. If the there are fewer than three noisy pixels in the level2.evt file, extra rows are filled as -1
| Pixel properties | Quadrant properties | ||||||
|---|---|---|---|---|---|---|---|
| Quadrant | DetID | PixID | Counts | Sigma | Mean | Median | Sigma |
| A | 13 | 254 | 9787 | 58.51 | 782 | 767 | 154.1 |
| A | 0 | 226 | 6712 | 38.56 | 782 | 767 | 154.1 |
| A | 3 | 1 | 6322 | 36.03 | 782 | 767 | 154.1 |
| B | 3 | 64 | 31212 | 207.49 | 791 | 773 | 146.7 |
| B | 12 | 111 | 16870 | 109.73 | 791 | 773 | 146.7 |
| B | 0 | 190 | 15906 | 103.16 | 791 | 773 | 146.7 |
| C | 14 | 238 | 122982 | 692.95 | 763 | 770 | 176.4 |
| C | 10 | 22 | 46366 | 258.53 | 763 | 770 | 176.4 |
| C | 0 | 10 | 10159 | 53.24 | 763 | 770 | 176.4 |
| D | 12 | 227 | 185656 | 1015.43 | 759 | 739 | 182.1 |
| D | 1 | 52 | 143917 | 786.23 | 759 | 739 | 182.1 |
| D | 13 | 104 | 29328 | 156.99 | 759 | 739 | 182.1 |
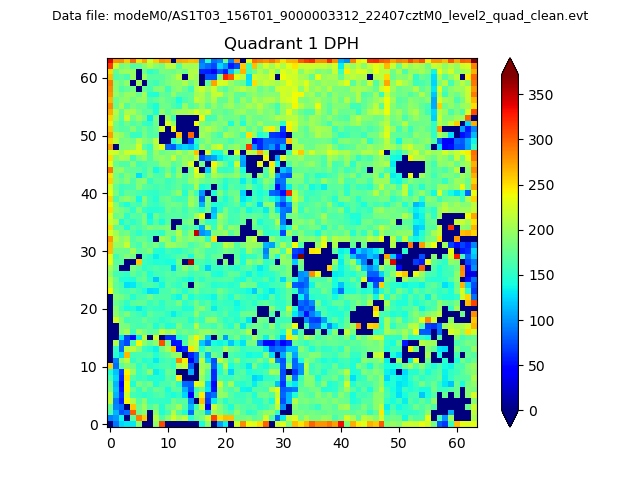
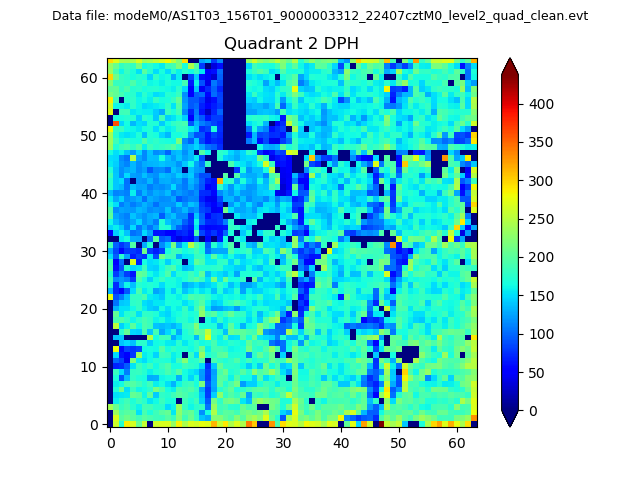
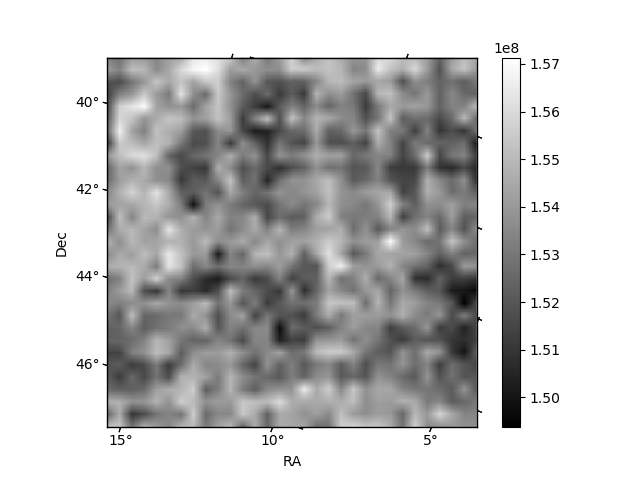
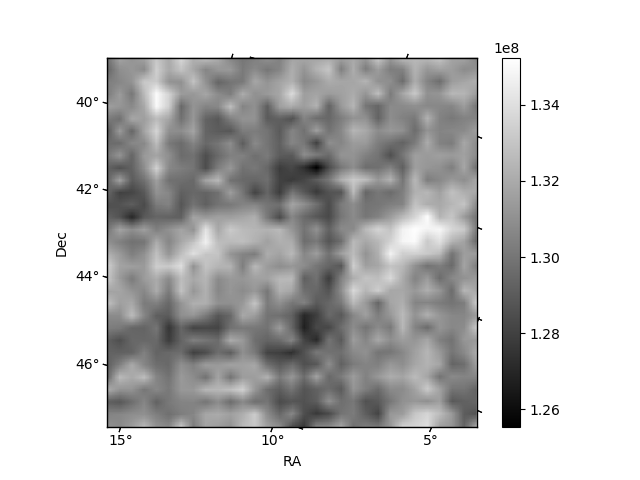
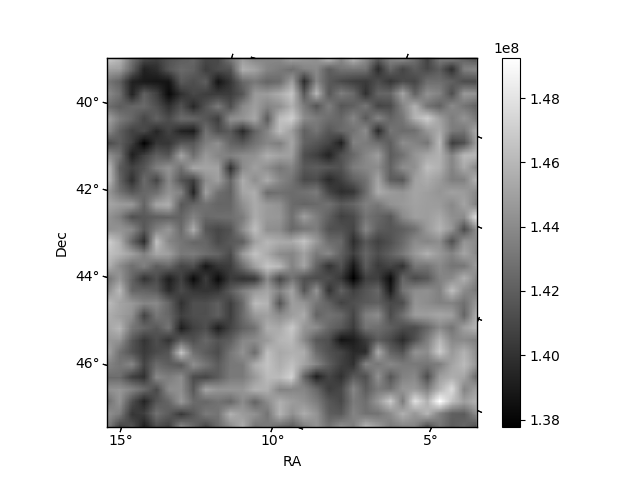
Histogram calculated using DETX and DETY for each event in the final _common_clean file
| Quadrant A | 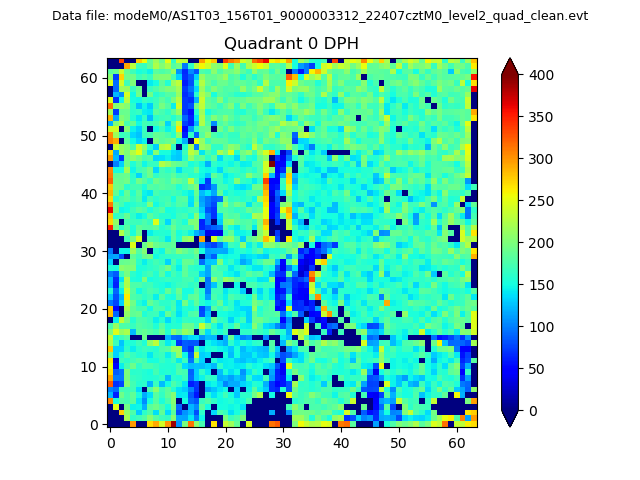 |
 |
Quadrant B |
|---|---|---|---|
| Quadrant D | 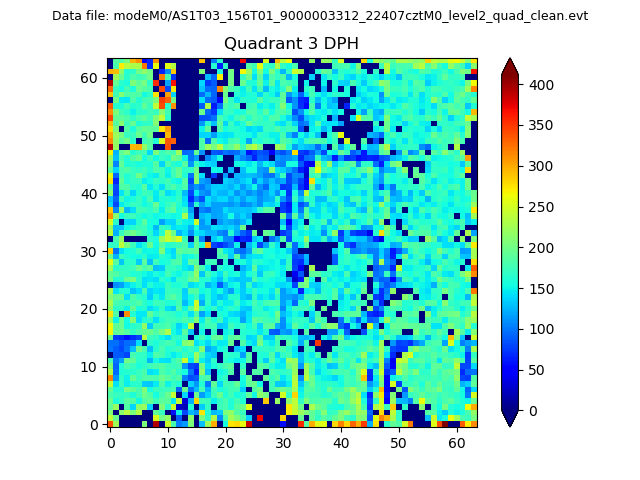 |
 |
Quadrant C |
| Plot type | Count rate plots | Images |
|---|---|---|
| Comparison with Poisson distribution Blue bars denote a histogram of data divided into 1 sec bins. Red curve is a Poisson curve with rate = median count rate of data. |
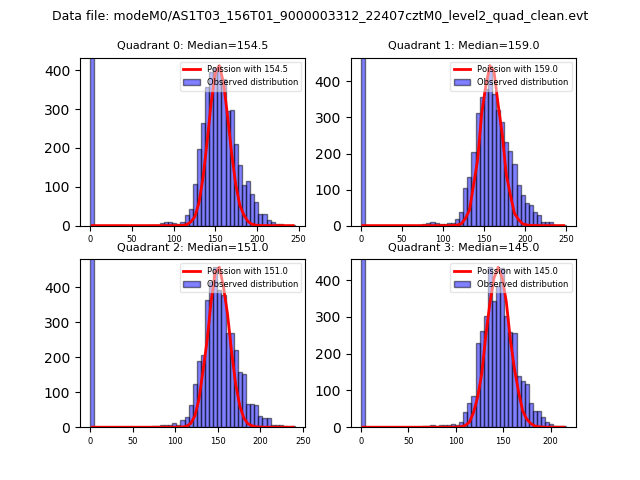 |
 |
| Quadrant-wise count rates Data is divided into 100 sec bins |
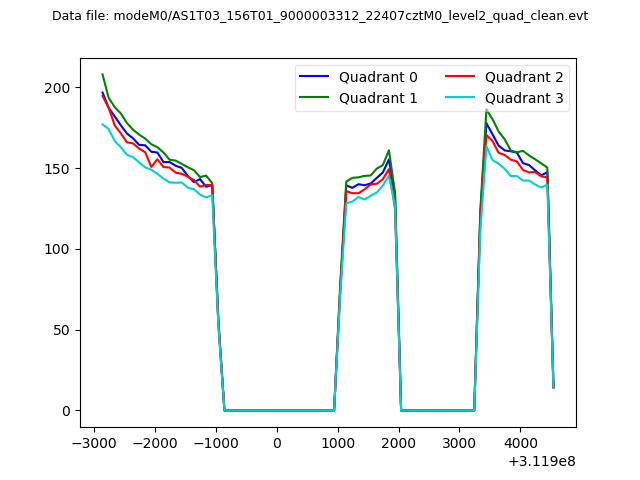 |
|
| Module-wise count rates for Quadrant A Data is divided into 100 sec bins |
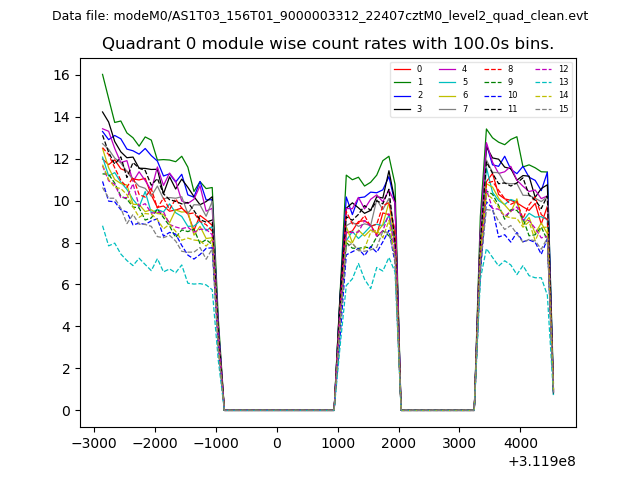 |
 |
| Module-wise count rates for Quadrant B Data is divided into 100 sec bins |
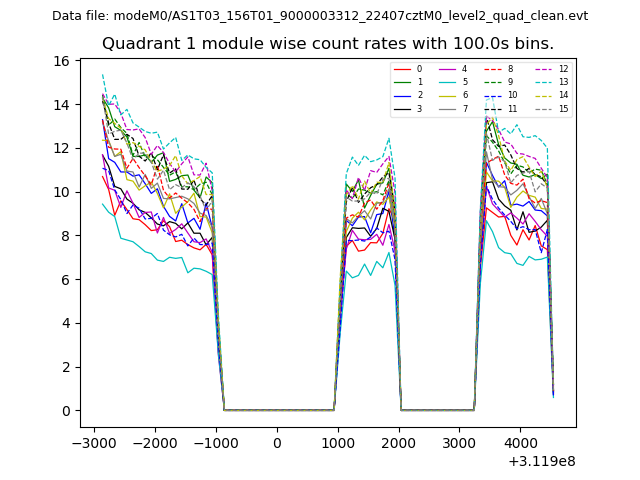 |
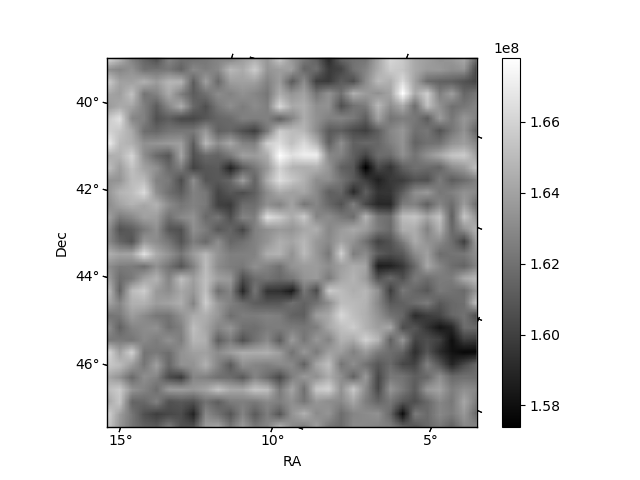 |
| Module-wise count rates for Quadrant C Data is divided into 100 sec bins |
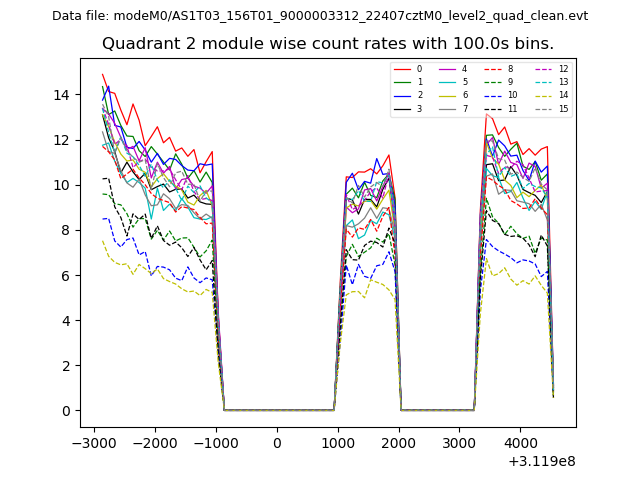 |
 |
| Module-wise count rates for Quadrant D Data is divided into 100 sec bins |
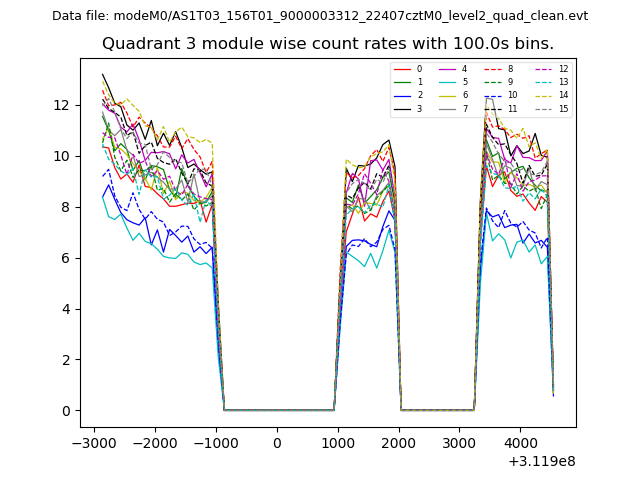 |
 |
| Parameter | Plot |
|---|---|
| CZT HV Monitor | 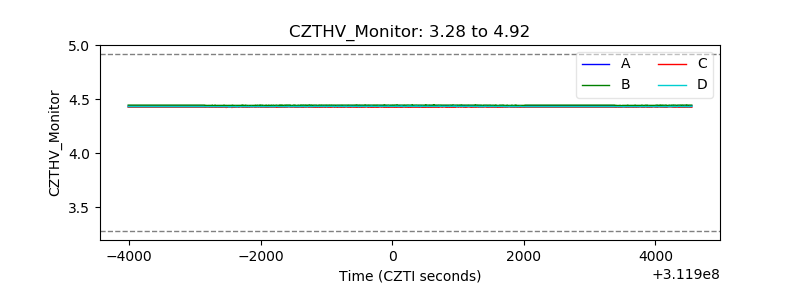 |
| D_VDD | 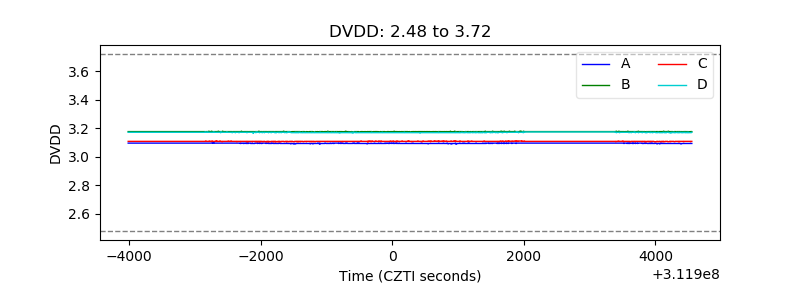 |
| Temperature 1 | 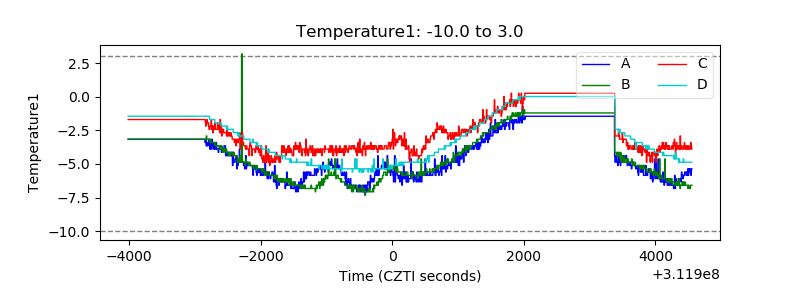 |
| Veto HV Monitor | 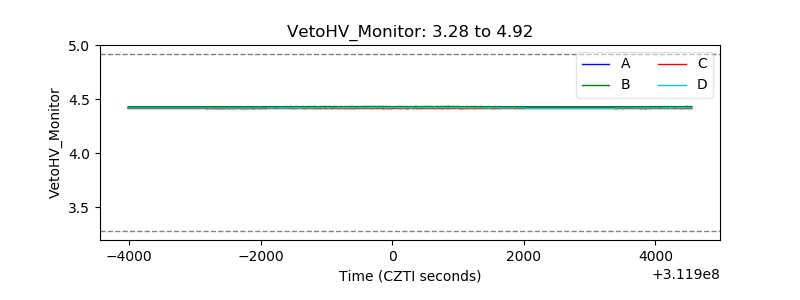 |
| Veto LLD | 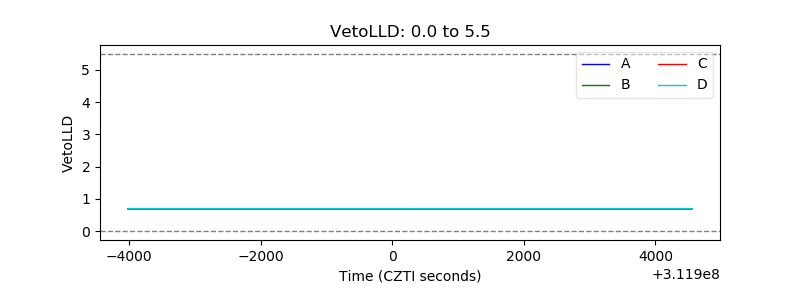 |
| Alpha Counter | 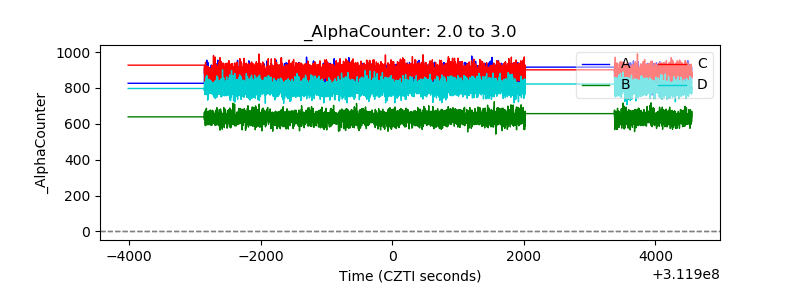 |
| _CPM_Rate | 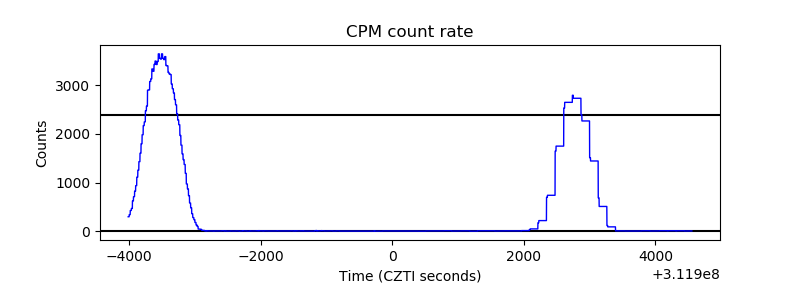 |
| CZT Counter | 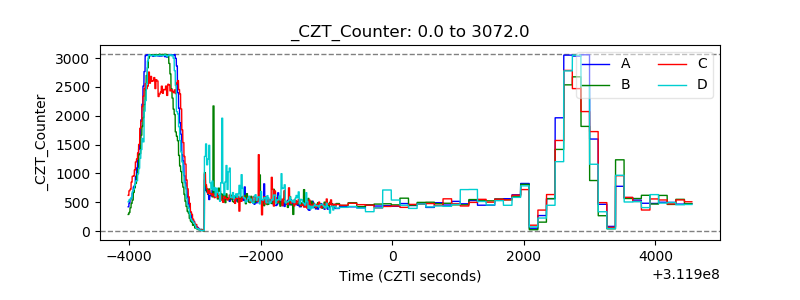 |
| +2.5 Volts monitor |  |
| +5 Volts monitor | 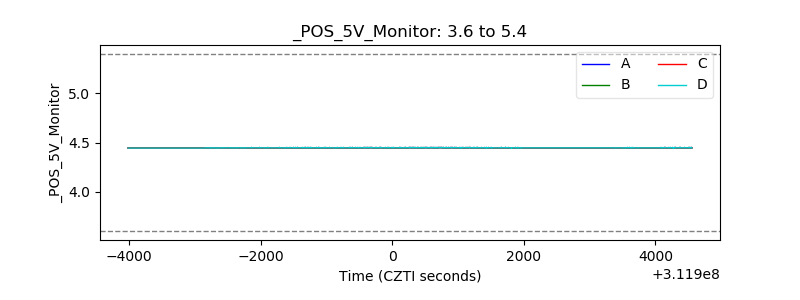 |
| _ROLL_ROT | 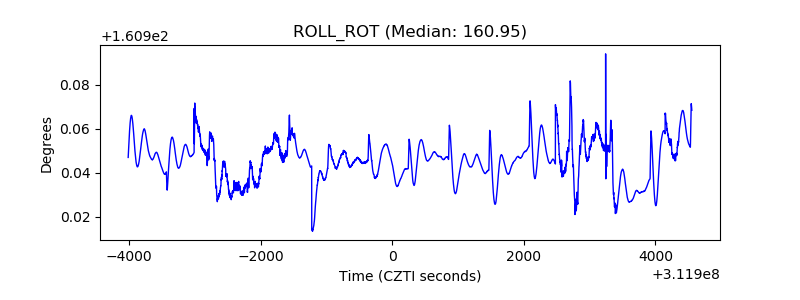 |
| _Roll_DEC | 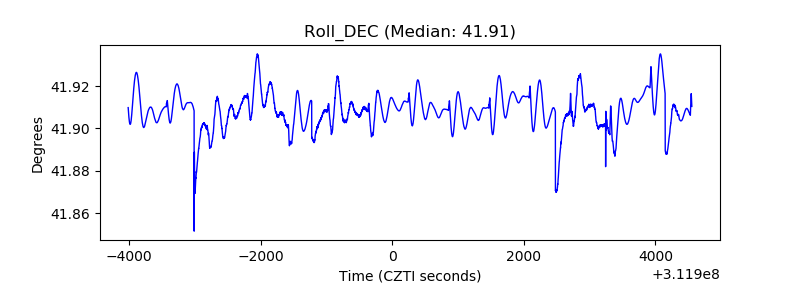 |
| _Roll_RA | 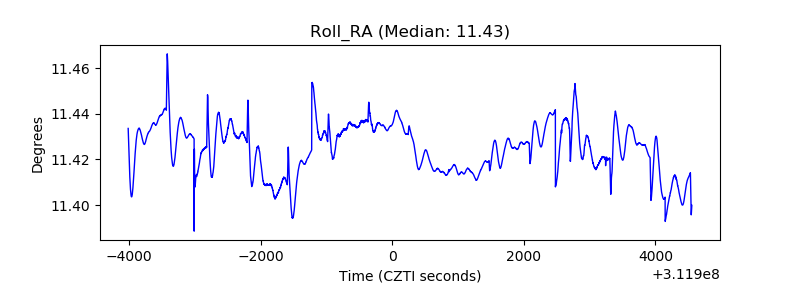 |
| Veto Counter | 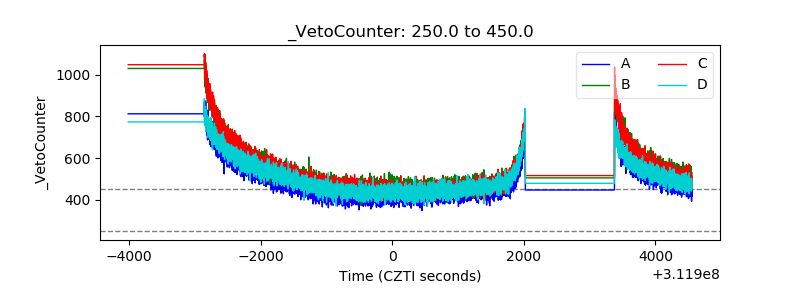 |