| Param | Original file | Final file |
|---|---|---|
| Filename | modeM0/AS1T03_156T01_9000003312_22408cztM0_level2.evt | modeM0/AS1T03_156T01_9000003312_22408cztM0_level2_quad_clean.evt |
| Size (bytes) | 424,771,200 | 92,779,200 |
| Size | 405.1 MB | 88.5 MB |
| Events in quadrant A | 3,032,818 | 600,298 |
| Events in quadrant B | 3,164,999 | 620,091 |
| Events in quadrant C | 3,114,993 | 585,673 |
| Events in quadrant D | 3,125,001 | 566,015 |
| Mode M9 | |||
|---|---|---|---|
| Quadrant | BADHDUFLAG | Total packets | Discarded packets |
| A | 0 | 24 | 0 |
| B | 0 | 25 | 0 |
| C | 0 | 25 | 0 |
| D | 0 | 25 | 0 |
| Mode SS | |||
|---|---|---|---|
| Quadrant | BADHDUFLAG | Total packets | Discarded packets |
| A | 0 | 128 | 0 |
| B | 0 | 128 | 0 |
| C | 0 | 128 | 0 |
| D | 0 | 128 | 0 |
| Mode M0 | |||
|---|---|---|---|
| Quadrant | BADHDUFLAG | Total packets | Discarded packets |
| A | 0 | 12969 | 2 |
| B | 0 | 13275 | 2 |
| C | 0 | 13116 | 2 |
| D | 0 | 13443 | 2 |
| Quadrant | Total seconds | Saturated seconds | Saturation percentage |
|---|---|---|---|
| A | 6268 | 17 | 0.271219% |
| B | 6268 | 38 | 0.606254% |
| C | 6268 | 56 | 0.893427% |
| D | 6268 | 18 | 0.287173% |
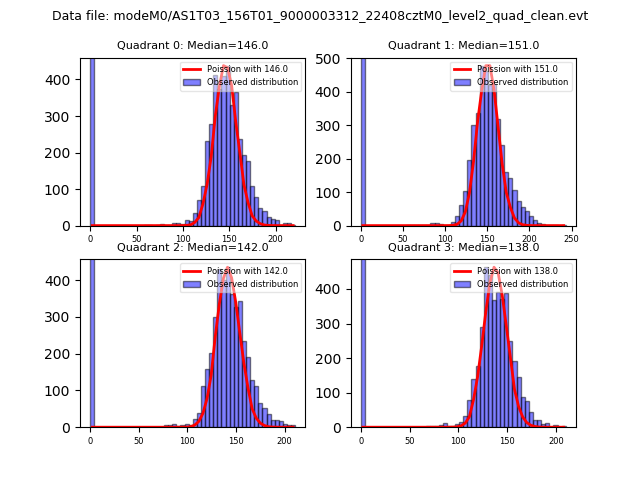
Noise dominated data is calculated using 1-second bins in cleaned event files. If a bin has >2000 counts, and if more than 50% of those come from <1% of pixels, then it is considered to be noise-dominated and hence unusable.
| Quadrant | # 1 sec bins | Bins with >0 counts | Bins with >2000 counts | High rate bins dominated by noise | Noise dominated (total time) | Noise dominated (detector-on time) | Marked lightcurve |
|---|---|---|---|---|---|---|---|
| A | 7588 | 6269 | 0 | 0 | 0.00% | 0.00% | 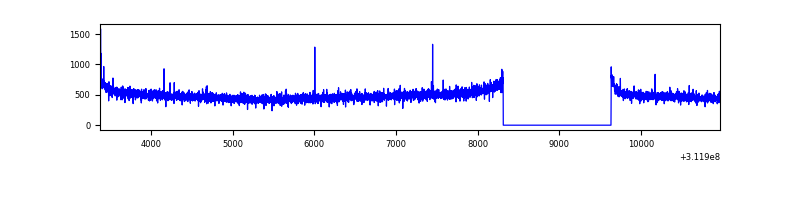 |
| B | 7588 | 6269 | 3 | 3 | 0.04% | 0.05% | 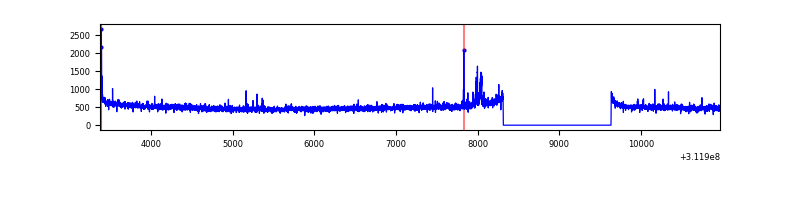 |
| C | 7588 | 6269 | 0 | 0 | 0.00% | 0.00% | 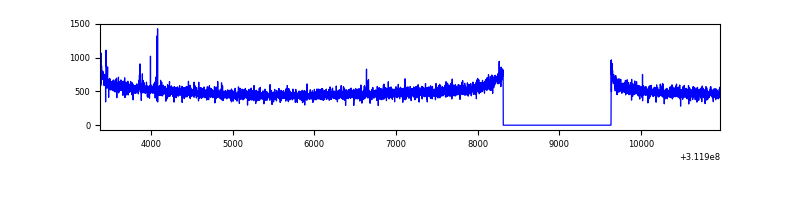 |
| D | 7588 | 6269 | 7 | 7 | 0.09% | 0.11% | 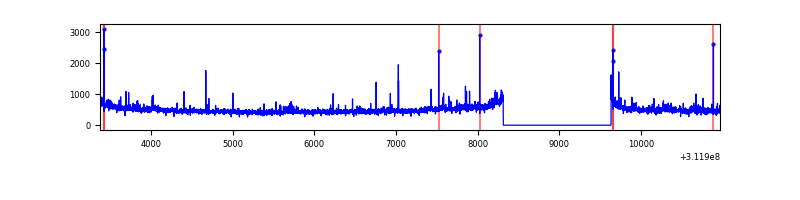 |
Top three noisy pixels from each quadrant. If the there are fewer than three noisy pixels in the level2.evt file, extra rows are filled as -1
| Pixel properties | Quadrant properties | ||||||
|---|---|---|---|---|---|---|---|
| Quadrant | DetID | PixID | Counts | Sigma | Mean | Median | Sigma |
| A | 13 | 254 | 9992 | 58.81 | 784 | 768 | 156.8 |
| A | 3 | 1 | 9816 | 57.69 | 784 | 768 | 156.8 |
| A | 0 | 226 | 6733 | 38.03 | 784 | 768 | 156.8 |
| B | 0 | 190 | 38092 | 254.01 | 792 | 773 | 146.9 |
| B | 3 | 64 | 24339 | 160.4 | 792 | 773 | 146.9 |
| B | 12 | 111 | 17406 | 113.21 | 792 | 773 | 146.9 |
| C | 14 | 238 | 121137 | 685.09 | 762 | 768 | 175.7 |
| C | 10 | 22 | 12508 | 66.82 | 762 | 768 | 175.7 |
| C | 0 | 10 | 5458 | 26.69 | 762 | 768 | 175.7 |
| D | 1 | 52 | 92997 | 507.62 | 759 | 739 | 181.7 |
| D | 12 | 227 | 65628 | 357.03 | 759 | 739 | 181.7 |
| D | 7 | 223 | 33687 | 181.29 | 759 | 739 | 181.7 |
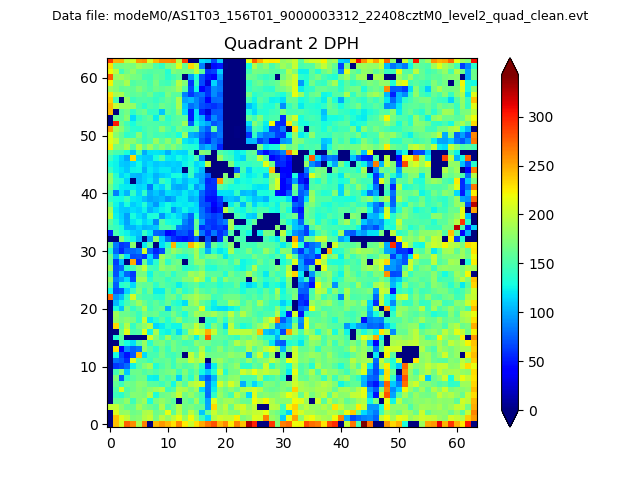
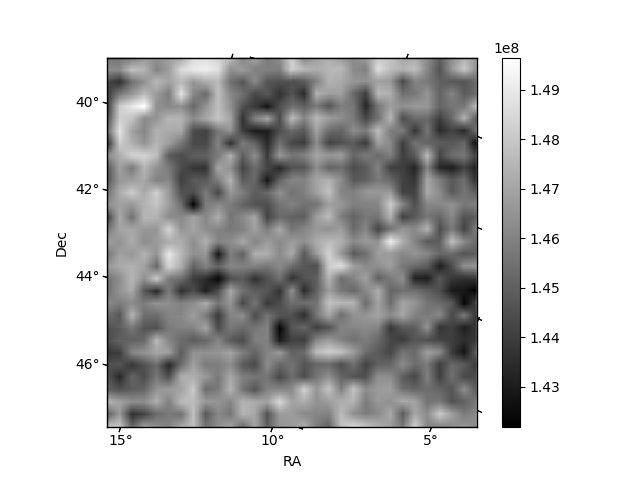
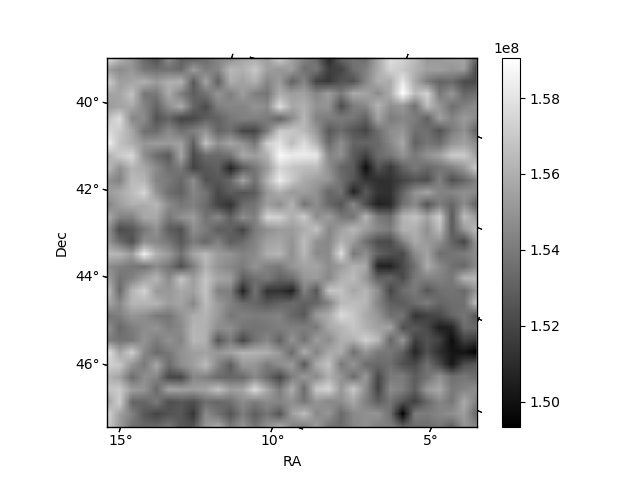
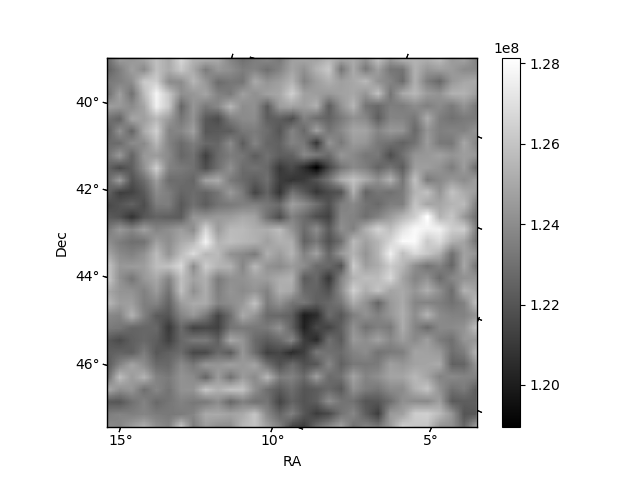
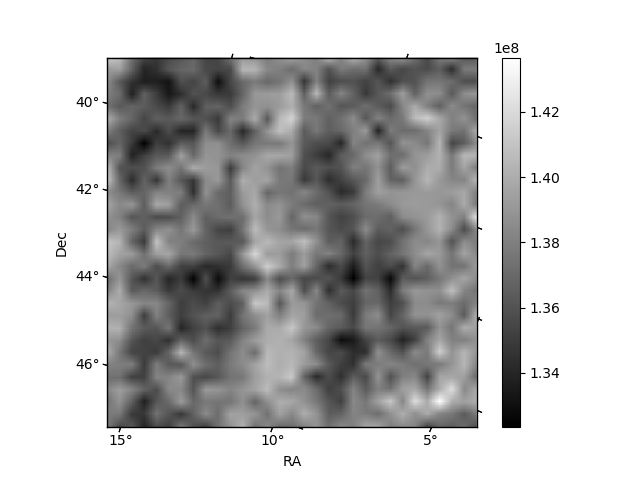
Histogram calculated using DETX and DETY for each event in the final _common_clean file
| Quadrant A | 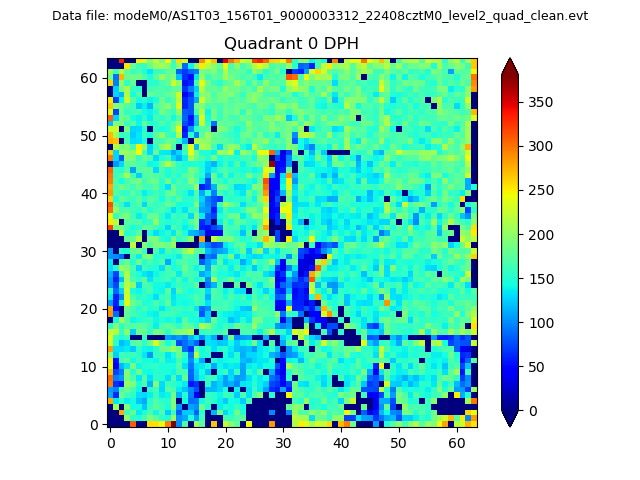 |
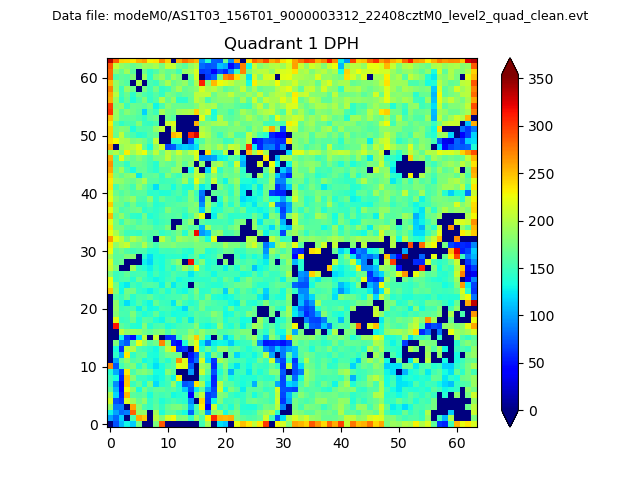 |
Quadrant B |
|---|---|---|---|
| Quadrant D | 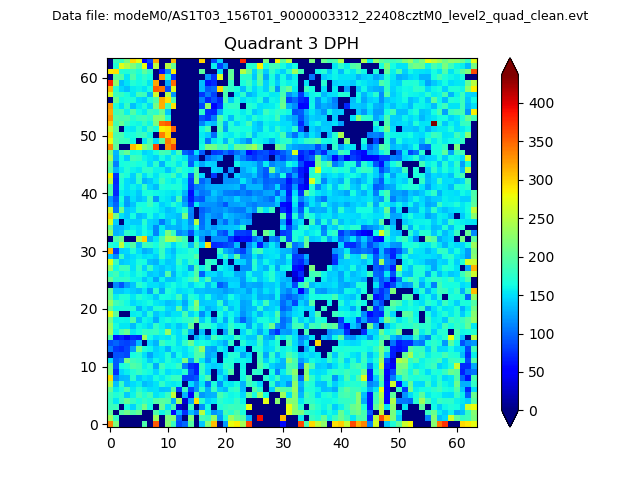 |
 |
Quadrant C |
| Plot type | Count rate plots | Images |
|---|---|---|
| Comparison with Poisson distribution Blue bars denote a histogram of data divided into 1 sec bins. Red curve is a Poisson curve with rate = median count rate of data. |
 |
 |
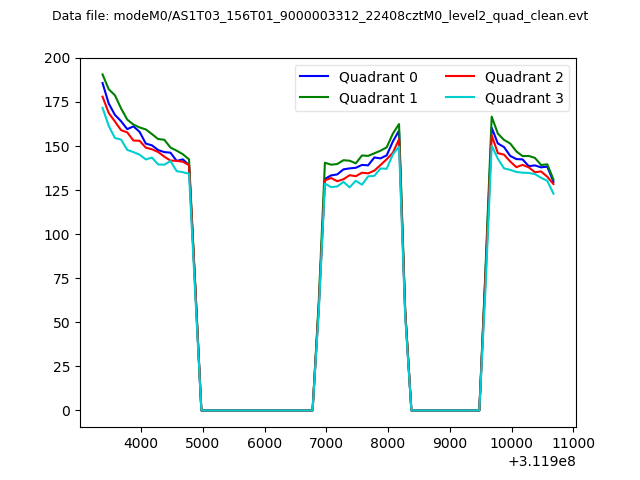
| Quadrant-wise count rates Data is divided into 100 sec bins |
 |
|
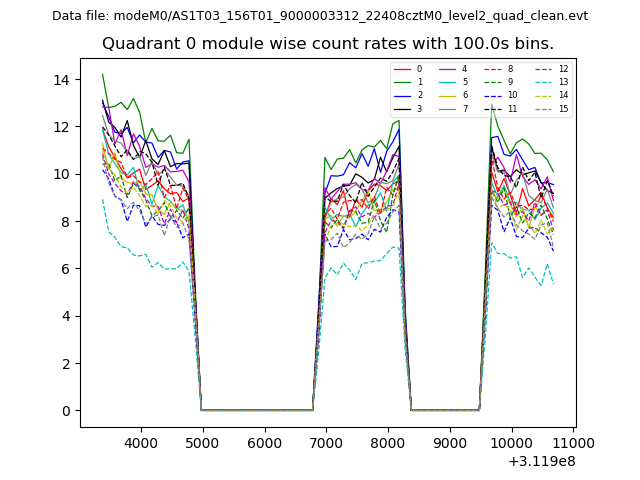
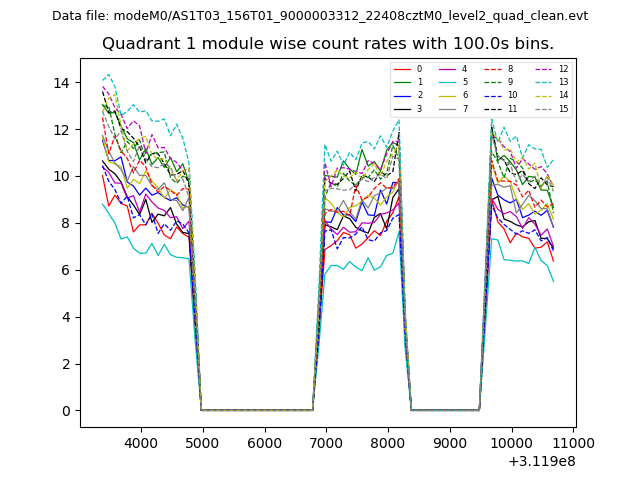
| Module-wise count rates for Quadrant A Data is divided into 100 sec bins |
 |
 |
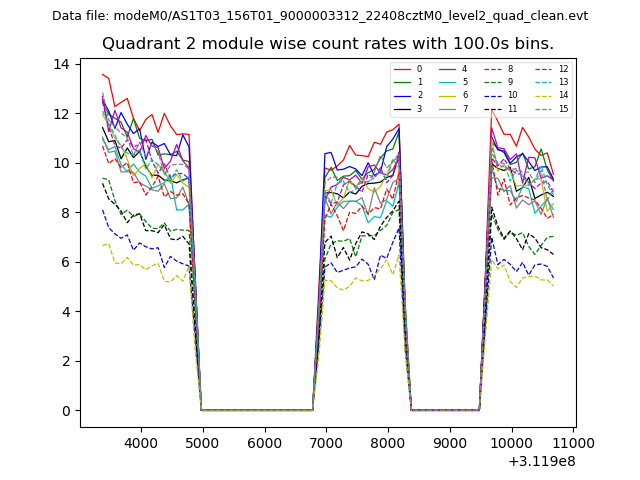
| Module-wise count rates for Quadrant B Data is divided into 100 sec bins |
 |
 |
| Module-wise count rates for Quadrant C Data is divided into 100 sec bins |
 |
 |
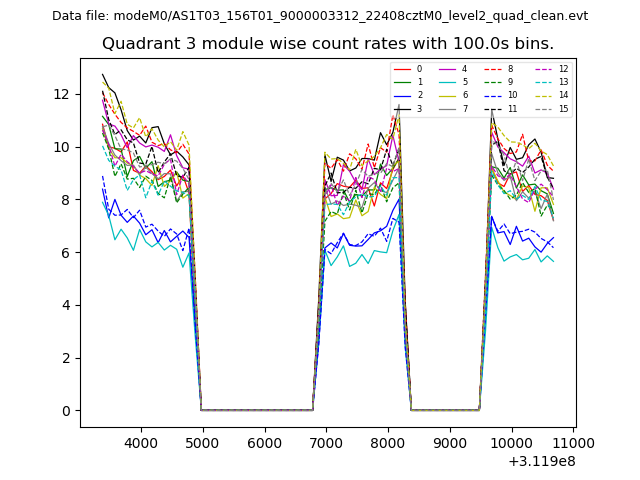
| Module-wise count rates for Quadrant D Data is divided into 100 sec bins |
 |
 |
| Parameter | Plot |
|---|---|
| CZT HV Monitor | 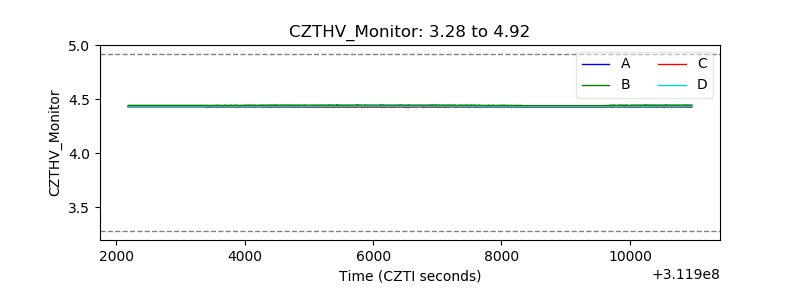 |
| D_VDD | 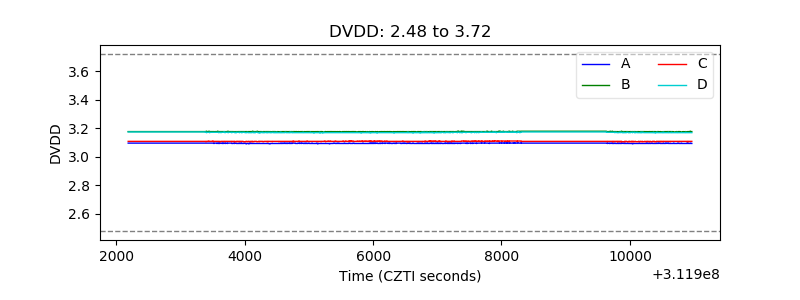 |
| Temperature 1 | 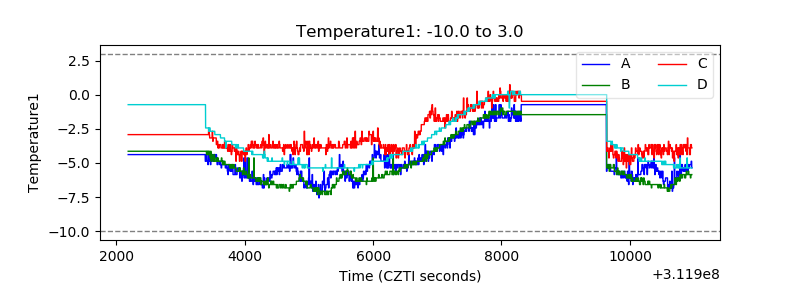 |
| Veto HV Monitor | 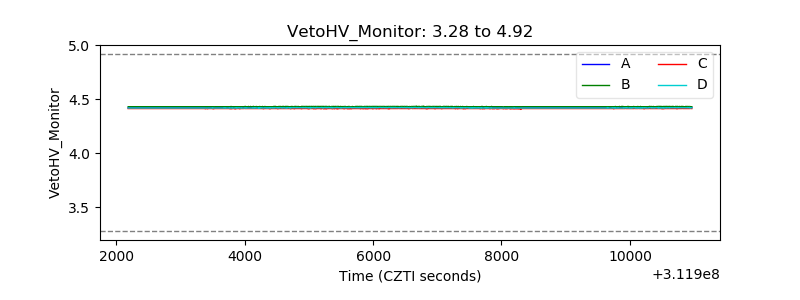 |
| Veto LLD | 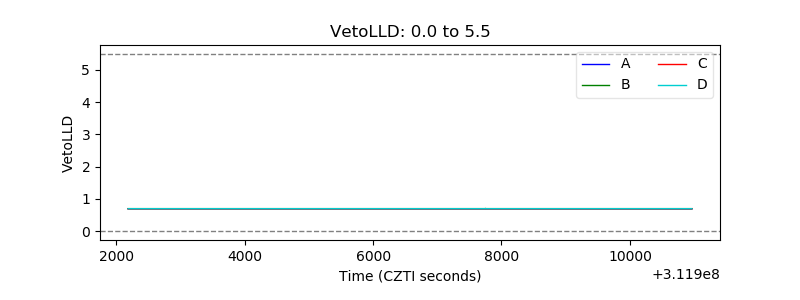 |
| Alpha Counter | 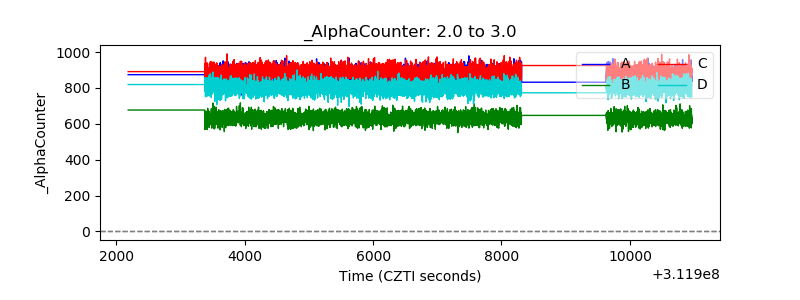 |
| _CPM_Rate | 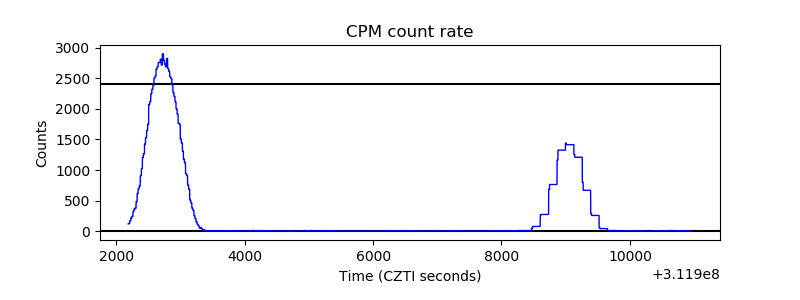 |
| CZT Counter | 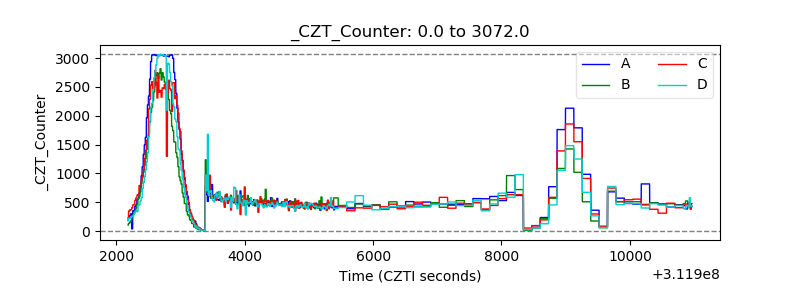 |
| +2.5 Volts monitor |  |
| +5 Volts monitor |  |
| _ROLL_ROT | 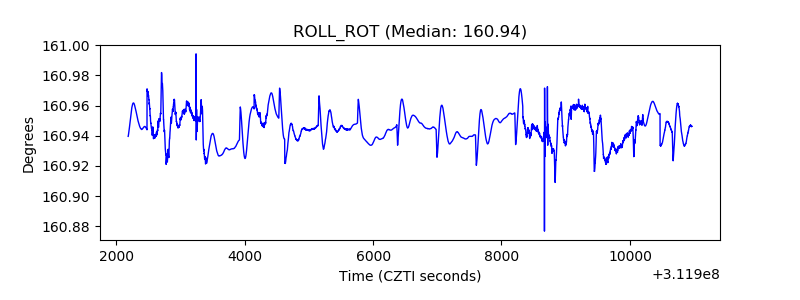 |
| _Roll_DEC |  |
| _Roll_RA | 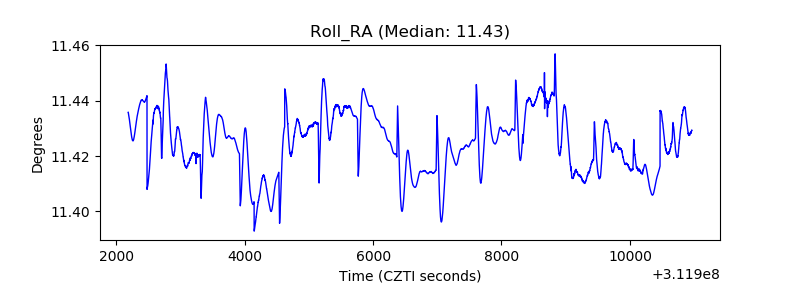 |
| Veto Counter | 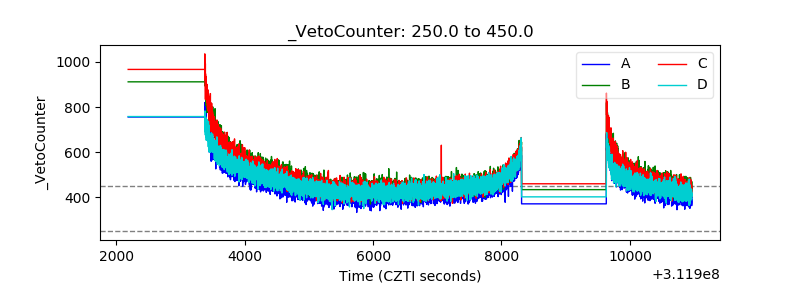 |