| Param | Original file | Final file |
|---|---|---|
| Filename | modeM0/AS1T03_156T01_9000003312_22409cztM0_level2.evt | modeM0/AS1T03_156T01_9000003312_22409cztM0_level2_quad_clean.evt |
| Size (bytes) | 442,601,280 | 86,178,240 |
| Size | 422.1 MB | 82.2 MB |
| Events in quadrant A | 3,096,539 | 546,702 |
| Events in quadrant B | 3,244,038 | 557,421 |
| Events in quadrant C | 3,170,866 | 530,768 |
| Events in quadrant D | 3,443,383 | 513,886 |
| Mode M9 | |||
|---|---|---|---|
| Quadrant | BADHDUFLAG | Total packets | Discarded packets |
| A | 0 | 18 | 0 |
| B | 0 | 19 | 0 |
| C | 0 | 19 | 0 |
| D | 0 | 19 | 0 |
| Mode SS | |||
|---|---|---|---|
| Quadrant | BADHDUFLAG | Total packets | Discarded packets |
| A | 0 | 134 | 0 |
| B | 0 | 134 | 0 |
| C | 0 | 134 | 0 |
| D | 0 | 134 | 0 |
| Mode M0 | |||
|---|---|---|---|
| Quadrant | BADHDUFLAG | Total packets | Discarded packets |
| A | 0 | 13502 | 2 |
| B | 0 | 13767 | 2 |
| C | 0 | 13593 | 2 |
| D | 0 | 14673 | 2 |
| Quadrant | Total seconds | Saturated seconds | Saturation percentage |
|---|---|---|---|
| A | 6610 | 31 | 0.468986% |
| B | 6610 | 48 | 0.726172% |
| C | 6610 | 65 | 0.983359% |
| D | 6610 | 43 | 0.650530% |
Noise dominated data is calculated using 1-second bins in cleaned event files. If a bin has >2000 counts, and if more than 50% of those come from <1% of pixels, then it is considered to be noise-dominated and hence unusable.
| Quadrant | # 1 sec bins | Bins with >0 counts | Bins with >2000 counts | High rate bins dominated by noise | Noise dominated (total time) | Noise dominated (detector-on time) | Marked lightcurve |
|---|---|---|---|---|---|---|---|
| A | 7650 | 6612 | 0 | 0 | 0.00% | 0.00% |  |
| B | 7650 | 6612 | 3 | 3 | 0.04% | 0.05% |  |
| C | 7650 | 6612 | 0 | 0 | 0.00% | 0.00% | 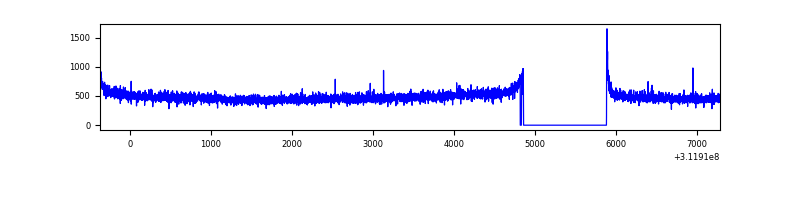 |
| D | 7650 | 6612 | 21 | 21 | 0.27% | 0.32% | 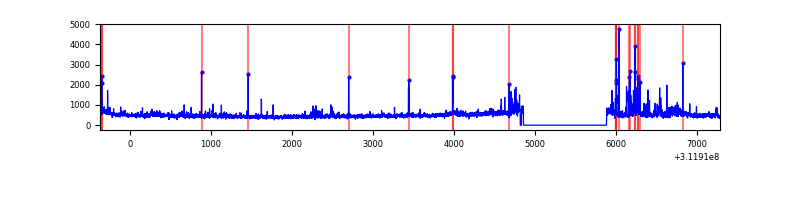 |
Top three noisy pixels from each quadrant. If the there are fewer than three noisy pixels in the level2.evt file, extra rows are filled as -1
| Pixel properties | Quadrant properties | ||||||
|---|---|---|---|---|---|---|---|
| Quadrant | DetID | PixID | Counts | Sigma | Mean | Median | Sigma |
| A | 13 | 254 | 10649 | 61.09 | 802 | 786 | 161.5 |
| A | 3 | 137 | 6864 | 37.64 | 802 | 786 | 161.5 |
| A | 0 | 226 | 6731 | 36.82 | 802 | 786 | 161.5 |
| B | 0 | 190 | 43559 | 281.72 | 807 | 788 | 151.8 |
| B | 12 | 111 | 18278 | 115.2 | 807 | 788 | 151.8 |
| B | 11 | 111 | 16002 | 100.21 | 807 | 788 | 151.8 |
| C | 14 | 238 | 124955 | 681.28 | 776 | 782 | 182.3 |
| C | 0 | 10 | 12726 | 65.53 | 776 | 782 | 182.3 |
| C | 0 | 239 | 6982 | 34.01 | 776 | 782 | 182.3 |
| D | 1 | 52 | 292929 | 1566.8 | 774 | 751 | 186.5 |
| D | 7 | 223 | 95870 | 510.07 | 774 | 751 | 186.5 |
| D | 12 | 227 | 51567 | 272.5 | 774 | 751 | 186.5 |
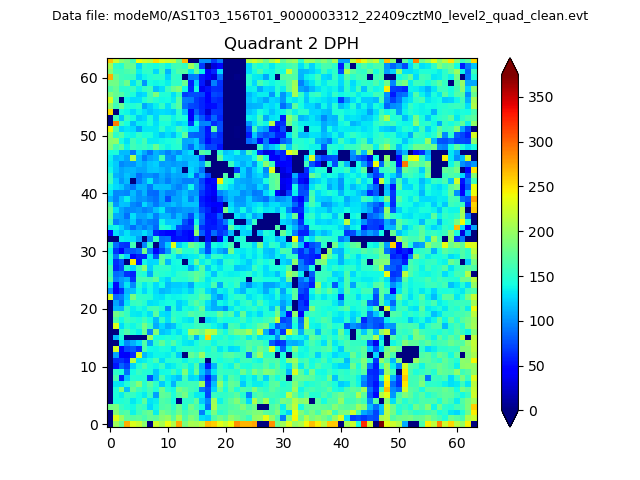
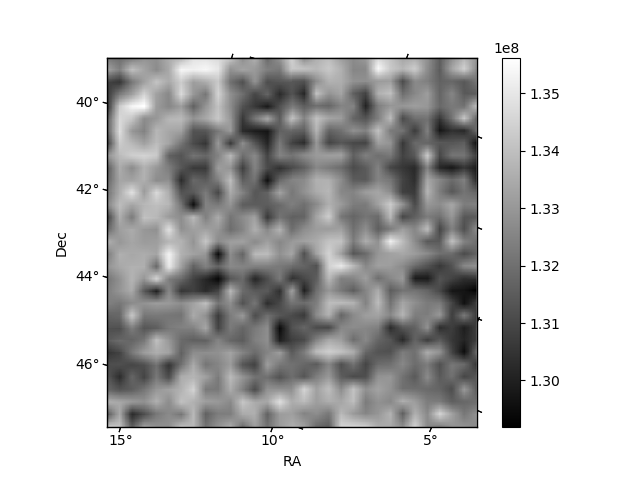
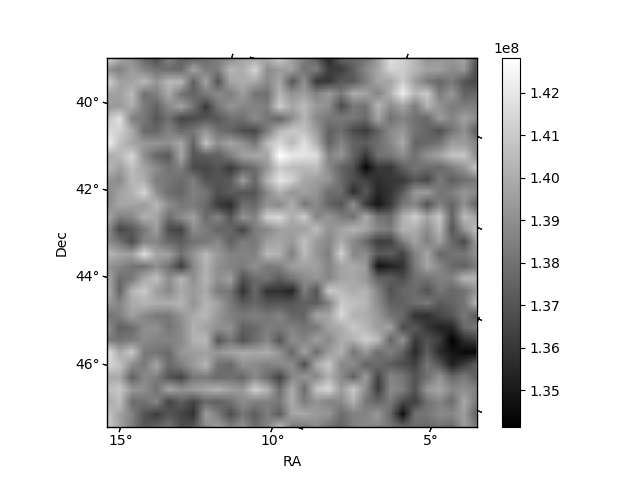
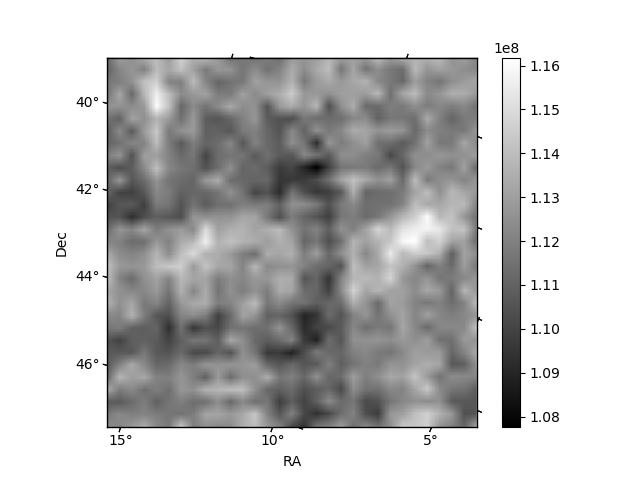
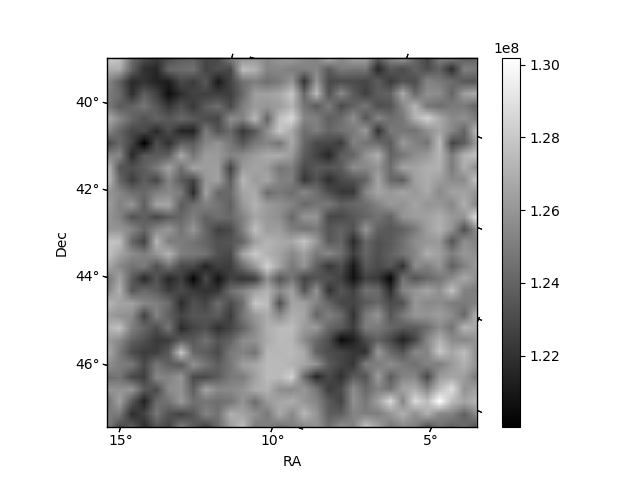
Histogram calculated using DETX and DETY for each event in the final _common_clean file
| Quadrant A | 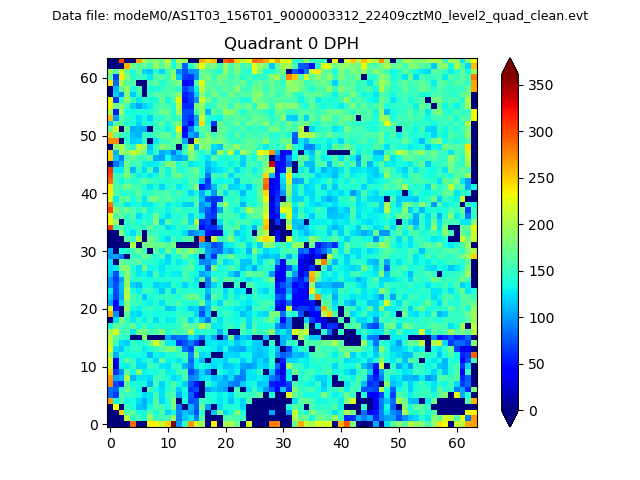 |
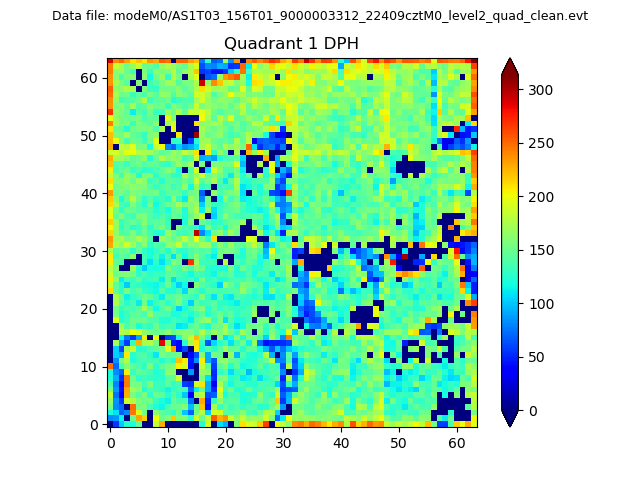 |
Quadrant B |
|---|---|---|---|
| Quadrant D | 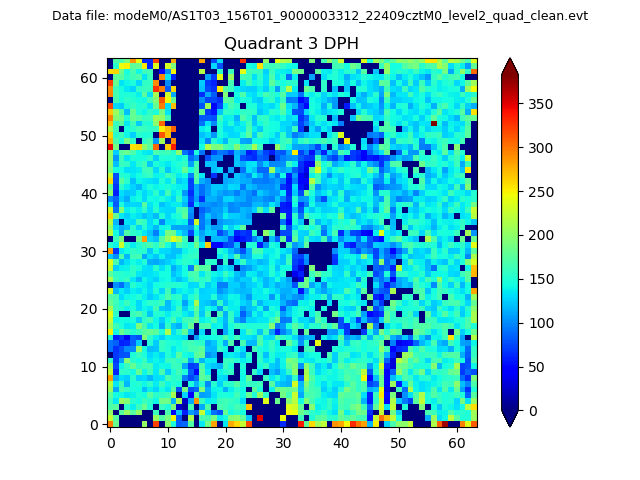 |
 |
Quadrant C |
| Plot type | Count rate plots | Images |
|---|---|---|
| Comparison with Poisson distribution Blue bars denote a histogram of data divided into 1 sec bins. Red curve is a Poisson curve with rate = median count rate of data. |
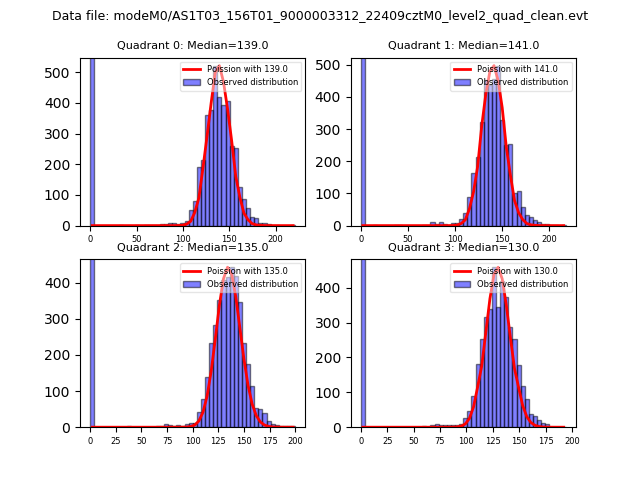 |
 |
| Quadrant-wise count rates Data is divided into 100 sec bins |
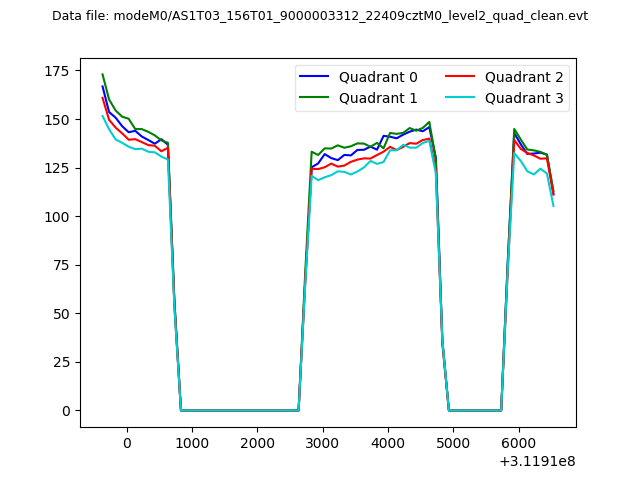 |
|
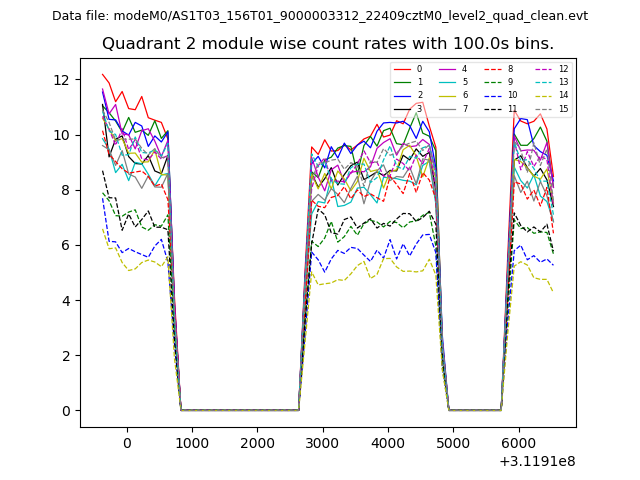
| Module-wise count rates for Quadrant A Data is divided into 100 sec bins |
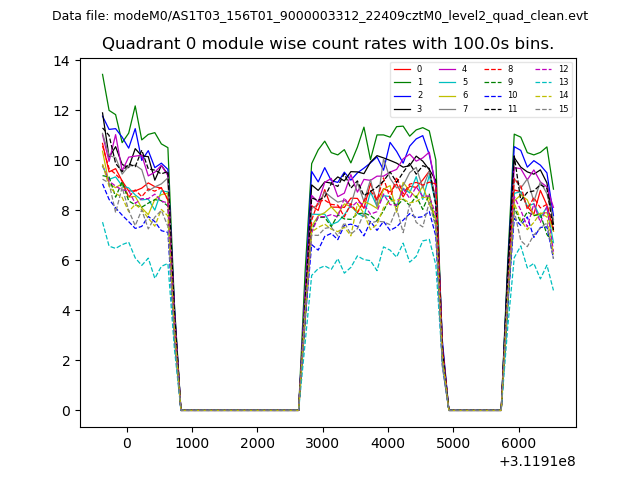 |
 |
| Module-wise count rates for Quadrant B Data is divided into 100 sec bins |
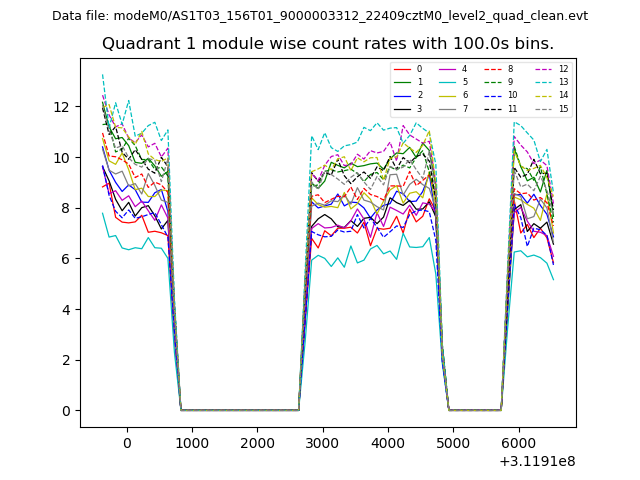 |
 |
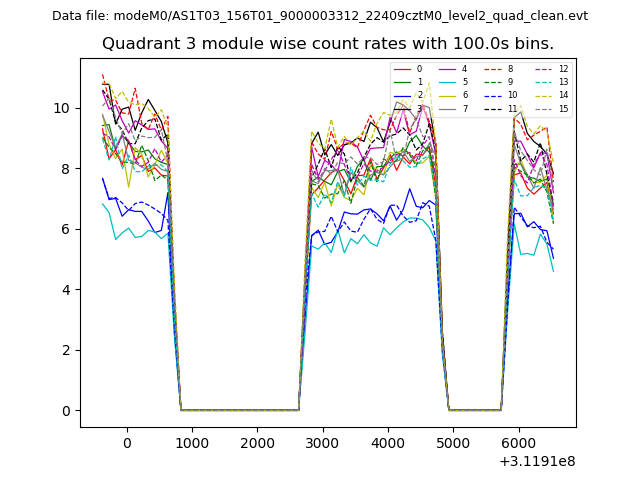
| Module-wise count rates for Quadrant C Data is divided into 100 sec bins |
 |
 |
| Module-wise count rates for Quadrant D Data is divided into 100 sec bins |
 |
 |
| Parameter | Plot |
|---|---|
| CZT HV Monitor |  |
| D_VDD | 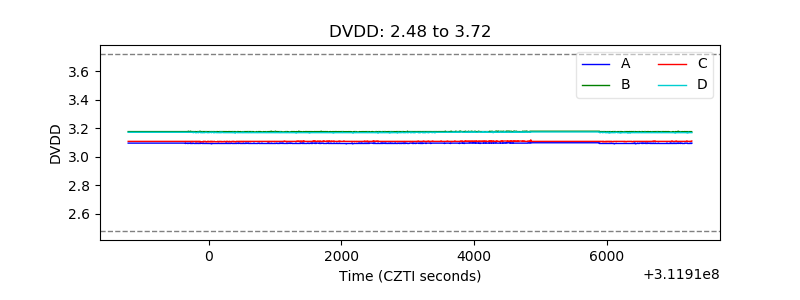 |
| Temperature 1 | 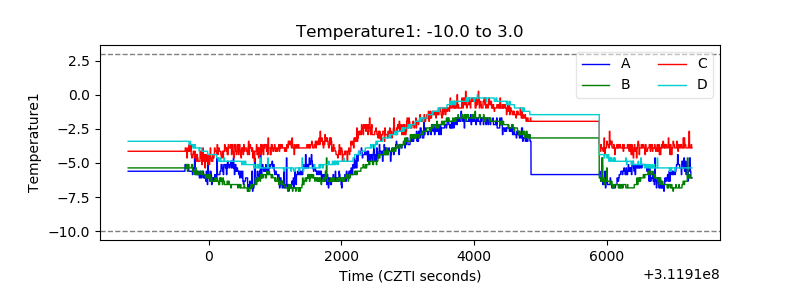 |
| Veto HV Monitor | 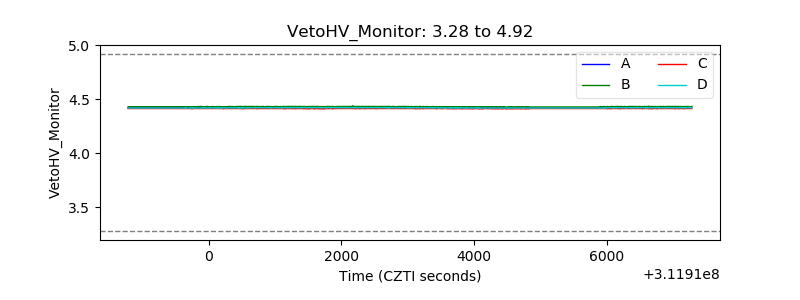 |
| Veto LLD |  |
| Alpha Counter | 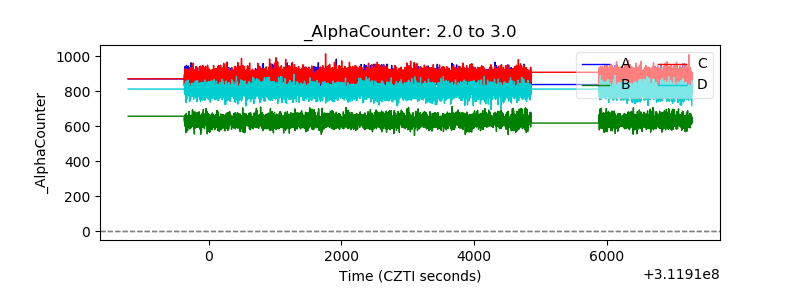 |
| _CPM_Rate | 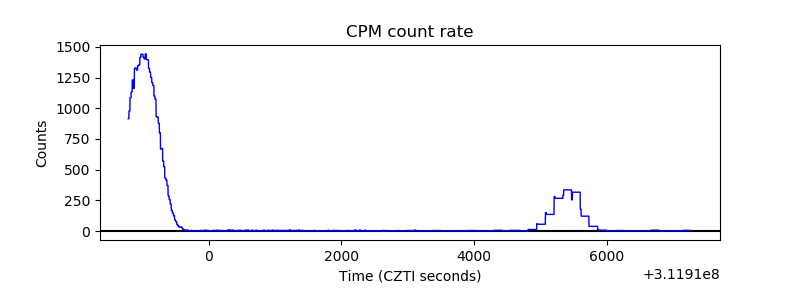 |
| CZT Counter | 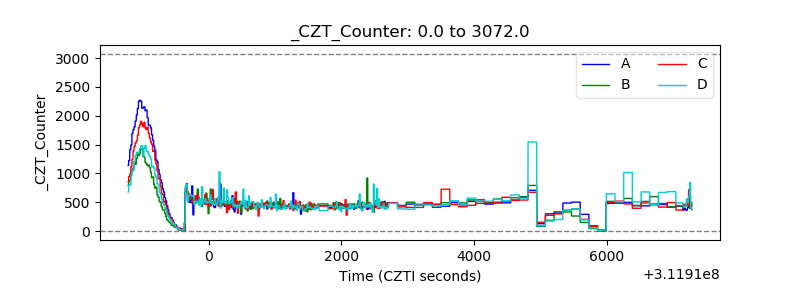 |
| +2.5 Volts monitor |  |
| +5 Volts monitor |  |
| _ROLL_ROT | 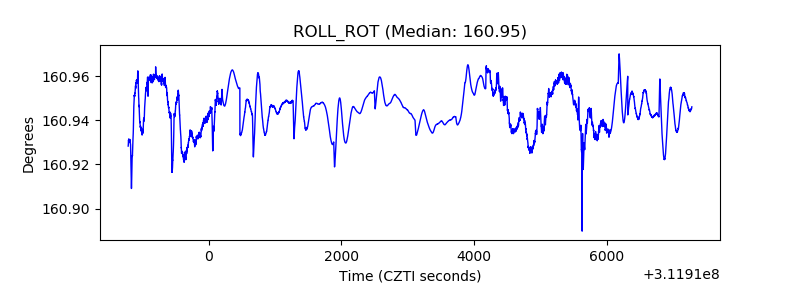 |
| _Roll_DEC | 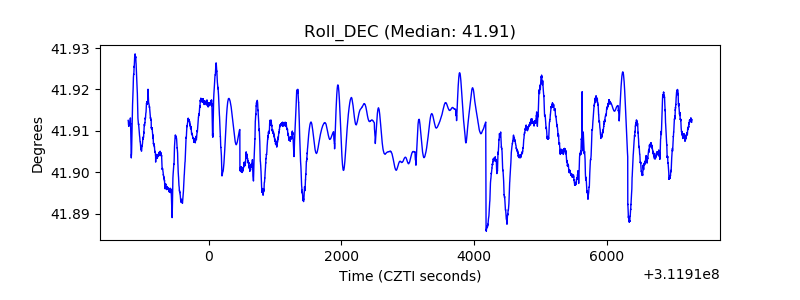 |
| _Roll_RA | 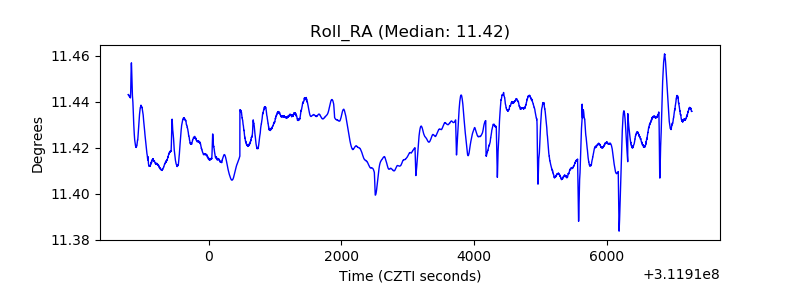 |
| Veto Counter | 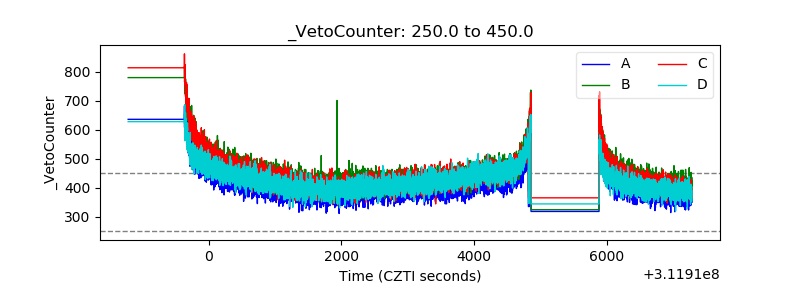 |