| Param | Original file | Final file |
|---|---|---|
| Filename | modeM0/AS1T03_156T01_9000003312_22410cztM0_level2.evt | modeM0/AS1T03_156T01_9000003312_22410cztM0_level2_quad_clean.evt |
| Size (bytes) | 497,954,880 | 83,741,760 |
| Size | 474.9 MB | 79.9 MB |
| Events in quadrant A | 3,335,532 | 517,660 |
| Events in quadrant B | 3,472,931 | 523,857 |
| Events in quadrant C | 3,398,817 | 504,140 |
| Events in quadrant D | 4,378,983 | 483,341 |
| Mode M9 | |||
|---|---|---|---|
| Quadrant | BADHDUFLAG | Total packets | Discarded packets |
| A | 0 | 5 | 0 |
| B | 0 | 5 | 0 |
| C | 0 | 5 | 0 |
| D | 0 | 5 | 0 |
| Mode SS | |||
|---|---|---|---|
| Quadrant | BADHDUFLAG | Total packets | Discarded packets |
| A | 0 | 150 | 0 |
| B | 0 | 150 | 0 |
| C | 0 | 150 | 0 |
| D | 0 | 150 | 0 |
| Mode M0 | |||
|---|---|---|---|
| Quadrant | BADHDUFLAG | Total packets | Discarded packets |
| A | 0 | 14775 | 2 |
| B | 0 | 14974 | 2 |
| C | 0 | 14833 | 2 |
| D | 0 | 17906 | 2 |
| Quadrant | Total seconds | Saturated seconds | Saturation percentage |
|---|---|---|---|
| A | 7271 | 61 | 0.838949% |
| B | 7272 | 80 | 1.100110% |
| C | 7272 | 96 | 1.320132% |
| D | 7271 | 102 | 1.402833% |
Noise dominated data is calculated using 1-second bins in cleaned event files. If a bin has >2000 counts, and if more than 50% of those come from <1% of pixels, then it is considered to be noise-dominated and hence unusable.
| Quadrant | # 1 sec bins | Bins with >0 counts | Bins with >2000 counts | High rate bins dominated by noise | Noise dominated (total time) | Noise dominated (detector-on time) | Marked lightcurve |
|---|---|---|---|---|---|---|---|
| A | 7866 | 7273 | 0 | 0 | 0.00% | 0.00% |  |
| B | 7867 | 7274 | 2 | 2 | 0.03% | 0.03% | 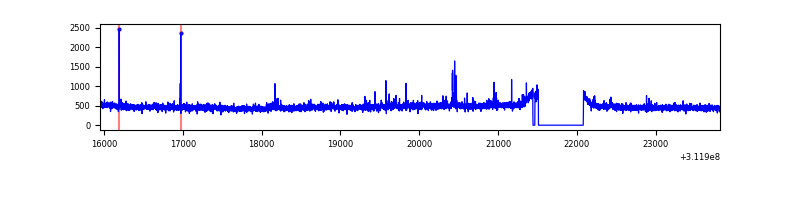 |
| C | 7867 | 7274 | 0 | 0 | 0.00% | 0.00% | 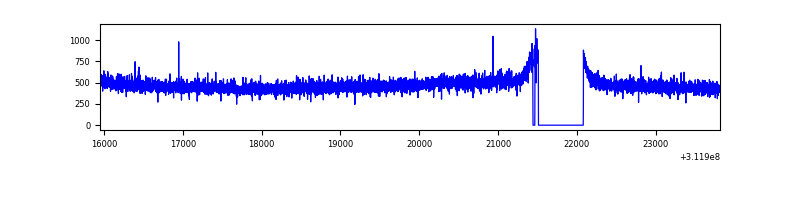 |
| D | 7866 | 7273 | 54 | 54 | 0.69% | 0.74% |  |
Top three noisy pixels from each quadrant. If the there are fewer than three noisy pixels in the level2.evt file, extra rows are filled as -1
| Pixel properties | Quadrant properties | ||||||
|---|---|---|---|---|---|---|---|
| Quadrant | DetID | PixID | Counts | Sigma | Mean | Median | Sigma |
| A | 13 | 254 | 10418 | 55.53 | 863 | 844 | 172.4 |
| A | 3 | 137 | 7469 | 38.43 | 863 | 844 | 172.4 |
| A | 0 | 226 | 7299 | 37.44 | 863 | 844 | 172.4 |
| B | 0 | 228 | 22765 | 132.81 | 868 | 846 | 165.0 |
| B | 12 | 111 | 20243 | 117.53 | 868 | 846 | 165.0 |
| B | 11 | 111 | 17757 | 102.47 | 868 | 846 | 165.0 |
| C | 14 | 238 | 133602 | 671.03 | 837 | 843 | 197.8 |
| C | 13 | 61 | 5740 | 24.75 | 837 | 843 | 197.8 |
| C | 14 | 67 | 2096 | 6.33 | 837 | 843 | 197.8 |
| D | 1 | 52 | 545808 | 2689.08 | 836 | 812 | 202.7 |
| D | 12 | 227 | 292949 | 1441.44 | 836 | 812 | 202.7 |
| D | 13 | 249 | 175888 | 863.85 | 836 | 812 | 202.7 |
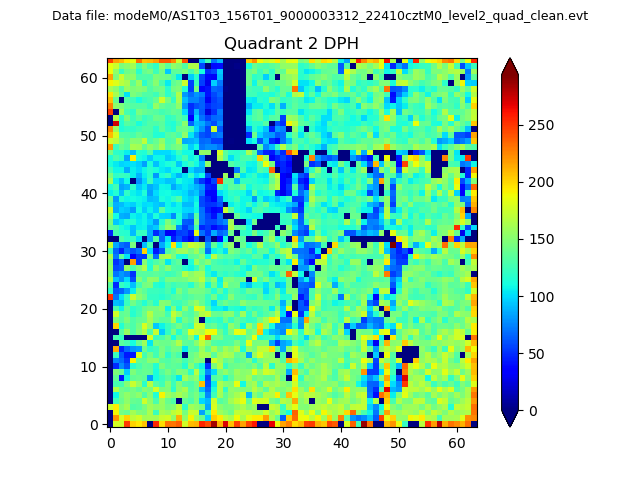
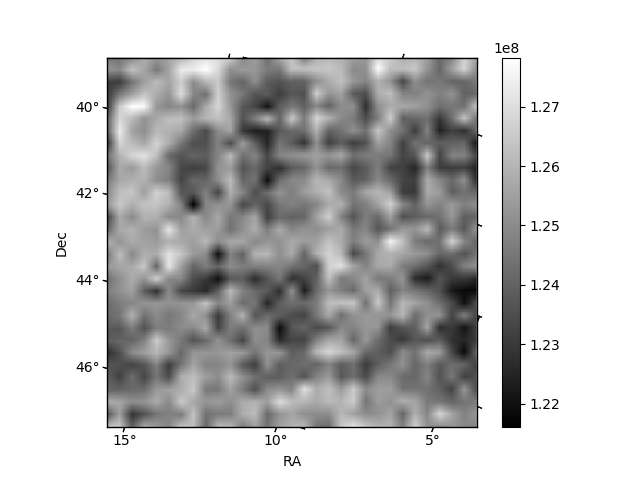
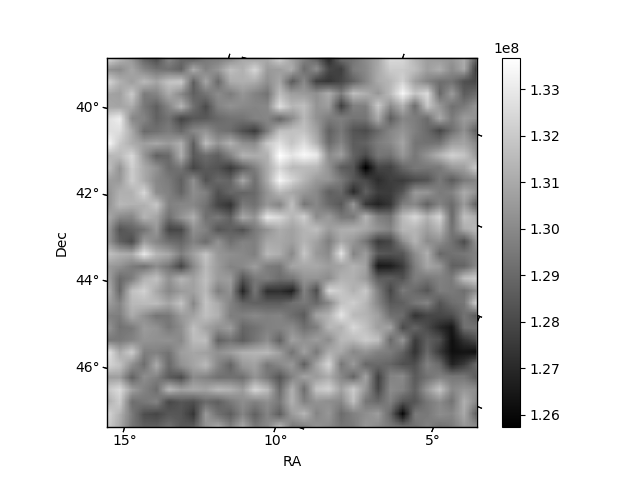
Histogram calculated using DETX and DETY for each event in the final _common_clean file
| Quadrant A | 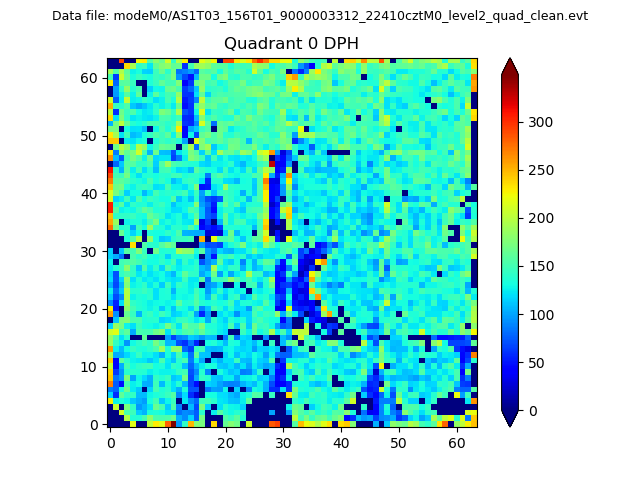 |
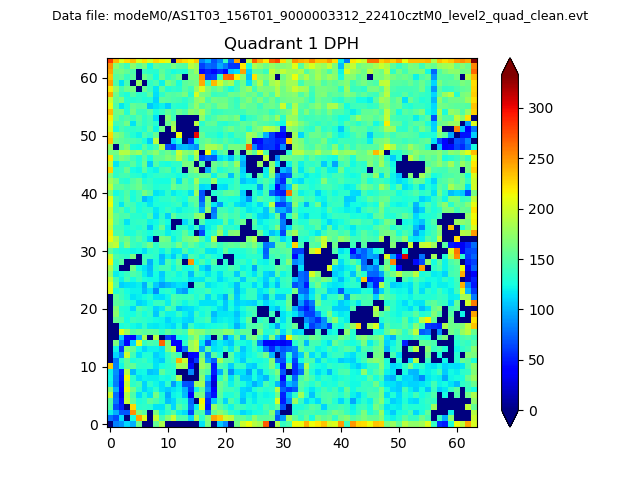 |
Quadrant B |
|---|---|---|---|
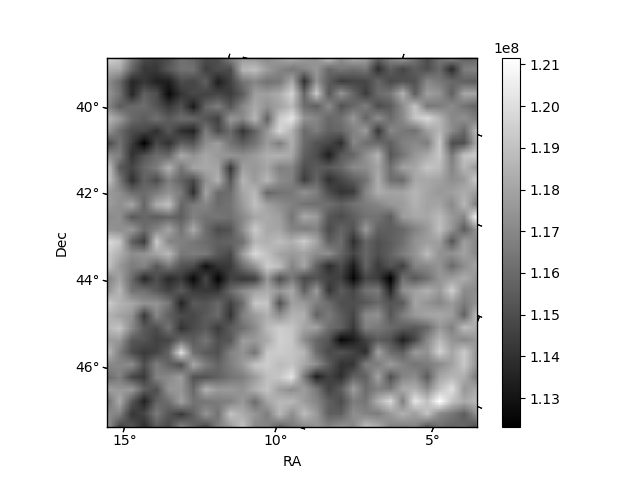
| Quadrant D |  |
 |
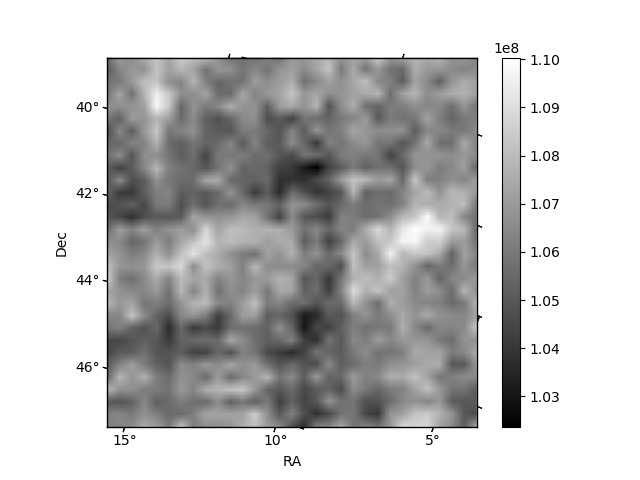
Quadrant C |
| Plot type | Count rate plots | Images |
|---|---|---|
| Comparison with Poisson distribution Blue bars denote a histogram of data divided into 1 sec bins. Red curve is a Poisson curve with rate = median count rate of data. |
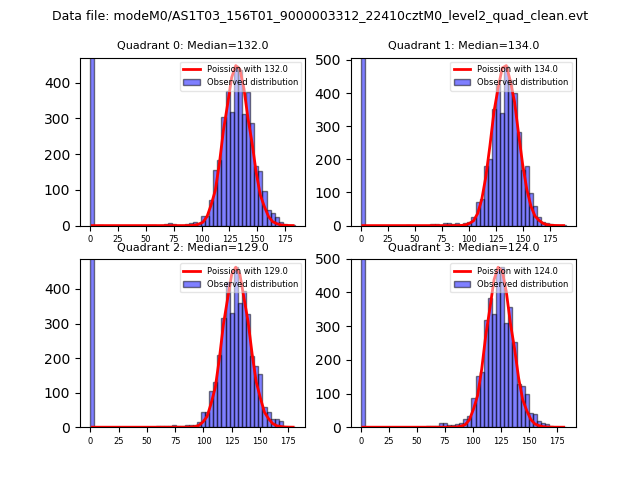 |
 |
| Quadrant-wise count rates Data is divided into 100 sec bins |
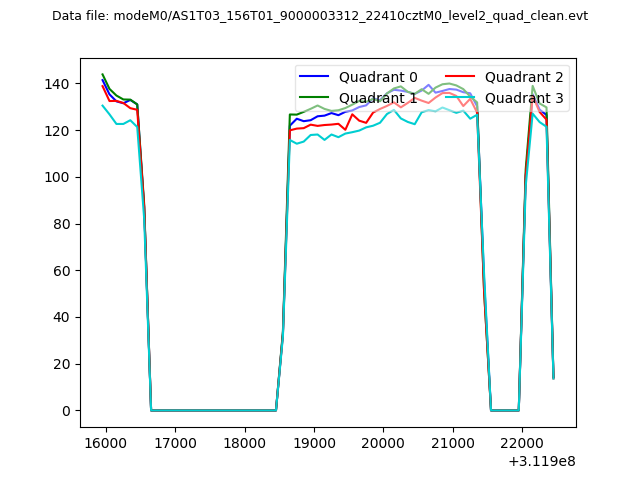 |
|
| Module-wise count rates for Quadrant A Data is divided into 100 sec bins |
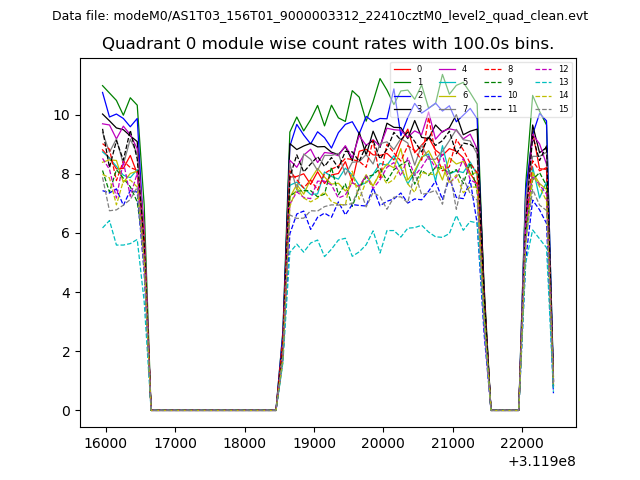 |
 |
| Module-wise count rates for Quadrant B Data is divided into 100 sec bins |
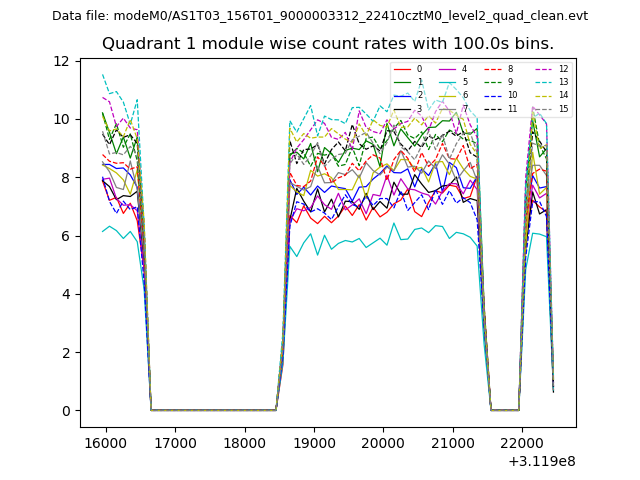 |
 |
| Module-wise count rates for Quadrant C Data is divided into 100 sec bins |
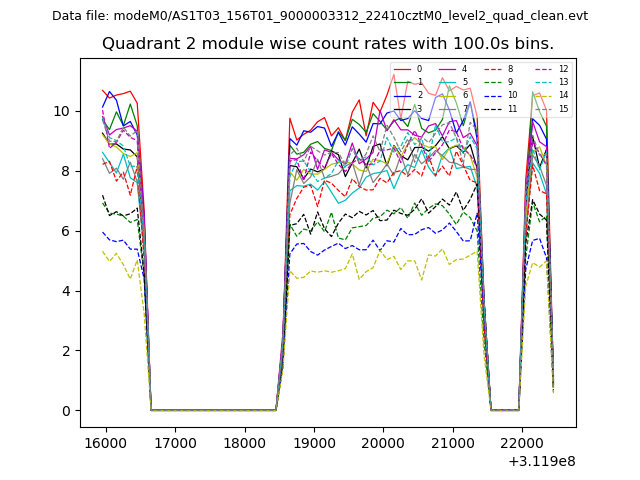 |
 |
| Module-wise count rates for Quadrant D Data is divided into 100 sec bins |
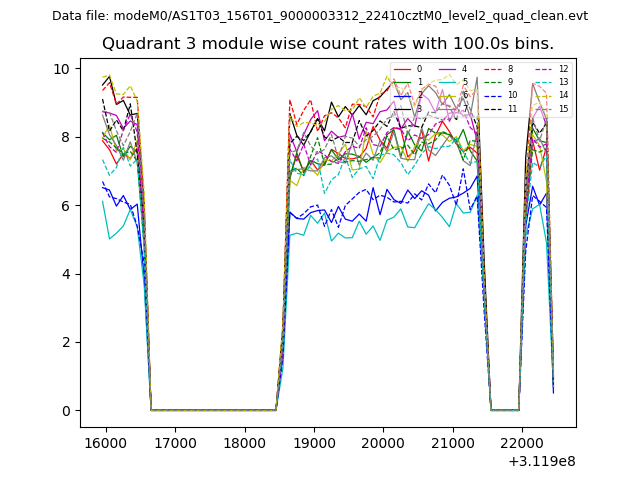 |
 |
| Parameter | Plot |
|---|---|
| CZT HV Monitor | 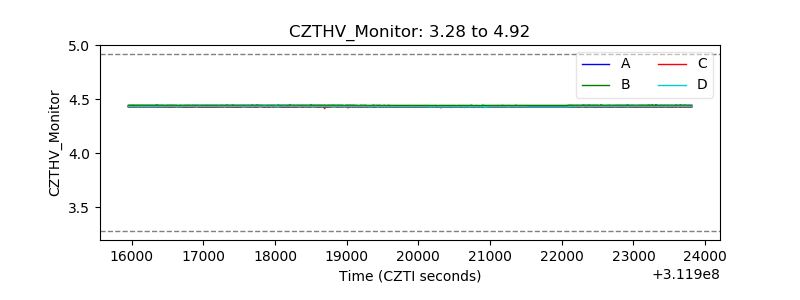 |
| D_VDD | 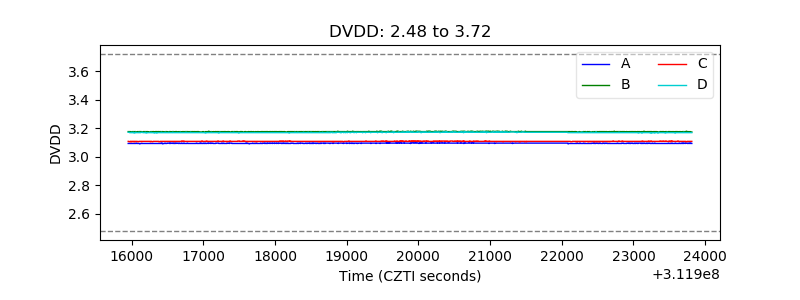 |
| Temperature 1 |  |
| Veto HV Monitor | 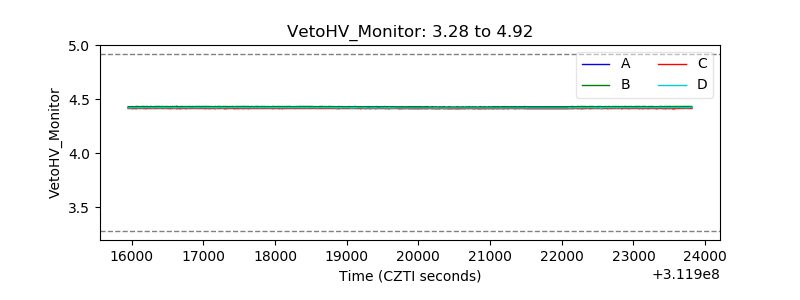 |
| Veto LLD | 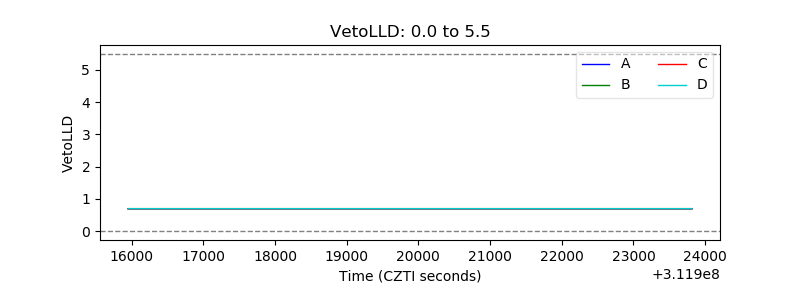 |
| Alpha Counter | 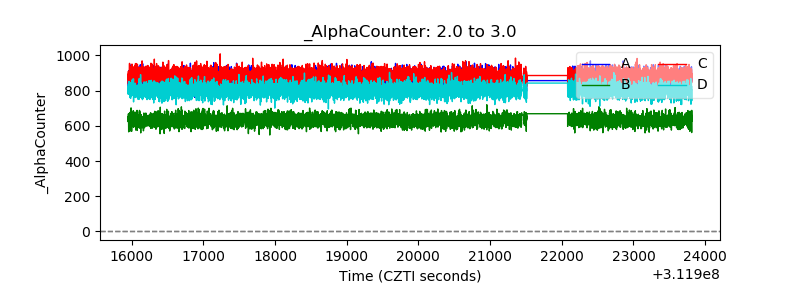 |
| _CPM_Rate | 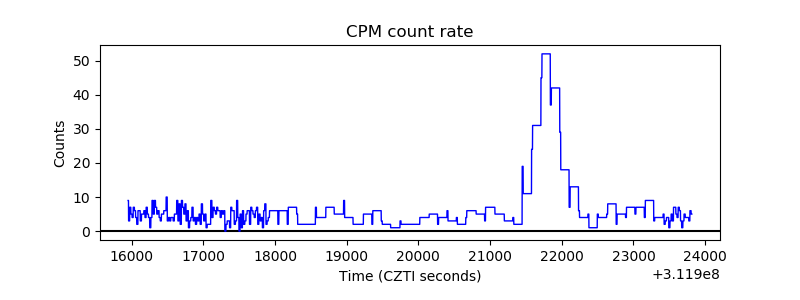 |
| CZT Counter | 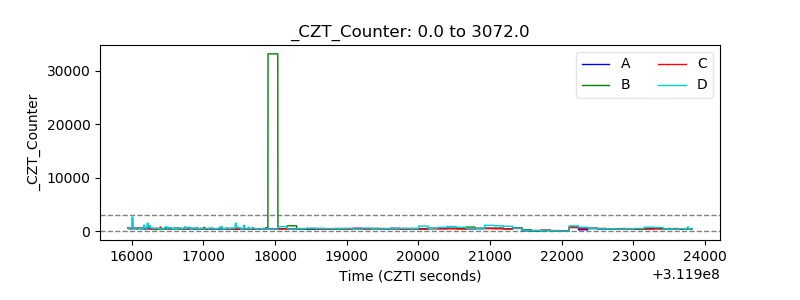 |
| +2.5 Volts monitor |  |
| +5 Volts monitor |  |
| _ROLL_ROT | 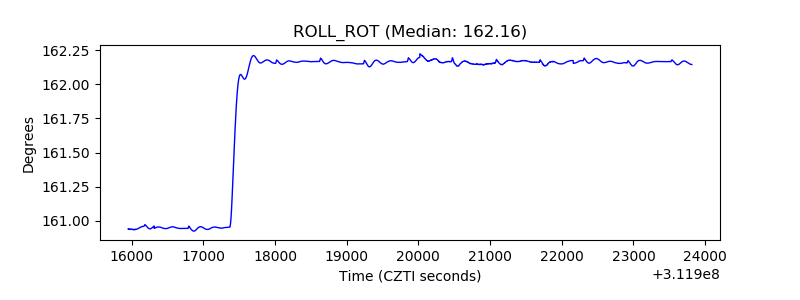 |
| _Roll_DEC | 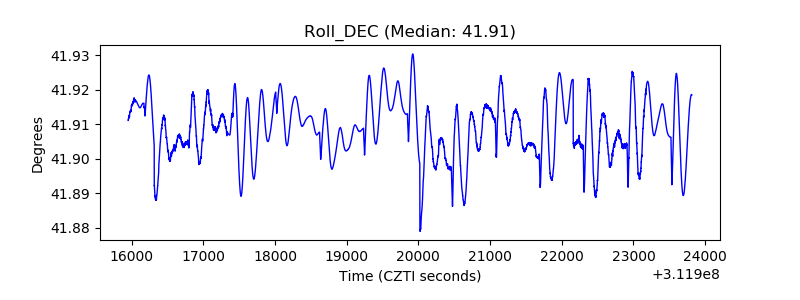 |
| _Roll_RA | 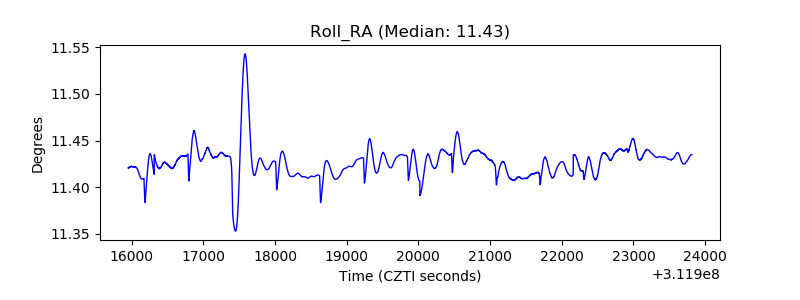 |
| Veto Counter | 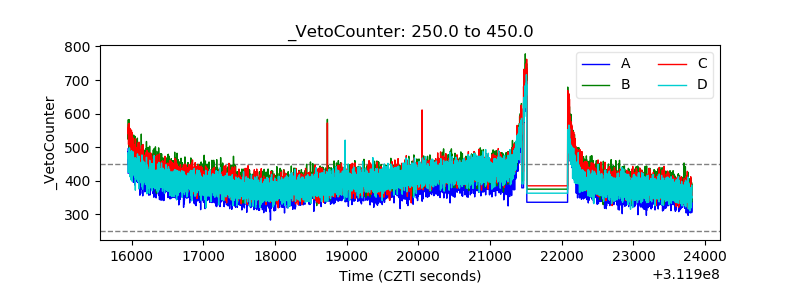 |