| Param | Original file | Final file |
|---|---|---|
| Filename | modeM0/AS1T03_156T01_9000003312_22411cztM0_level2.evt | modeM0/AS1T03_156T01_9000003312_22411cztM0_level2_quad_clean.evt |
| Size (bytes) | 558,486,720 | 96,511,680 |
| Size | 532.6 MB | 92.0 MB |
| Events in quadrant A | 3,868,708 | 597,956 |
| Events in quadrant B | 4,006,219 | 603,989 |
| Events in quadrant C | 3,949,411 | 581,983 |
| Events in quadrant D | 4,531,369 | 567,225 |
| Mode M9 | |||
|---|---|---|---|
| Quadrant | BADHDUFLAG | Total packets | Discarded packets |
| A | 0 | 7 | 0 |
| B | 0 | 7 | 0 |
| C | 0 | 7 | 0 |
| D | 0 | 7 | 0 |
| Mode SS | |||
|---|---|---|---|
| Quadrant | BADHDUFLAG | Total packets | Discarded packets |
| A | 0 | 172 | 0 |
| B | 0 | 172 | 0 |
| C | 0 | 172 | 0 |
| D | 0 | 172 | 0 |
| Mode M0 | |||
|---|---|---|---|
| Quadrant | BADHDUFLAG | Total packets | Discarded packets |
| A | 0 | 16980 | 3 |
| B | 0 | 17188 | 3 |
| C | 0 | 17057 | 3 |
| D | 0 | 18892 | 3 |
| Quadrant | Total seconds | Saturated seconds | Saturation percentage |
|---|---|---|---|
| A | 8215 | 194 | 2.361534% |
| B | 8216 | 262 | 3.188900% |
| C | 8215 | 232 | 2.824102% |
| D | 8215 | 215 | 2.617164% |
Noise dominated data is calculated using 1-second bins in cleaned event files. If a bin has >2000 counts, and if more than 50% of those come from <1% of pixels, then it is considered to be noise-dominated and hence unusable.
| Quadrant | # 1 sec bins | Bins with >0 counts | Bins with >2000 counts | High rate bins dominated by noise | Noise dominated (total time) | Noise dominated (detector-on time) | Marked lightcurve |
|---|---|---|---|---|---|---|---|
| A | 9000 | 8217 | 0 | 0 | 0.00% | 0.00% | 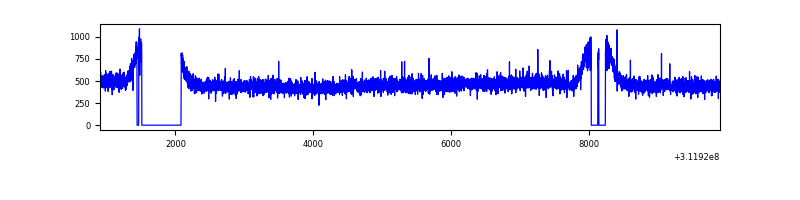 |
| B | 9001 | 8218 | 0 | 0 | 0.00% | 0.00% |  |
| C | 9000 | 8219 | 0 | 0 | 0.00% | 0.00% | 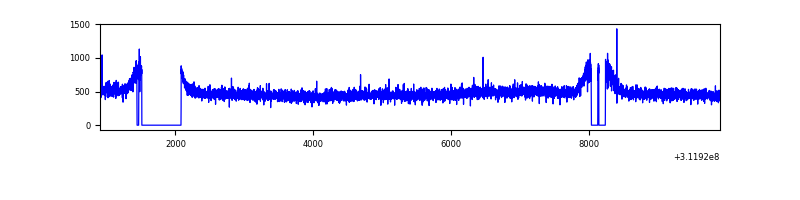 |
| D | 9000 | 8218 | 56 | 56 | 0.62% | 0.68% | 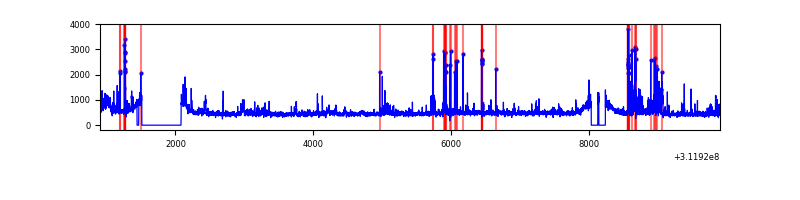 |
Top three noisy pixels from each quadrant. If the there are fewer than three noisy pixels in the level2.evt file, extra rows are filled as -1
| Pixel properties | Quadrant properties | ||||||
|---|---|---|---|---|---|---|---|
| Quadrant | DetID | PixID | Counts | Sigma | Mean | Median | Sigma |
| A | 13 | 254 | 11307 | 50.83 | 1003 | 979 | 203.2 |
| A | 3 | 137 | 9009 | 39.52 | 1003 | 979 | 203.2 |
| A | 0 | 226 | 8611 | 37.56 | 1003 | 979 | 203.2 |
| B | 12 | 111 | 23987 | 119.4 | 1004 | 977 | 192.7 |
| B | 11 | 111 | 21217 | 105.03 | 1004 | 977 | 192.7 |
| B | 14 | 111 | 18277 | 89.77 | 1004 | 977 | 192.7 |
| C | 14 | 238 | 151374 | 651.43 | 973 | 976 | 230.9 |
| C | 13 | 61 | 6852 | 25.45 | 973 | 976 | 230.9 |
| C | 9 | 54 | 2538 | 6.77 | 973 | 976 | 230.9 |
| D | 1 | 52 | 466782 | 1963.64 | 976 | 947 | 237.2 |
| D | 12 | 227 | 113469 | 474.32 | 976 | 947 | 237.2 |
| D | 13 | 249 | 105586 | 441.09 | 976 | 947 | 237.2 |
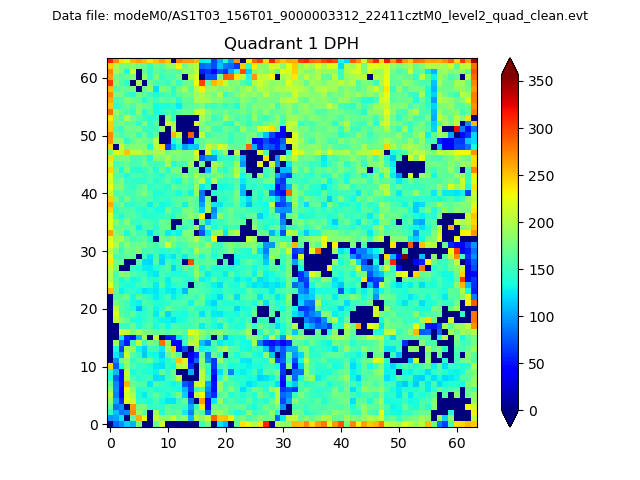
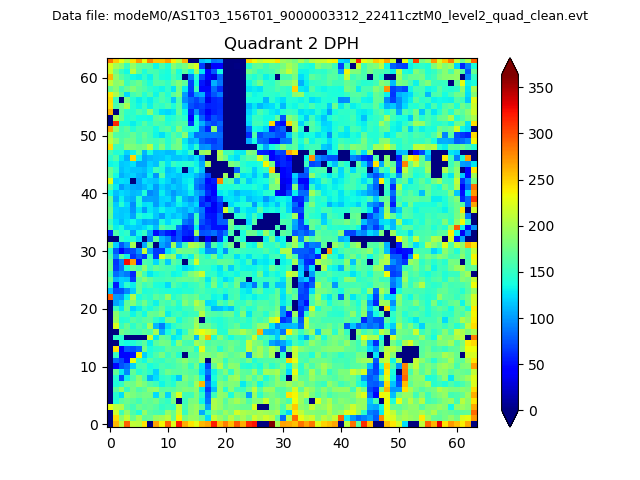
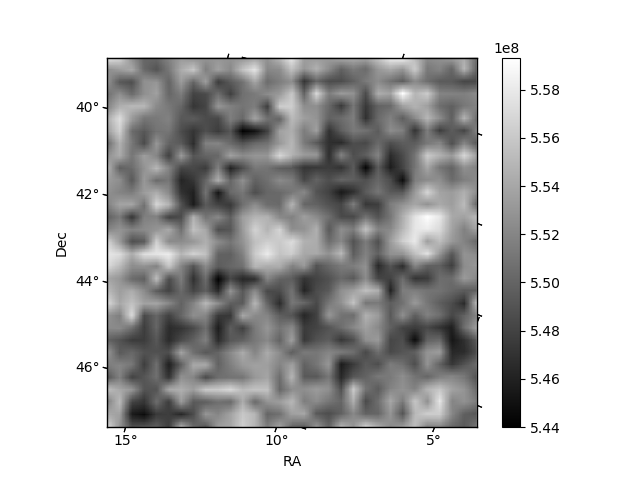
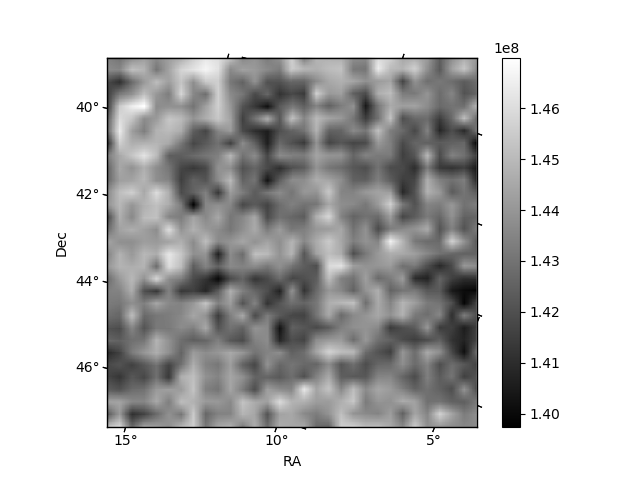
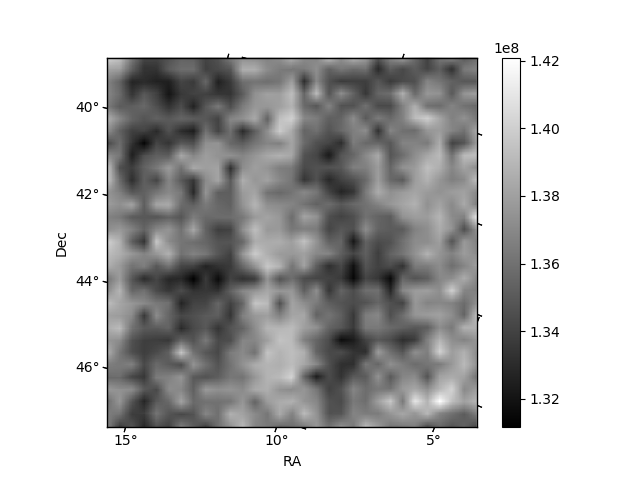
Histogram calculated using DETX and DETY for each event in the final _common_clean file
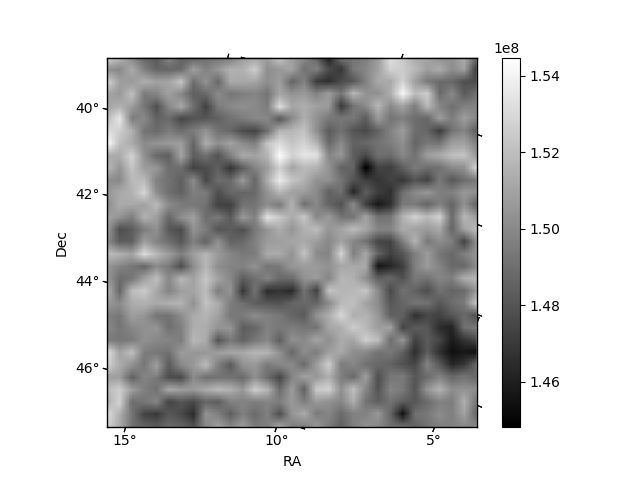
| Quadrant A | 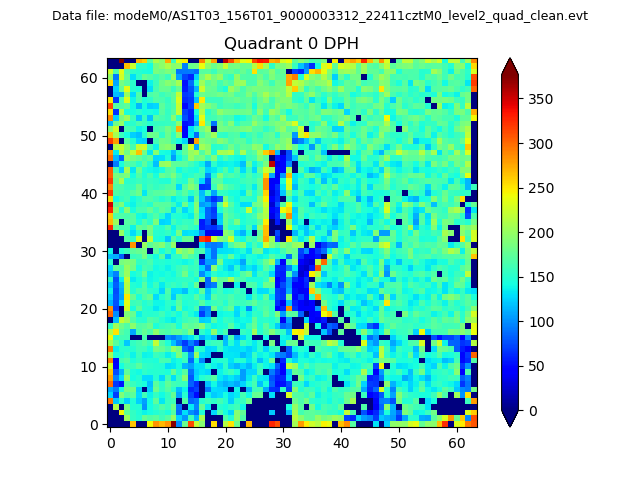 |
 |
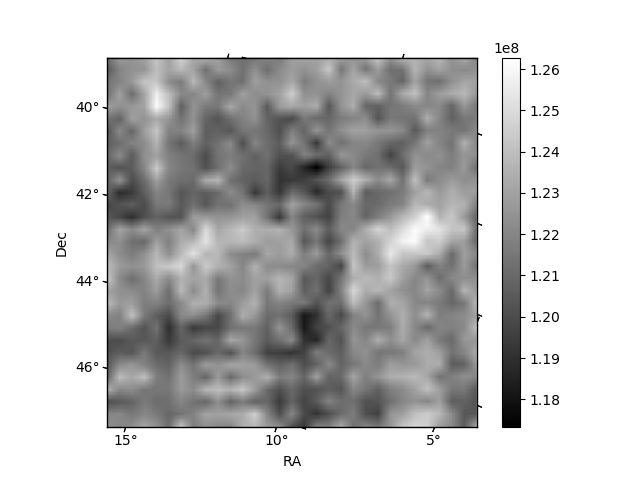
Quadrant B |
|---|---|---|---|
| Quadrant D | 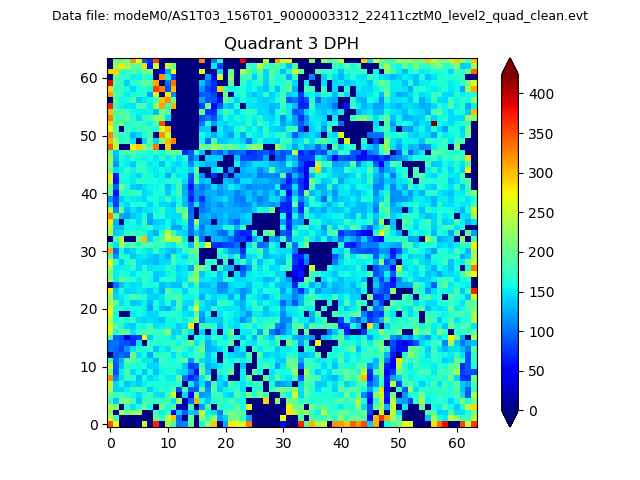 |
 |
Quadrant C |
| Plot type | Count rate plots | Images |
|---|---|---|
| Comparison with Poisson distribution Blue bars denote a histogram of data divided into 1 sec bins. Red curve is a Poisson curve with rate = median count rate of data. |
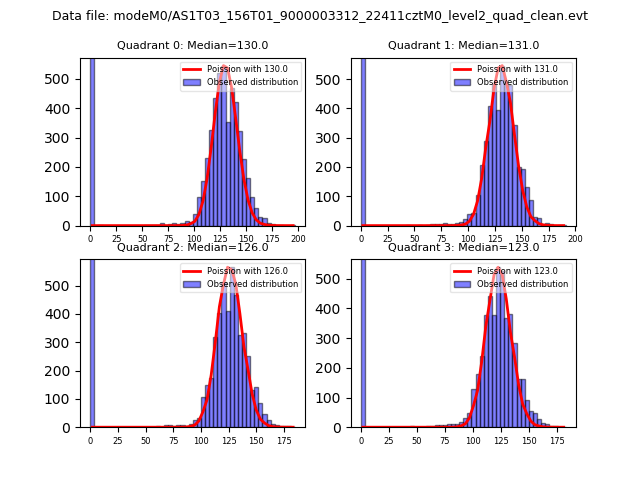 |
 |
| Quadrant-wise count rates Data is divided into 100 sec bins |
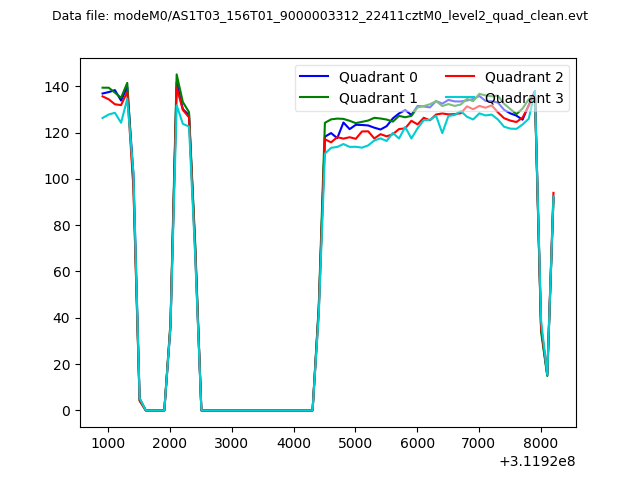 |
|
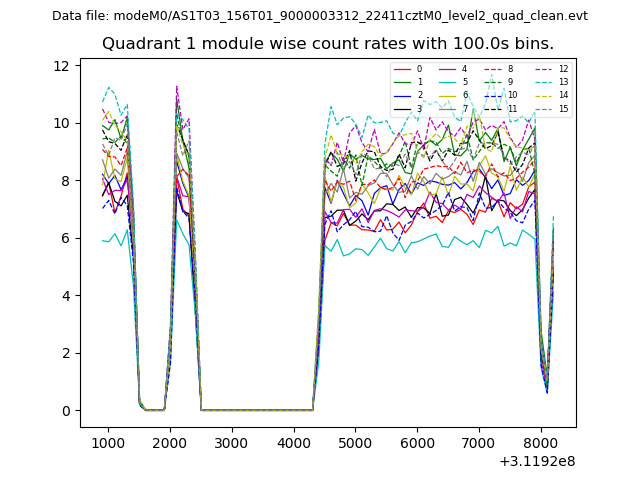
| Module-wise count rates for Quadrant A Data is divided into 100 sec bins |
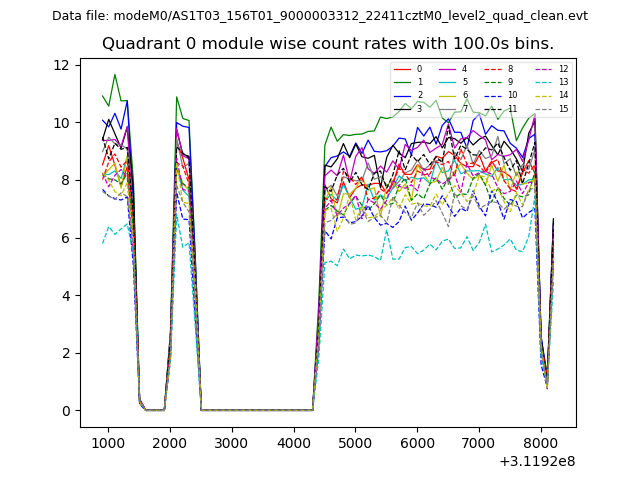 |
 |
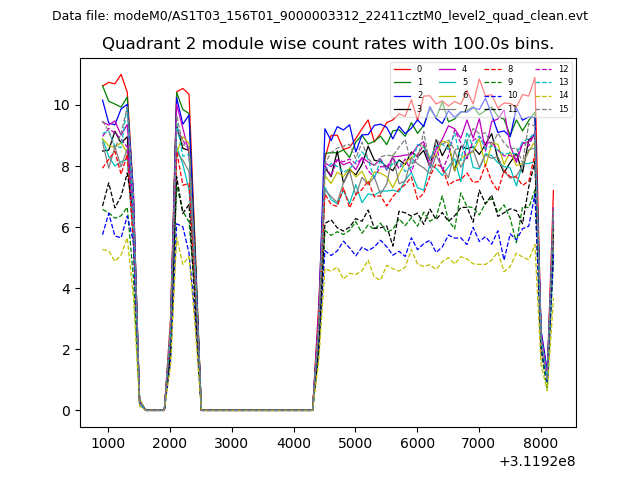
| Module-wise count rates for Quadrant B Data is divided into 100 sec bins |
 |
 |
| Module-wise count rates for Quadrant C Data is divided into 100 sec bins |
 |
 |
| Module-wise count rates for Quadrant D Data is divided into 100 sec bins |
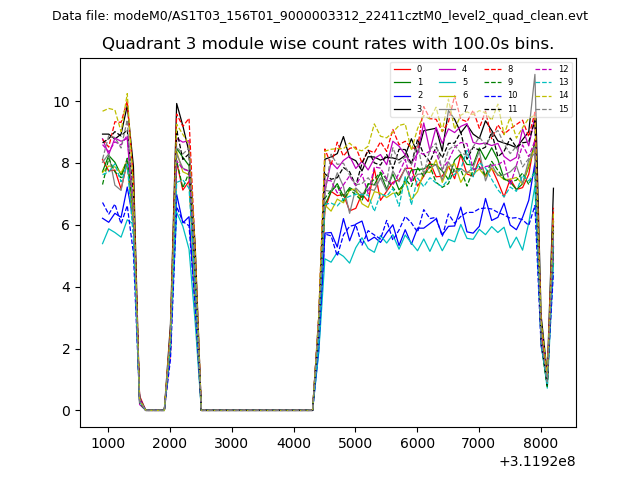 |
 |
| Parameter | Plot |
|---|---|
| CZT HV Monitor | 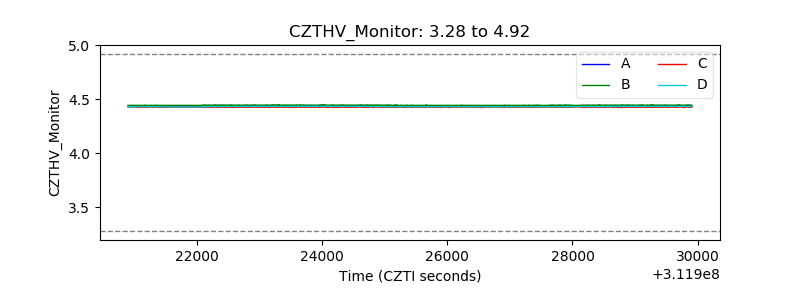 |
| D_VDD | 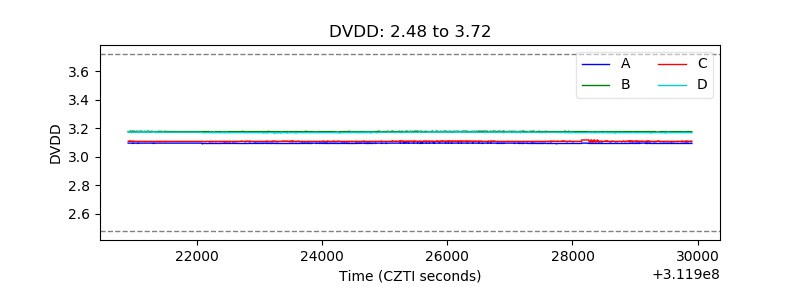 |
| Temperature 1 | 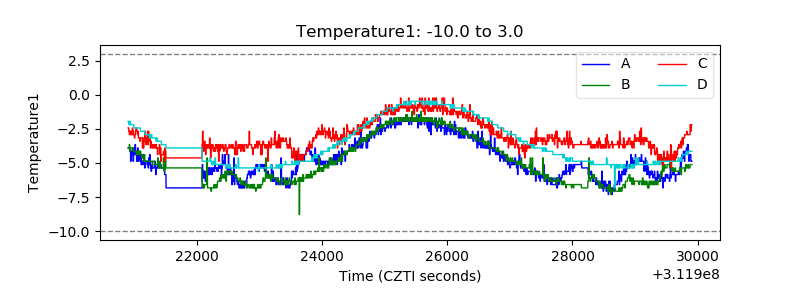 |
| Veto HV Monitor | 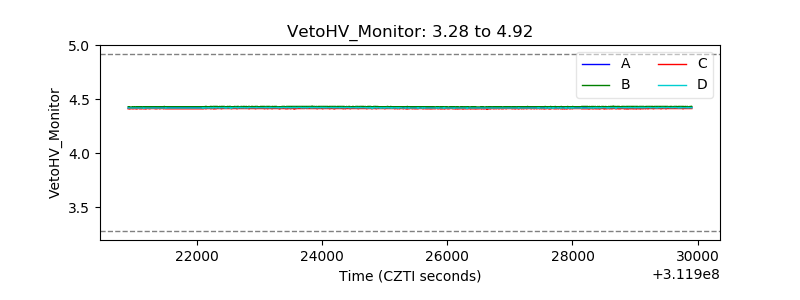 |
| Veto LLD | 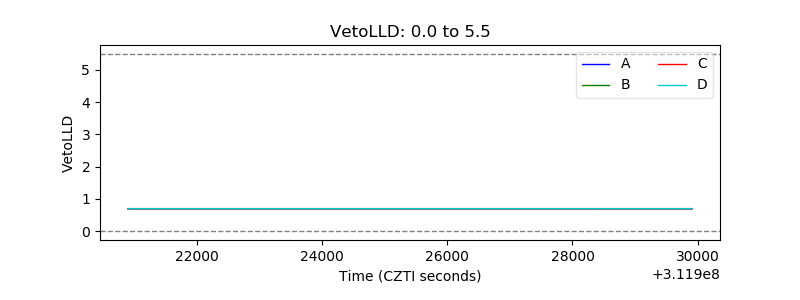 |
| Alpha Counter | 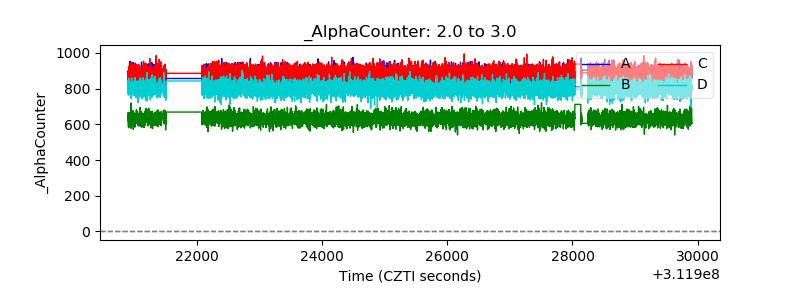 |
| _CPM_Rate | 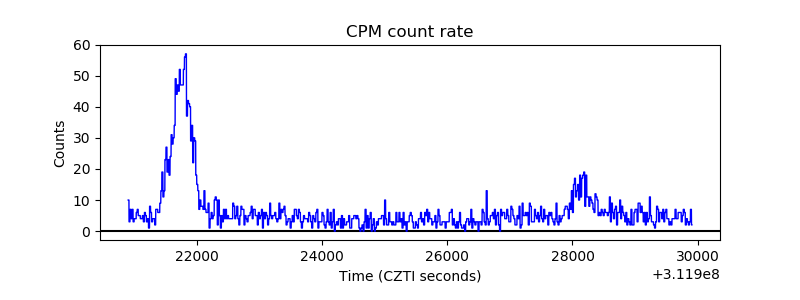 |
| CZT Counter | 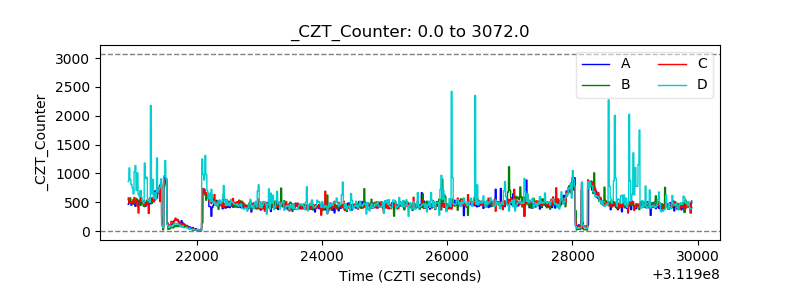 |
| +2.5 Volts monitor |  |
| +5 Volts monitor | 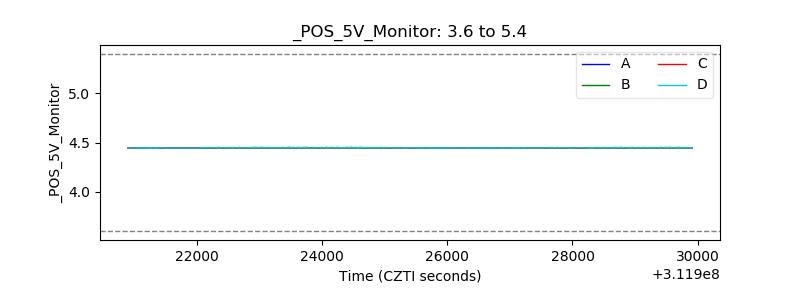 |
| _ROLL_ROT | 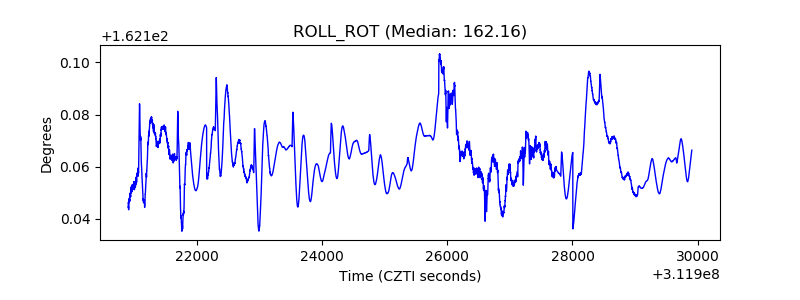 |
| _Roll_DEC | 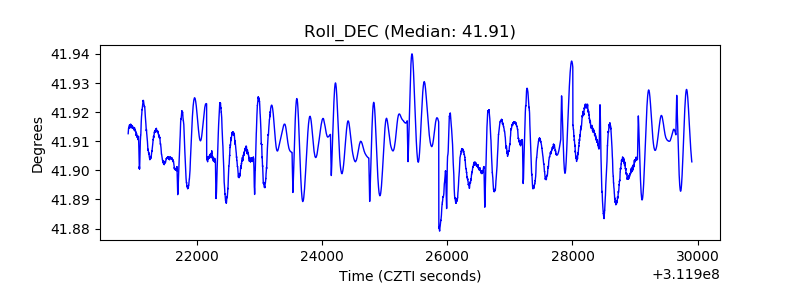 |
| _Roll_RA | 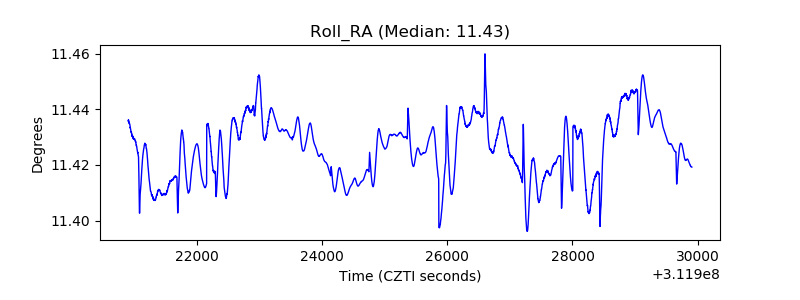 |
| Veto Counter | 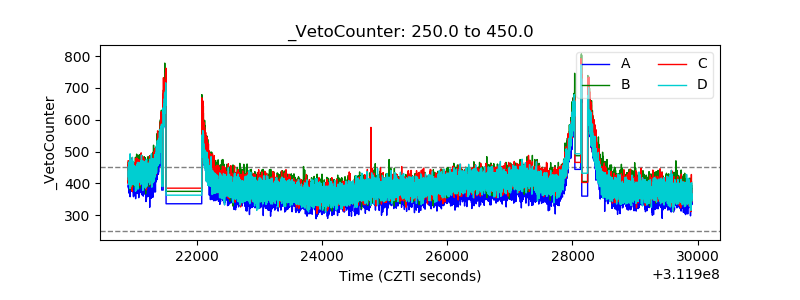 |