| Param | Original file | Final file |
|---|---|---|
| Filename | modeM0/AS1T03_156T01_9000003312_22416cztM0_level2.evt | modeM0/AS1T03_156T01_9000003312_22416cztM0_level2_quad_clean.evt |
| Size (bytes) | 284,400,000 | 63,564,480 |
| Size | 271.2 MB | 60.6 MB |
| Events in quadrant A | 1,943,872 | 413,092 |
| Events in quadrant B | 2,038,326 | 417,697 |
| Events in quadrant C | 1,967,004 | 399,361 |
| Events in quadrant D | 2,365,879 | 387,407 |
| Mode SS | |||
|---|---|---|---|
| Quadrant | BADHDUFLAG | Total packets | Discarded packets |
| A | 0 | 88 | 0 |
| B | 0 | 88 | 0 |
| C | 0 | 88 | 0 |
| D | 0 | 88 | 0 |
| Mode M0 | |||
|---|---|---|---|
| Quadrant | BADHDUFLAG | Total packets | Discarded packets |
| A | 0 | 8737 | 0 |
| B | 0 | 8884 | 0 |
| C | 0 | 8748 | 0 |
| D | 0 | 9992 | 0 |
| Quadrant | Total seconds | Saturated seconds | Saturation percentage |
|---|---|---|---|
| A | 4360 | 1 | 0.022936% |
| B | 4360 | 4 | 0.091743% |
| C | 4360 | 11 | 0.252294% |
| D | 4360 | 50 | 1.146789% |
Noise dominated data is calculated using 1-second bins in cleaned event files. If a bin has >2000 counts, and if more than 50% of those come from <1% of pixels, then it is considered to be noise-dominated and hence unusable.
| Quadrant | # 1 sec bins | Bins with >0 counts | Bins with >2000 counts | High rate bins dominated by noise | Noise dominated (total time) | Noise dominated (detector-on time) | Marked lightcurve |
|---|---|---|---|---|---|---|---|
| A | 4360 | 4360 | 0 | 0 | 0.00% | 0.00% | 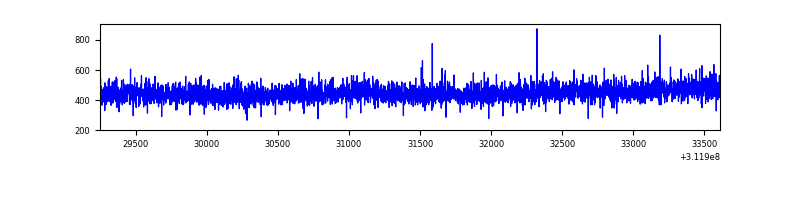 |
| B | 4360 | 4360 | 2 | 2 | 0.05% | 0.05% | 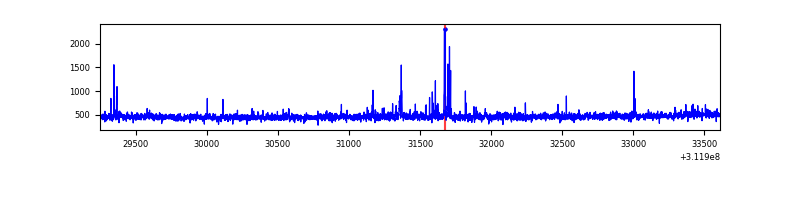 |
| C | 4360 | 4360 | 0 | 0 | 0.00% | 0.00% | 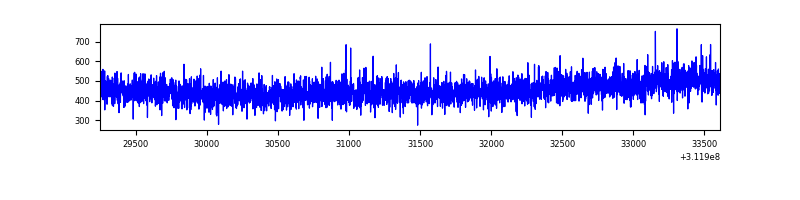 |
| D | 4360 | 4360 | 44 | 44 | 1.01% | 1.01% | 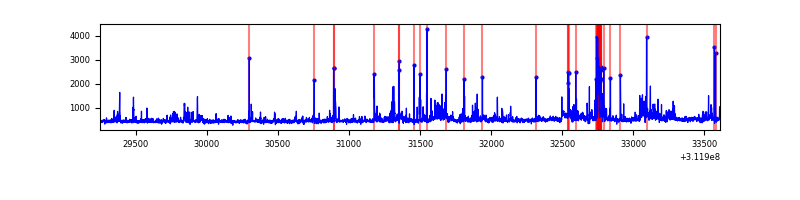 |
Top three noisy pixels from each quadrant. If the there are fewer than three noisy pixels in the level2.evt file, extra rows are filled as -1
| Pixel properties | Quadrant properties | ||||||
|---|---|---|---|---|---|---|---|
| Quadrant | DetID | PixID | Counts | Sigma | Mean | Median | Sigma |
| A | 13 | 254 | 6063 | 53.91 | 503 | 493 | 103.3 |
| A | 3 | 137 | 4384 | 37.66 | 503 | 493 | 103.3 |
| A | 0 | 226 | 4285 | 36.7 | 503 | 493 | 103.3 |
| B | 0 | 228 | 33619 | 340.41 | 501 | 487 | 97.3 |
| B | 0 | 190 | 16220 | 161.65 | 501 | 487 | 97.3 |
| B | 12 | 111 | 11407 | 112.2 | 501 | 487 | 97.3 |
| C | 14 | 238 | 76556 | 664.3 | 484 | 487 | 114.5 |
| C | 13 | 61 | 3365 | 25.13 | 484 | 487 | 114.5 |
| C | 10 | 22 | 1628 | 9.96 | 484 | 487 | 114.5 |
| D | 1 | 52 | 425792 | 3573.73 | 489 | 475 | 119.0 |
| D | 2 | 234 | 22166 | 182.26 | 489 | 475 | 119.0 |
| D | 13 | 172 | 18555 | 151.92 | 489 | 475 | 119.0 |
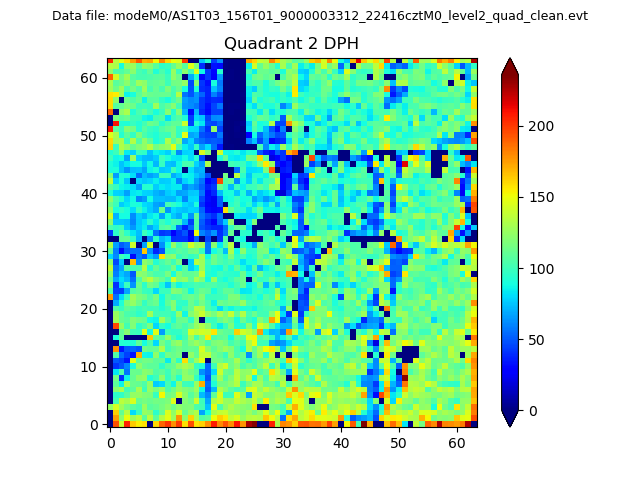
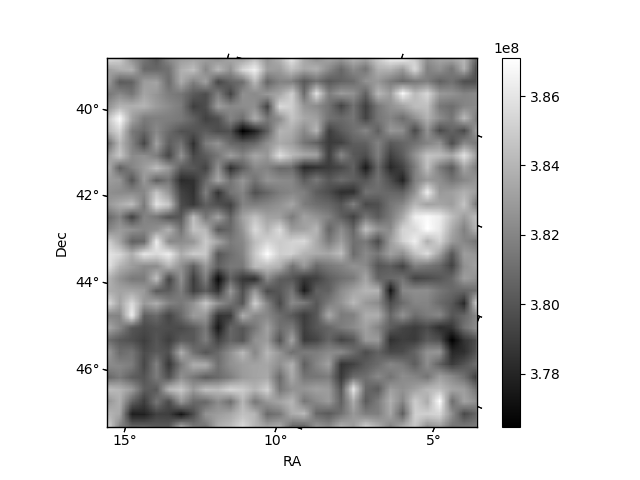
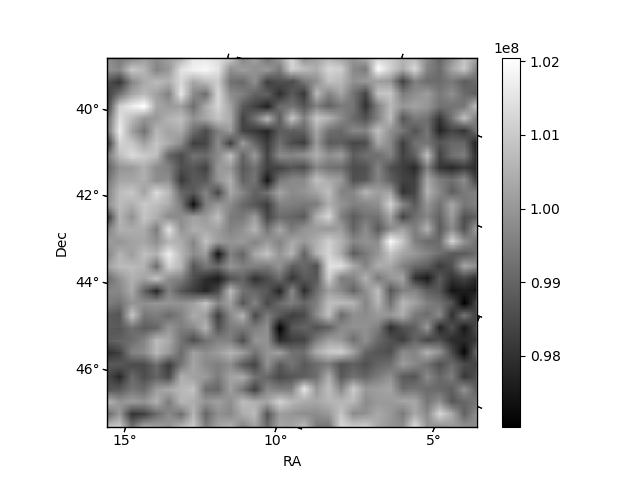
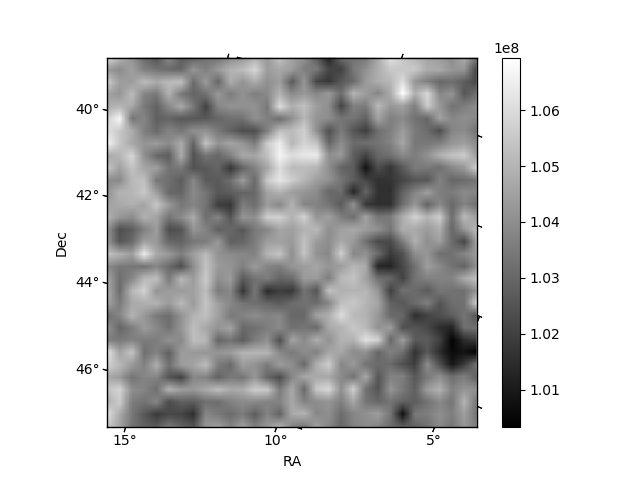
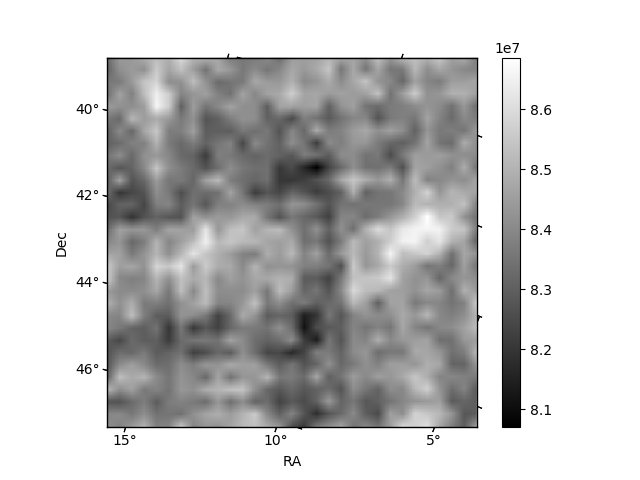
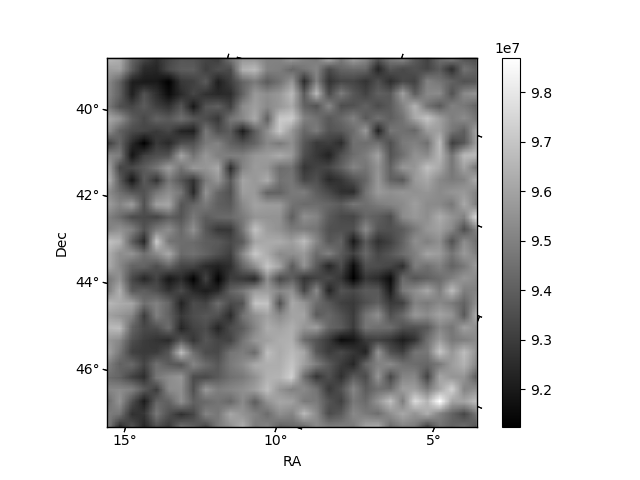
Histogram calculated using DETX and DETY for each event in the final _common_clean file
| Quadrant A | 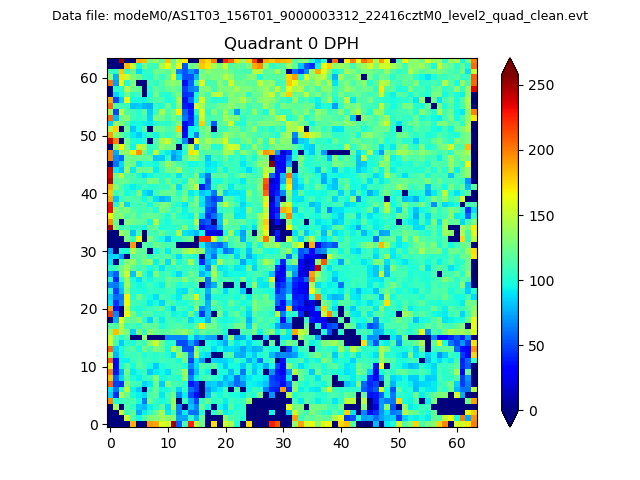 |
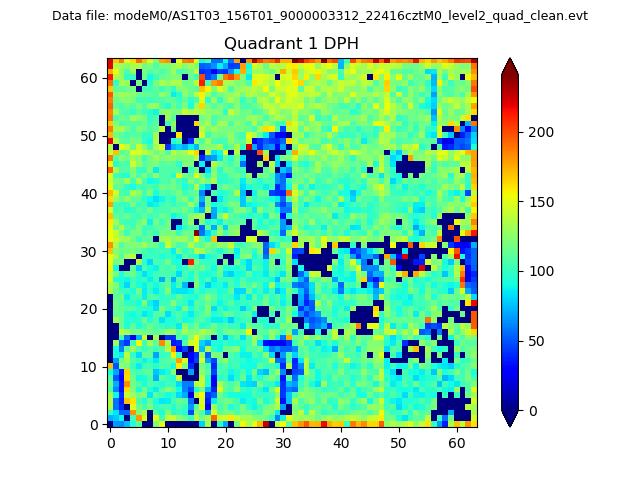 |
Quadrant B |
|---|---|---|---|
| Quadrant D | 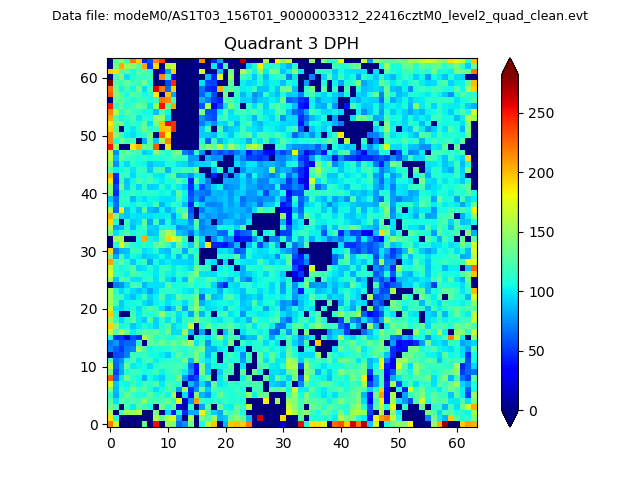 |
 |
Quadrant C |
| Plot type | Count rate plots | Images |
|---|---|---|
| Comparison with Poisson distribution Blue bars denote a histogram of data divided into 1 sec bins. Red curve is a Poisson curve with rate = median count rate of data. |
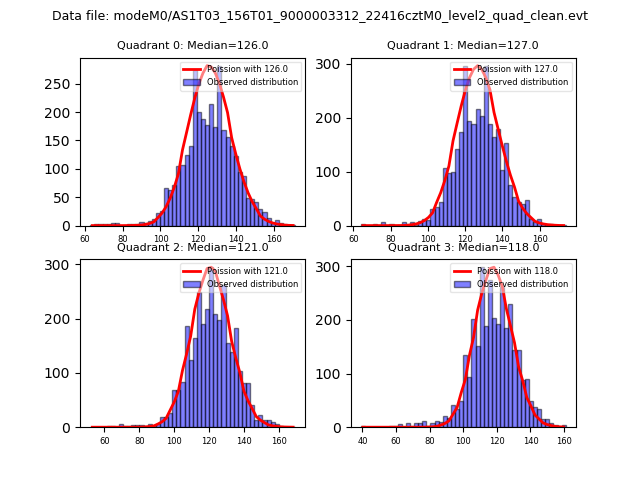 |
 |
| Quadrant-wise count rates Data is divided into 100 sec bins |
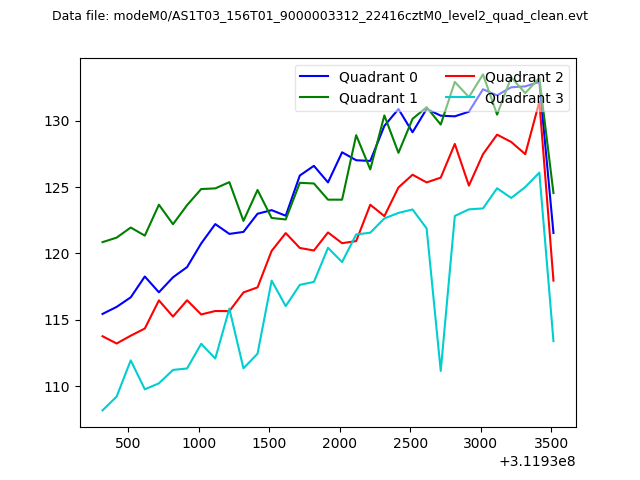 |
|
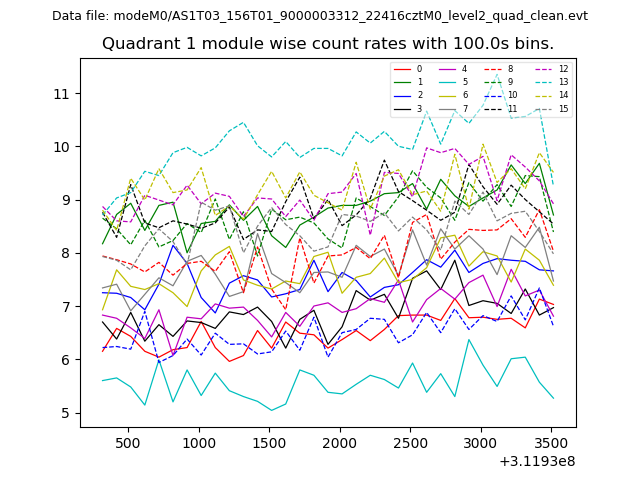
| Module-wise count rates for Quadrant A Data is divided into 100 sec bins |
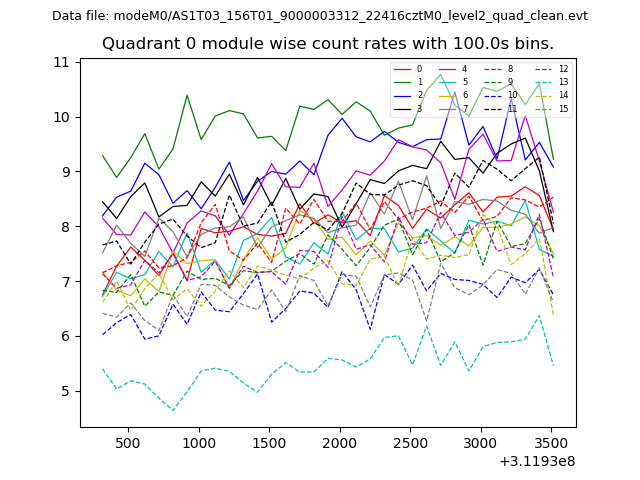 |
 |
| Module-wise count rates for Quadrant B Data is divided into 100 sec bins |
 |
 |
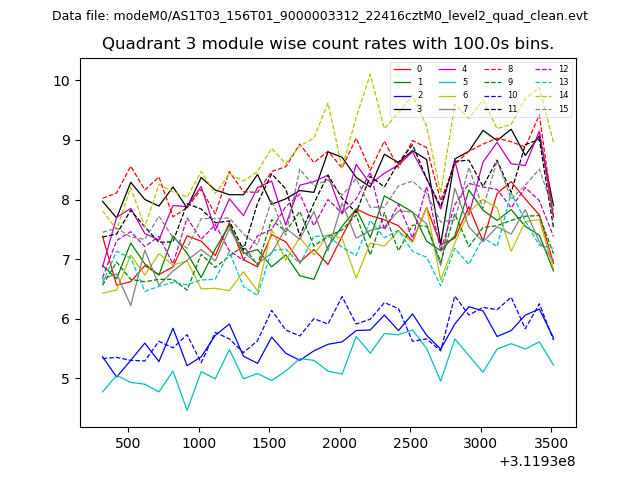
| Module-wise count rates for Quadrant C Data is divided into 100 sec bins |
 |
 |
| Module-wise count rates for Quadrant D Data is divided into 100 sec bins |
 |
 |
| Parameter | Plot |
|---|---|
| CZT HV Monitor |  |
| D_VDD | 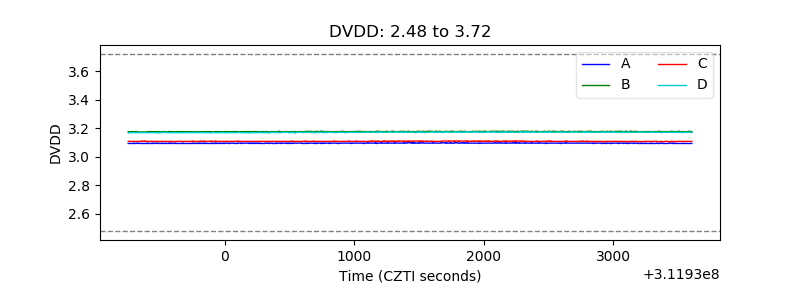 |
| Temperature 1 | 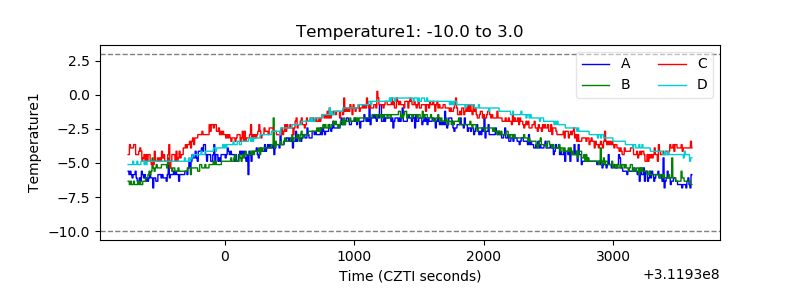 |
| Veto HV Monitor | 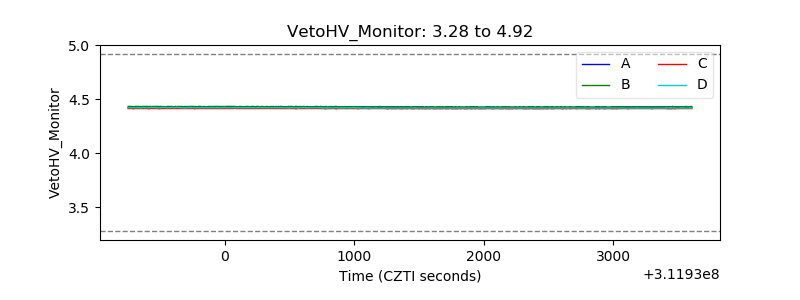 |
| Veto LLD | 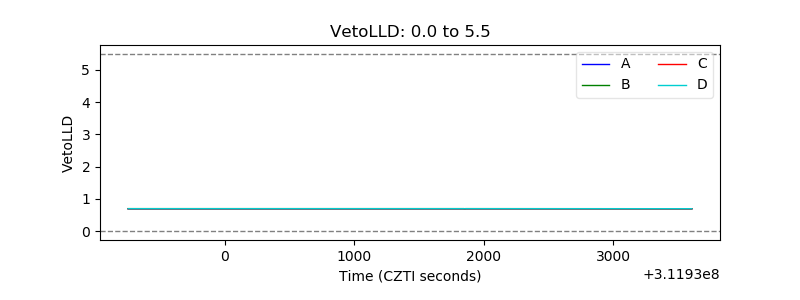 |
| Alpha Counter | 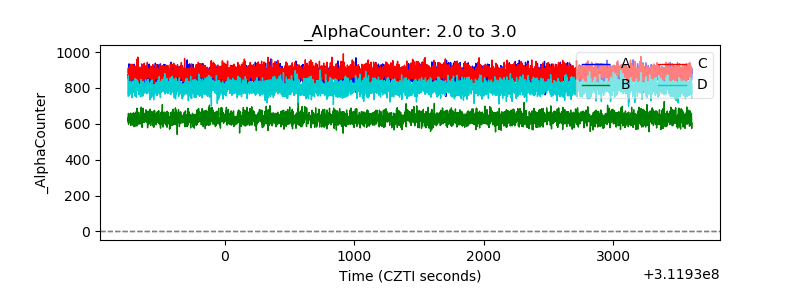 |
| _CPM_Rate | 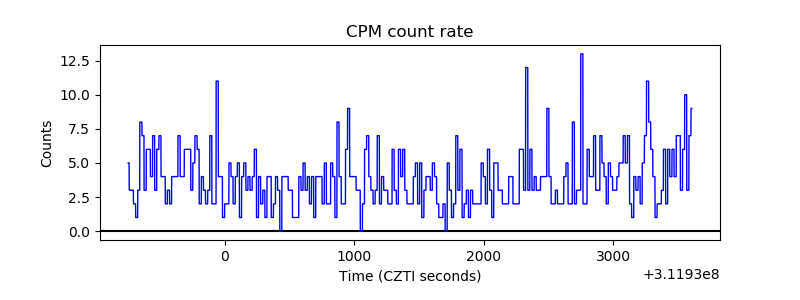 |
| CZT Counter | 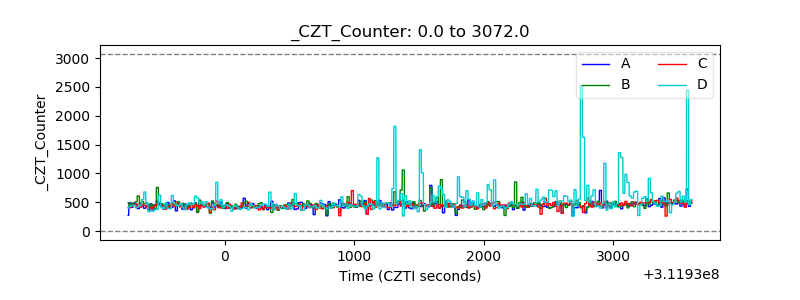 |
| +2.5 Volts monitor |  |
| +5 Volts monitor |  |
| _ROLL_ROT | 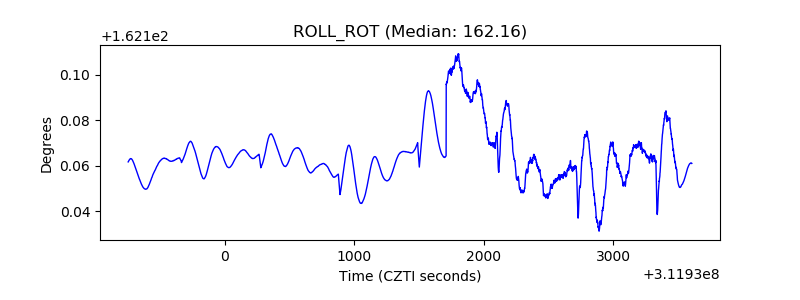 |
| _Roll_DEC | 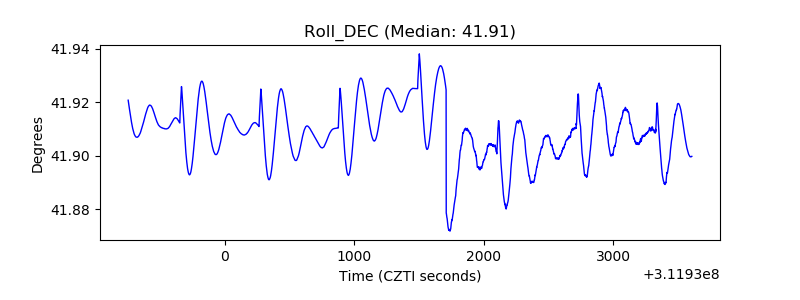 |
| _Roll_RA | 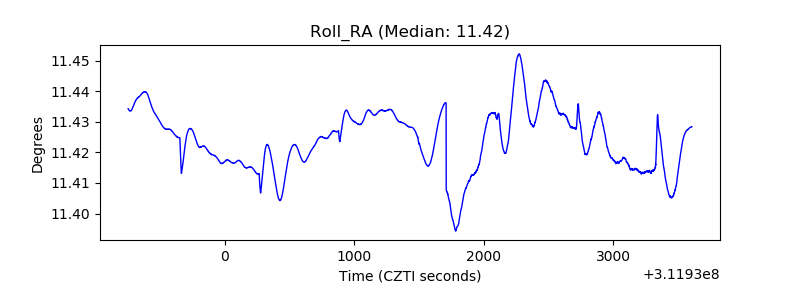 |
| Veto Counter | 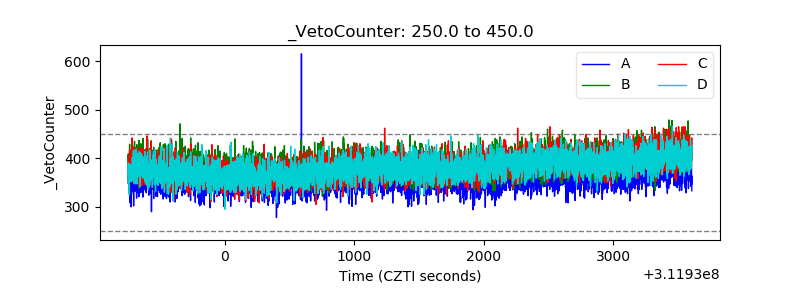 |