| Param | Original file | Final file |
|---|---|---|
| Filename | modeM0/AS1A07_007T03_9000003320cztM0_level2.fits | modeM0/AS1A07_007T03_9000003320cztM0_level2_quad_clean.evt |
| Size (bytes) | 266,071,680 | 132,552,000 |
| Size | 253.7 MB | 126.4 MB |
| Events in quadrant A | 1,659,576 | 584,565 |
| Events in quadrant B | 1,597,304 | 576,639 |
| Events in quadrant C | 1,617,324 | 553,105 |
| Events in quadrant D | 1,391,946 | 505,328 |
| Mode SS | |||
|---|---|---|---|
| Quadrant | BADHDUFLAG | Total packets | Discarded packets |
| A | 0 | 530 | 0 |
| B | 0 | 530 | 0 |
| C | 0 | 530 | 0 |
| D | 0 | 530 | 0 |
| Mode M9 | |||
|---|---|---|---|
| Quadrant | BADHDUFLAG | Total packets | Discarded packets |
| A | 0 | 60 | 0 |
| B | 0 | 60 | 0 |
| C | 0 | 60 | 0 |
| D | 0 | 60 | 0 |
| Mode M0 | |||
|---|---|---|---|
| Quadrant | BADHDUFLAG | Total packets | Discarded packets |
| A | 0 | 54416 | 0 |
| B | 0 | 55507 | 0 |
| C | 0 | 55163 | 0 |
| D | 0 | 65449 | 0 |
| Quadrant | Total seconds | Saturated seconds | Saturation percentage |
|---|---|---|---|
| A | 26062 | 207 | 0.794260% |
| B | 26062 | 223 | 0.855652% |
| C | 26062 | 411 | 1.577009% |
| D | 26062 | 902 | 3.460978% |
Noise dominated data is calculated using 1-second bins in cleaned event files. If a bin has >2000 counts, and if more than 50% of those come from <1% of pixels, then it is considered to be noise-dominated and hence unusable.
| Quadrant | # 1 sec bins | Bins with >0 counts | Bins with >2000 counts | High rate bins dominated by noise | Noise dominated (total time) | Noise dominated (detector-on time) | Marked lightcurve |
|---|---|---|---|---|---|---|---|
| A | 32037 | 26060 | 0 | 0 | 0.00% | 0.00% |  |
| B | 32037 | 26061 | 0 | 0 | 0.00% | 0.00% | 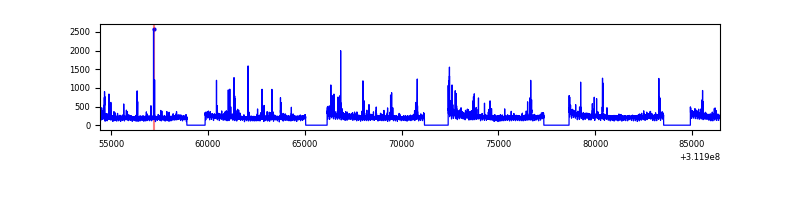 |
| C | 32037 | 26058 | 0 | 0 | 0.00% | 0.00% |  |
| D | 32037 | 26052 | 0 | 0 | 0.00% | 0.00% | 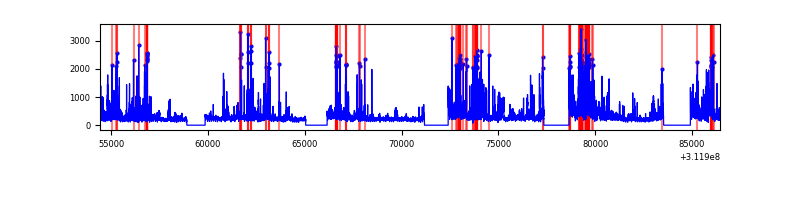 |
Top three noisy pixels from each quadrant. If the there are fewer than three noisy pixels in the level2.evt file, extra rows are filled as -1
| Pixel properties | Quadrant properties | ||||||
|---|---|---|---|---|---|---|---|
| Quadrant | DetID | PixID | Counts | Sigma | Mean | Median | Sigma |
| A | 0 | 29 | 1625 | 11.48 | 431 | 409 | 105.9 |
| A | 7 | 110 | 1353 | 8.91 | 431 | 409 | 105.9 |
| A | 0 | 30 | 1259 | 8.03 | 431 | 409 | 105.9 |
| B | 2 | 9 | 1262 | 10.24 | 422 | 405 | 83.7 |
| B | 5 | 128 | 1084 | 8.11 | 422 | 405 | 83.7 |
| B | 2 | 8 | 1052 | 7.73 | 422 | 405 | 83.7 |
| C | 12 | 241 | 1111 | 6.49 | 427 | 403 | 109.1 |
| C | 9 | 209 | 1104 | 6.42 | 427 | 403 | 109.1 |
| C | 3 | 234 | 1074 | 6.15 | 427 | 403 | 109.1 |
| D | 15 | 46 | 1033 | 6.23 | 397 | 362 | 107.7 |
| D | 6 | 231 | 1019 | 6.1 | 397 | 362 | 107.7 |
| D | 10 | 189 | 1012 | 6.04 | 397 | 362 | 107.7 |
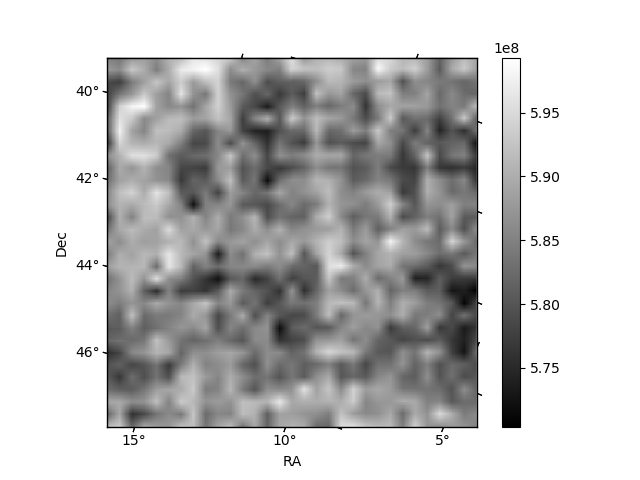
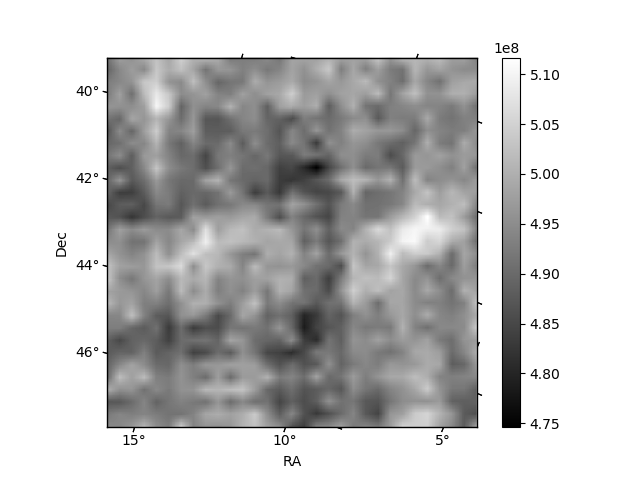
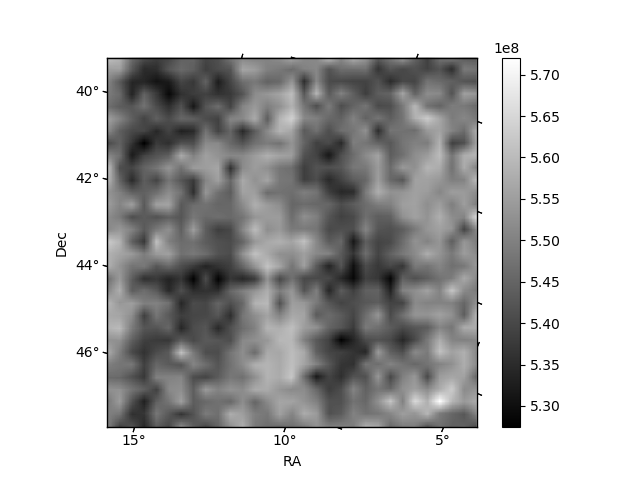
Histogram calculated using DETX and DETY for each event in the final _common_clean file
| Quadrant A |  |
 |
Quadrant B |
|---|---|---|---|
| Quadrant D |  |
 |
Quadrant C |
| Plot type | Count rate plots | Images |
|---|---|---|
| Comparison with Poisson distribution Blue bars denote a histogram of data divided into 1 sec bins. Red curve is a Poisson curve with rate = median count rate of data. |
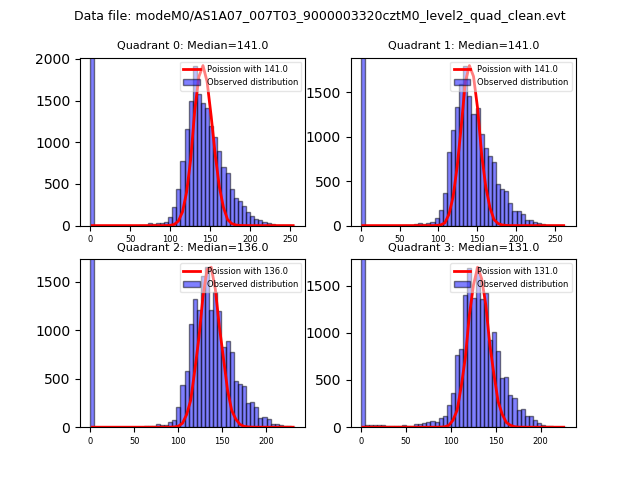 |
 |
| Quadrant-wise count rates Data is divided into 100 sec bins |
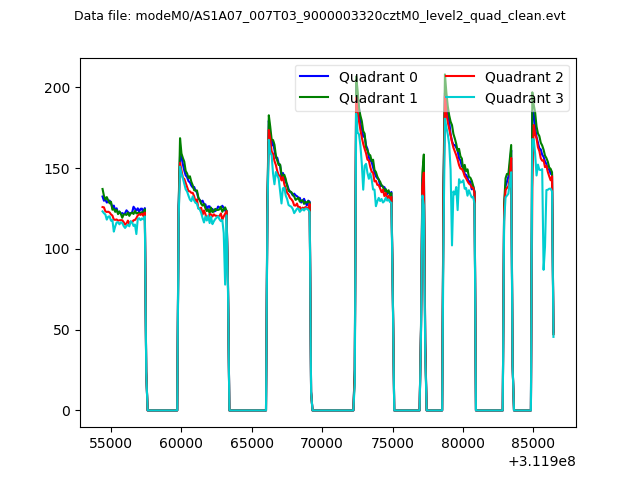 |
|
| Module-wise count rates for Quadrant A Data is divided into 100 sec bins |
 |
 |
| Module-wise count rates for Quadrant B Data is divided into 100 sec bins |
 |
 |
| Module-wise count rates for Quadrant C Data is divided into 100 sec bins |
 |
 |
| Module-wise count rates for Quadrant D Data is divided into 100 sec bins |
 |
 |
| Parameter | Plot |
|---|---|
| CZT HV Monitor |  |
| D_VDD | 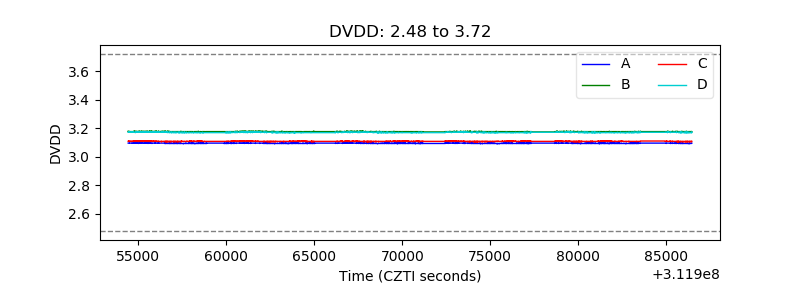 |
| Temperature 1 | 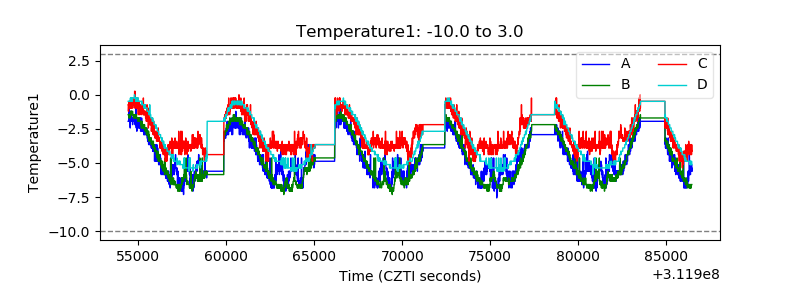 |
| Veto HV Monitor |  |
| Veto LLD |  |
| Alpha Counter |  |
| _CPM_Rate | 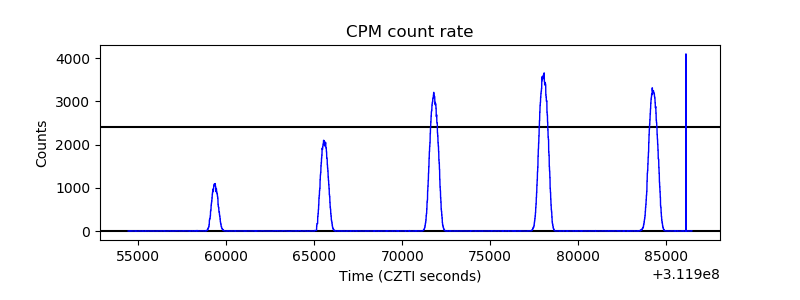 |
| CZT Counter |  |
| +2.5 Volts monitor |  |
| +5 Volts monitor |  |
| _ROLL_ROT |  |
| _Roll_DEC |  |
| _Roll_RA | 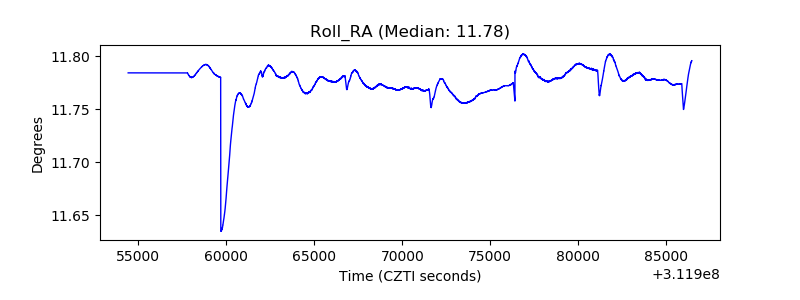 |
| Veto Counter |  |