| Param | Original file | Final file |
|---|---|---|
| Filename | modeM0/AS1A07_007T03_9000003320_22415cztM0_level2.evt | modeM0/AS1A07_007T03_9000003320_22415cztM0_level2_quad_clean.evt |
| Size (bytes) | 52,335,360 | 13,933,440 |
| Size | 49.9 MB | 13.3 MB |
| Events in quadrant A | 347,136 | 93,198 |
| Events in quadrant B | 386,614 | 94,360 |
| Events in quadrant C | 377,591 | 88,758 |
| Events in quadrant D | 421,327 | 87,101 |
| Mode SS | |||
|---|---|---|---|
| Quadrant | BADHDUFLAG | Total packets | Discarded packets |
| A | 0 | 14 | 0 |
| B | 0 | 14 | 0 |
| C | 0 | 14 | 0 |
| D | 0 | 14 | 0 |
| Mode M0 | |||
|---|---|---|---|
| Quadrant | BADHDUFLAG | Total packets | Discarded packets |
| A | 0 | 1455 | 0 |
| B | 0 | 1576 | 0 |
| C | 0 | 1552 | 0 |
| D | 0 | 1660 | 2 |
| Quadrant | Total seconds | Saturated seconds | Saturation percentage |
|---|---|---|---|
| A | 722 | 2 | 0.277008% |
| B | 722 | 1 | 0.138504% |
| C | 722 | 8 | 1.108033% |
| D | 721 | 3 | 0.416089% |
Noise dominated data is calculated using 1-second bins in cleaned event files. If a bin has >2000 counts, and if more than 50% of those come from <1% of pixels, then it is considered to be noise-dominated and hence unusable.
| Quadrant | # 1 sec bins | Bins with >0 counts | Bins with >2000 counts | High rate bins dominated by noise | Noise dominated (total time) | Noise dominated (detector-on time) | Marked lightcurve |
|---|---|---|---|---|---|---|---|
| A | 722 | 722 | 0 | 0 | 0.00% | 0.00% | 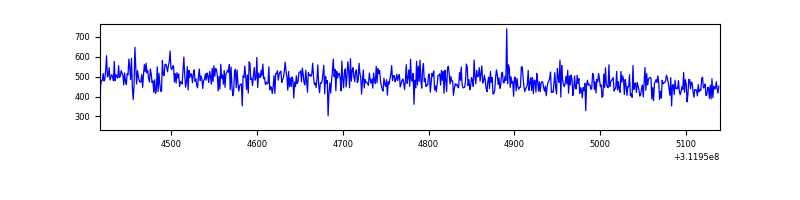 |
| B | 722 | 722 | 0 | 0 | 0.00% | 0.00% | 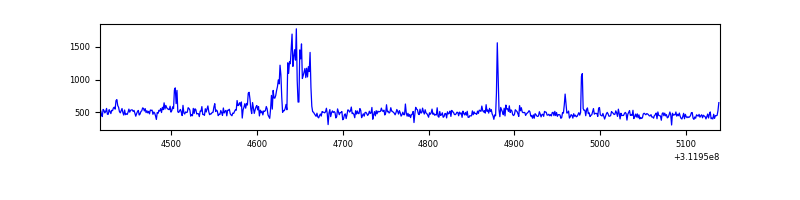 |
| C | 722 | 722 | 0 | 0 | 0.00% | 0.00% | 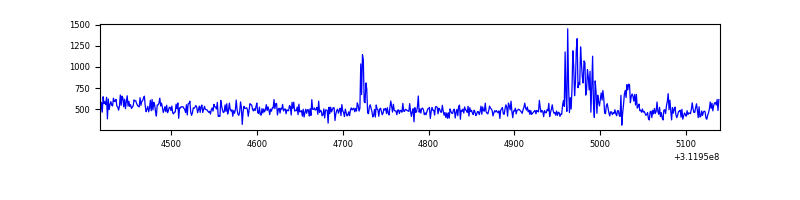 |
| D | 721 | 721 | 4 | 4 | 0.55% | 0.55% |  |
Top three noisy pixels from each quadrant. If the there are fewer than three noisy pixels in the level2.evt file, extra rows are filled as -1
| Pixel properties | Quadrant properties | ||||||
|---|---|---|---|---|---|---|---|
| Quadrant | DetID | PixID | Counts | Sigma | Mean | Median | Sigma |
| A | 13 | 254 | 1037 | 46.81 | 90 | 87 | 20.3 |
| A | 0 | 226 | 786 | 34.44 | 90 | 87 | 20.3 |
| A | 3 | 137 | 748 | 32.56 | 90 | 87 | 20.3 |
| B | 0 | 190 | 32143 | 1712.47 | 88 | 86 | 18.7 |
| B | 0 | 228 | 6086 | 320.52 | 88 | 86 | 18.7 |
| B | 0 | 229 | 2928 | 151.82 | 88 | 86 | 18.7 |
| C | 9 | 54 | 19045 | 850.31 | 84 | 84 | 22.3 |
| C | 14 | 238 | 13591 | 605.73 | 84 | 84 | 22.3 |
| C | 1 | 16 | 11127 | 495.23 | 84 | 84 | 22.3 |
| D | 1 | 52 | 48448 | 2075.86 | 87 | 84 | 23.3 |
| D | 12 | 227 | 18478 | 789.5 | 87 | 84 | 23.3 |
| D | 13 | 249 | 6992 | 296.5 | 87 | 84 | 23.3 |
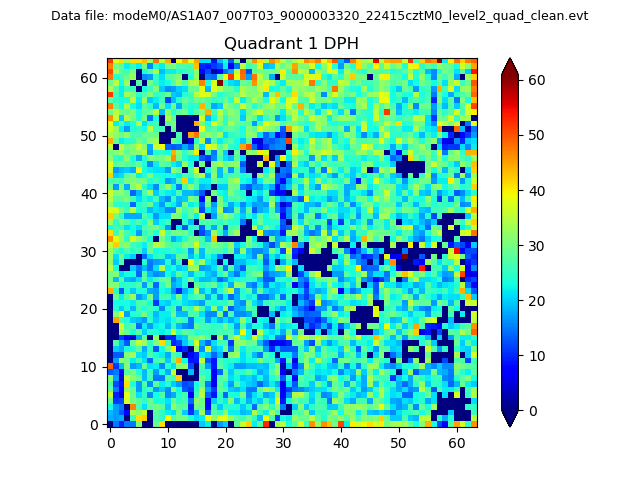
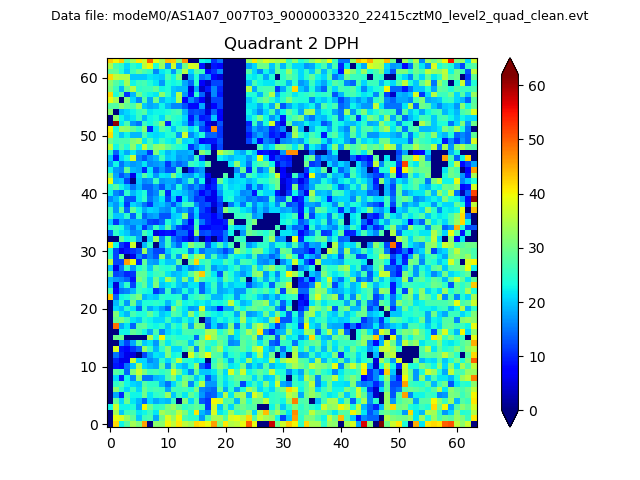
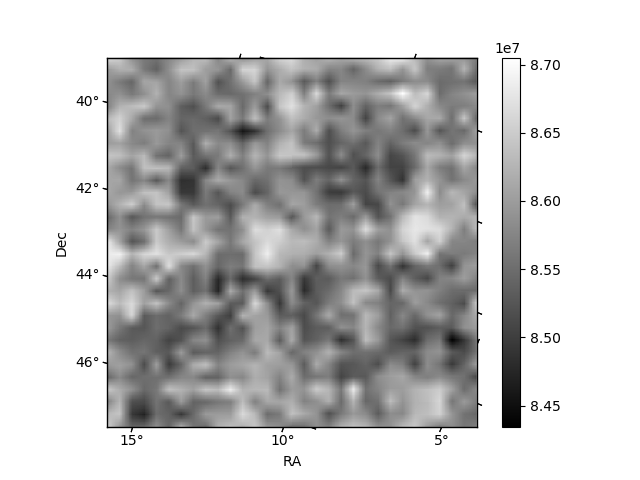
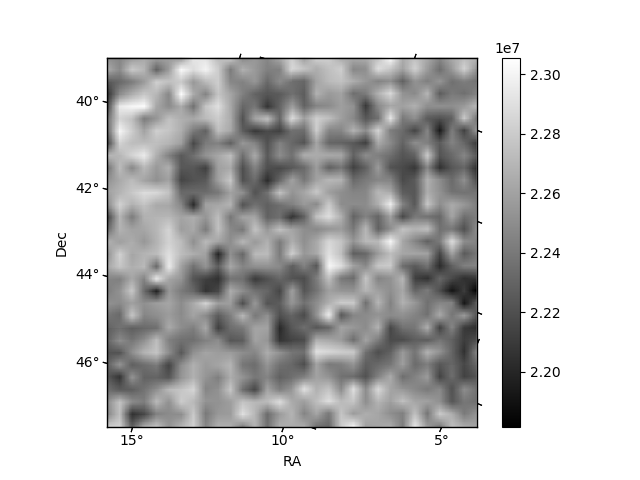
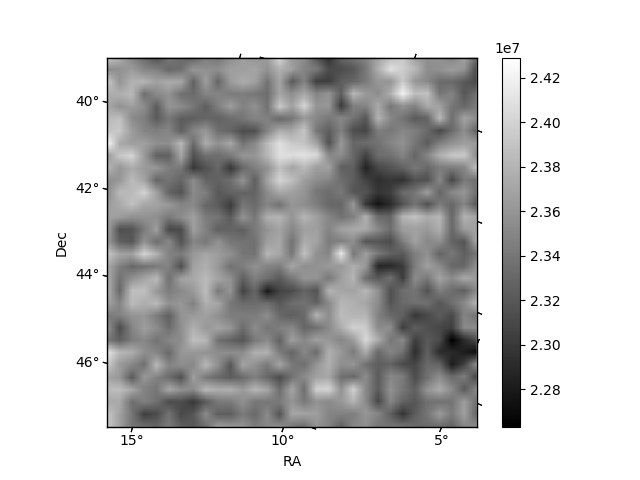
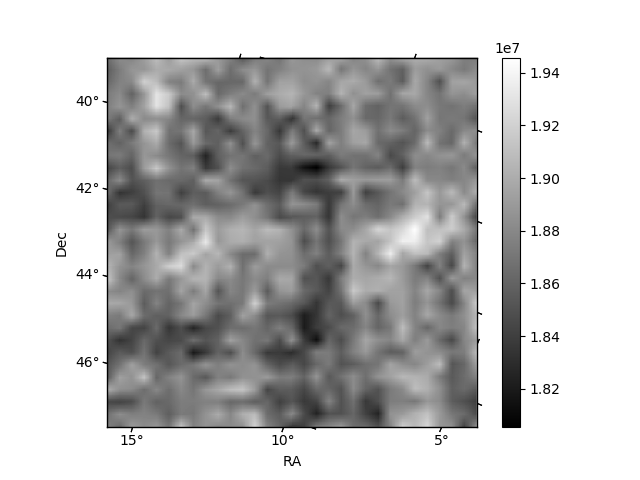
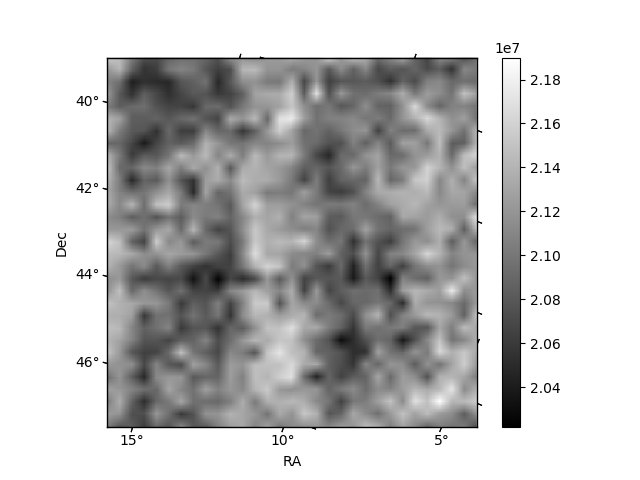
Histogram calculated using DETX and DETY for each event in the final _common_clean file
| Quadrant A | 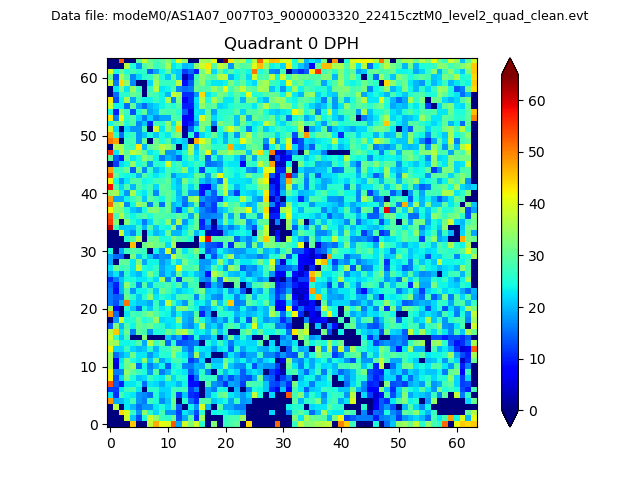 |
 |
Quadrant B |
|---|---|---|---|
| Quadrant D | 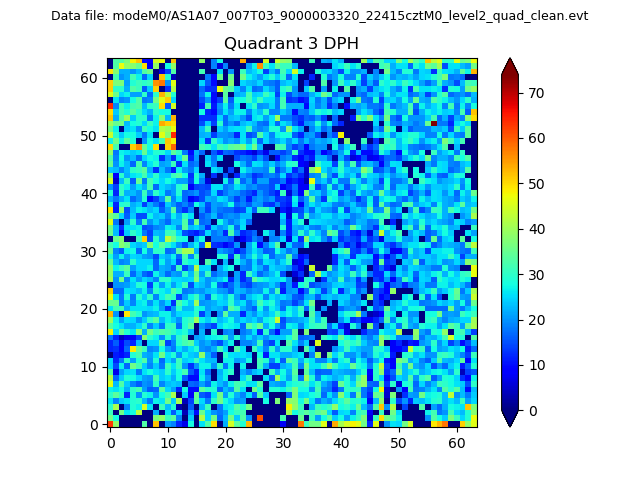 |
 |
Quadrant C |
| Plot type | Count rate plots | Images |
|---|---|---|
| Comparison with Poisson distribution Blue bars denote a histogram of data divided into 1 sec bins. Red curve is a Poisson curve with rate = median count rate of data. |
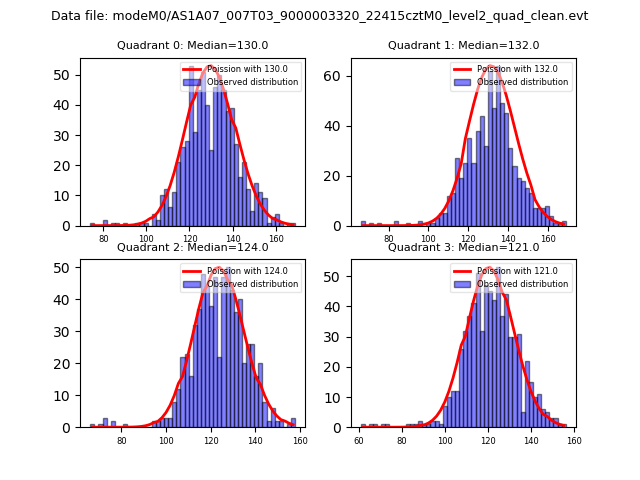 |
 |
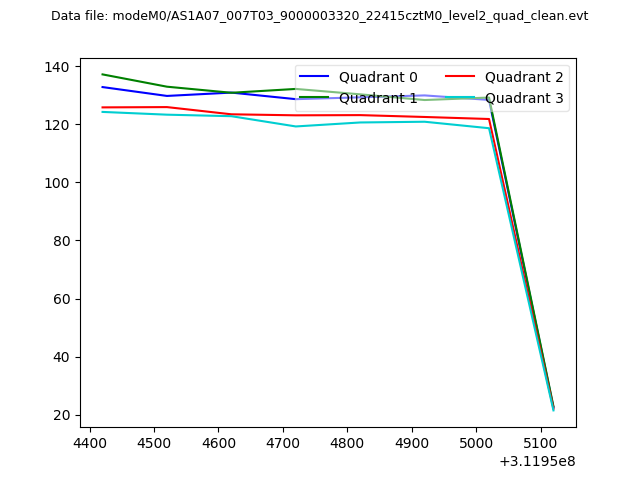
| Quadrant-wise count rates Data is divided into 100 sec bins |
 |
|
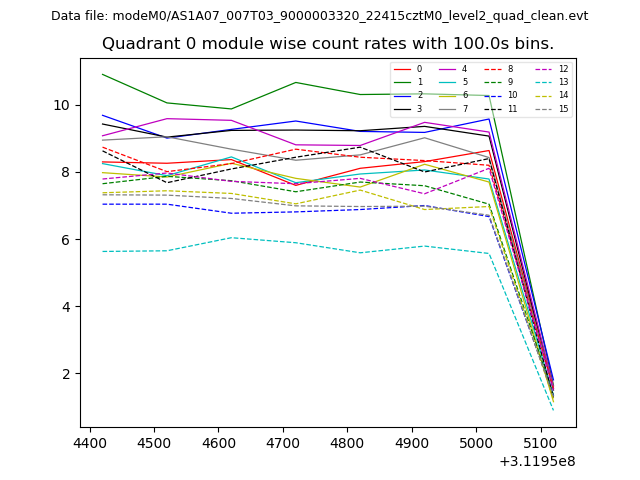
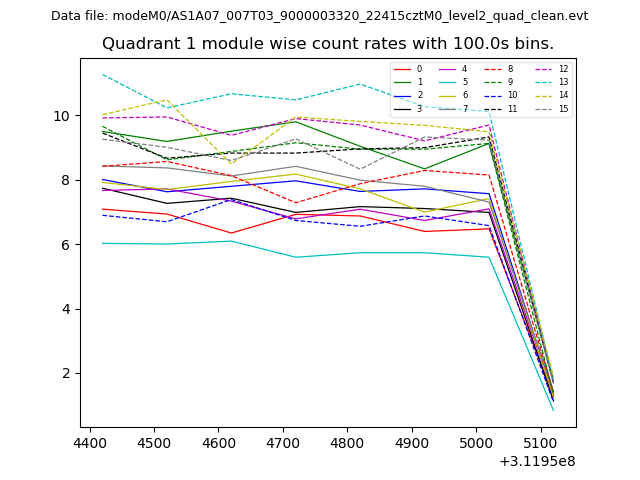
| Module-wise count rates for Quadrant A Data is divided into 100 sec bins |
 |
 |
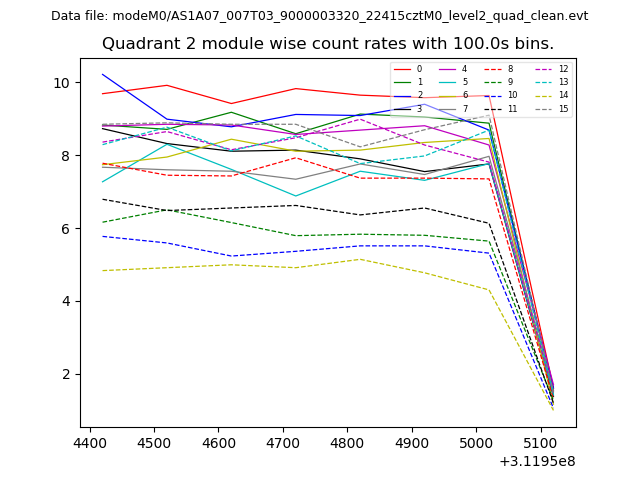
| Module-wise count rates for Quadrant B Data is divided into 100 sec bins |
 |
 |
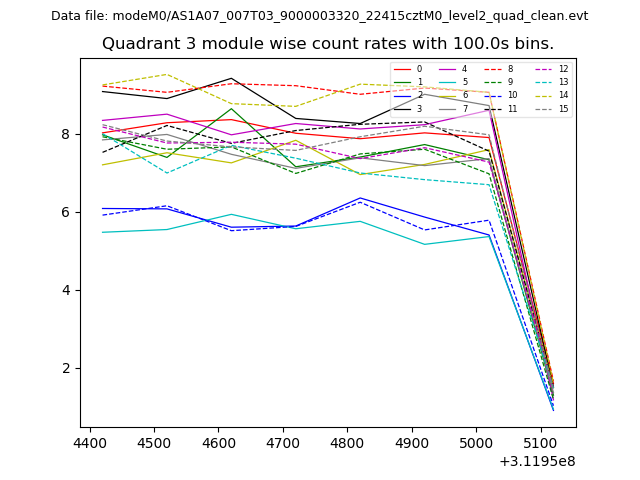
| Module-wise count rates for Quadrant C Data is divided into 100 sec bins |
 |
 |
| Module-wise count rates for Quadrant D Data is divided into 100 sec bins |
 |
 |
| Parameter | Plot |
|---|---|
| CZT HV Monitor | 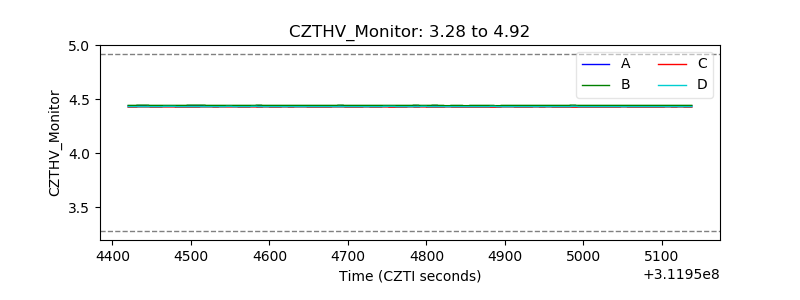 |
| D_VDD | 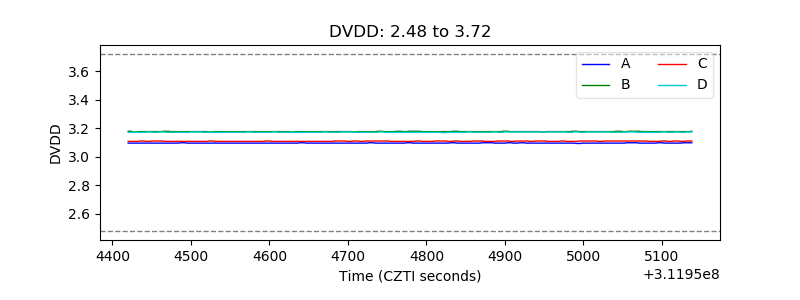 |
| Temperature 1 | 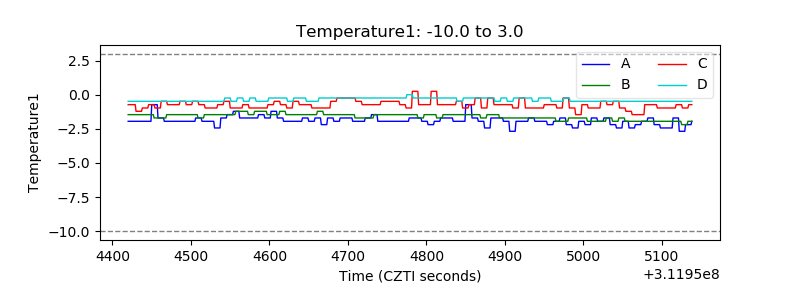 |
| Veto HV Monitor | 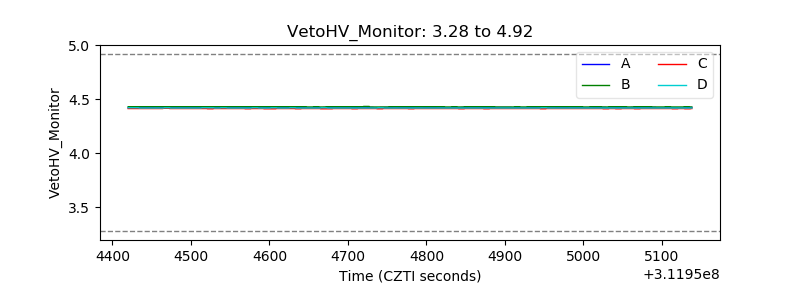 |
| Veto LLD | 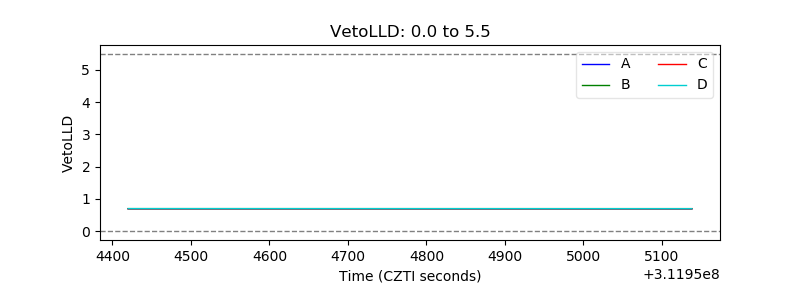 |
| Alpha Counter | 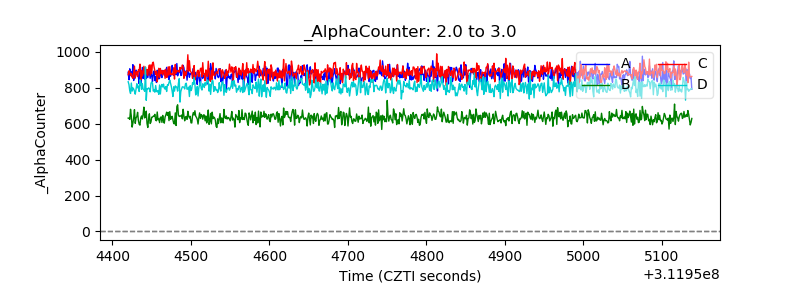 |
| _CPM_Rate | 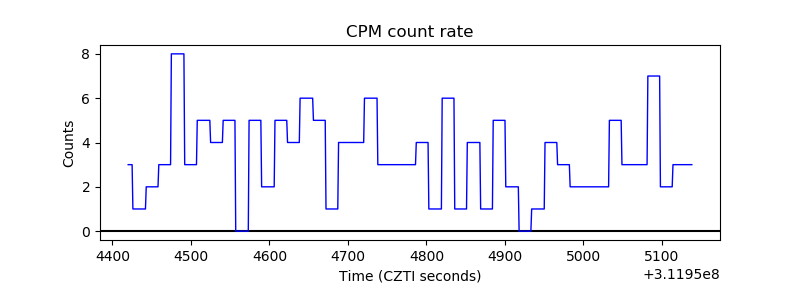 |
| CZT Counter | 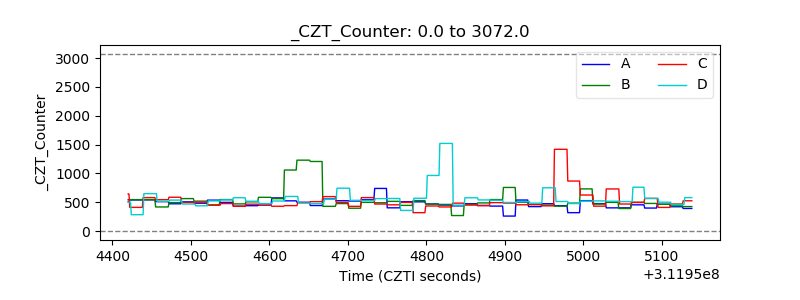 |
| +2.5 Volts monitor |  |
| +5 Volts monitor |  |
| _ROLL_ROT | 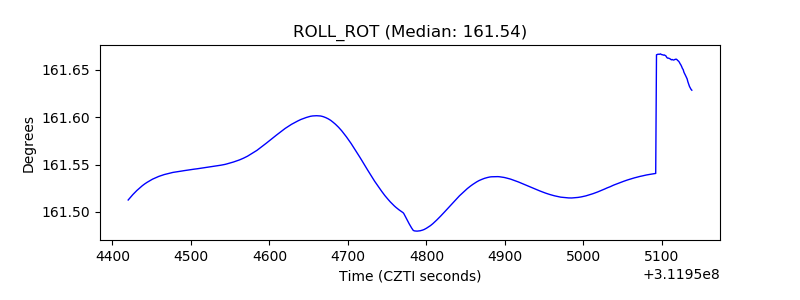 |
| _Roll_DEC | 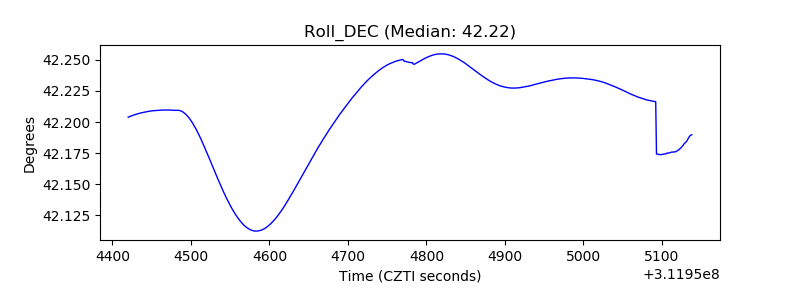 |
| _Roll_RA |  |
| Veto Counter | 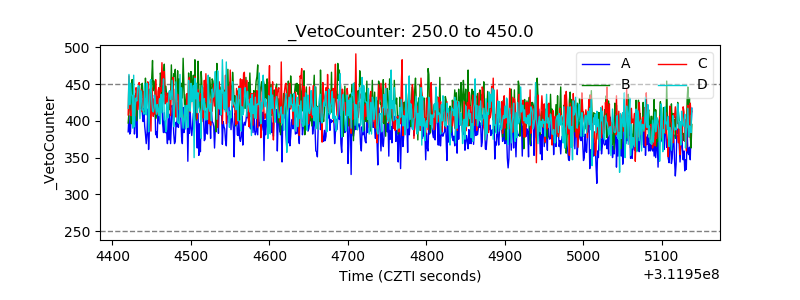 |