| Param | Original file | Final file |
|---|---|---|
| Filename | modeM0/AS1A07_007T03_9000003320_22416cztM0_level2.evt | modeM0/AS1A07_007T03_9000003320_22416cztM0_level2_quad_clean.evt |
| Size (bytes) | 402,958,080 | 92,039,040 |
| Size | 384.3 MB | 87.8 MB |
| Events in quadrant A | 2,789,066 | 607,439 |
| Events in quadrant B | 2,905,679 | 610,508 |
| Events in quadrant C | 2,887,774 | 581,098 |
| Events in quadrant D | 3,213,607 | 570,039 |
| Mode SS | |||
|---|---|---|---|
| Quadrant | BADHDUFLAG | Total packets | Discarded packets |
| A | 0 | 122 | 0 |
| B | 0 | 122 | 0 |
| C | 0 | 122 | 0 |
| D | 0 | 122 | 0 |
| Mode M9 | |||
|---|---|---|---|
| Quadrant | BADHDUFLAG | Total packets | Discarded packets |
| A | 0 | 9 | 0 |
| B | 0 | 9 | 0 |
| C | 0 | 9 | 0 |
| D | 0 | 9 | 0 |
| Mode M0 | |||
|---|---|---|---|
| Quadrant | BADHDUFLAG | Total packets | Discarded packets |
| A | 0 | 12356 | 1 |
| B | 0 | 12617 | 1 |
| C | 0 | 12490 | 1 |
| D | 0 | 13454 | 1 |
| Quadrant | Total seconds | Saturated seconds | Saturation percentage |
|---|---|---|---|
| A | 5987 | 57 | 0.952063% |
| B | 5987 | 53 | 0.885251% |
| C | 5987 | 77 | 1.286120% |
| D | 5987 | 85 | 1.419743% |
Noise dominated data is calculated using 1-second bins in cleaned event files. If a bin has >2000 counts, and if more than 50% of those come from <1% of pixels, then it is considered to be noise-dominated and hence unusable.
| Quadrant | # 1 sec bins | Bins with >0 counts | Bins with >2000 counts | High rate bins dominated by noise | Noise dominated (total time) | Noise dominated (detector-on time) | Marked lightcurve |
|---|---|---|---|---|---|---|---|
| A | 6932 | 5987 | 0 | 0 | 0.00% | 0.00% | 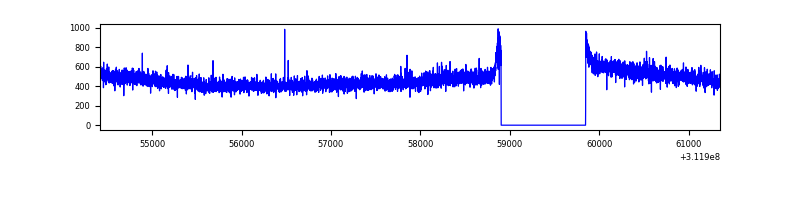 |
| B | 6932 | 5987 | 5 | 5 | 0.07% | 0.08% | 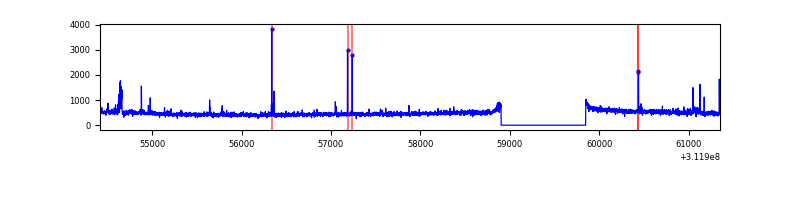 |
| C | 6932 | 5987 | 0 | 0 | 0.00% | 0.00% | 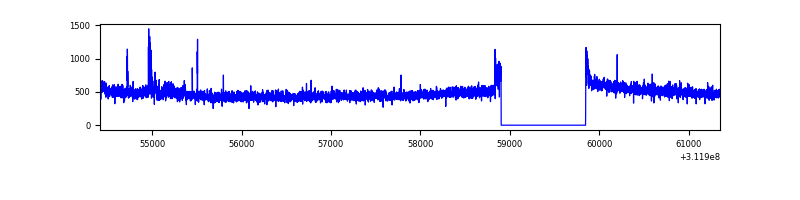 |
| D | 6932 | 5987 | 47 | 47 | 0.68% | 0.79% | 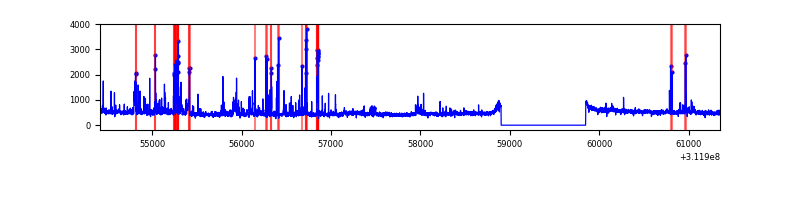 |
Top three noisy pixels from each quadrant. If the there are fewer than three noisy pixels in the level2.evt file, extra rows are filled as -1
| Pixel properties | Quadrant properties | ||||||
|---|---|---|---|---|---|---|---|
| Quadrant | DetID | PixID | Counts | Sigma | Mean | Median | Sigma |
| A | 13 | 254 | 8511 | 53.3 | 722 | 706 | 146.4 |
| A | 3 | 137 | 6120 | 36.97 | 722 | 706 | 146.4 |
| A | 0 | 226 | 6088 | 36.75 | 722 | 706 | 146.4 |
| B | 0 | 190 | 54763 | 397.08 | 716 | 699 | 136.2 |
| B | 0 | 228 | 20614 | 146.27 | 716 | 699 | 136.2 |
| B | 12 | 111 | 16324 | 114.76 | 716 | 699 | 136.2 |
| C | 14 | 238 | 109916 | 669.05 | 694 | 698 | 163.2 |
| C | 1 | 16 | 41584 | 250.46 | 694 | 698 | 163.2 |
| C | 9 | 54 | 25719 | 153.27 | 694 | 698 | 163.2 |
| D | 1 | 52 | 271195 | 1594.64 | 703 | 683 | 169.6 |
| D | 13 | 249 | 160069 | 939.56 | 703 | 683 | 169.6 |
| D | 12 | 227 | 38281 | 221.64 | 703 | 683 | 169.6 |
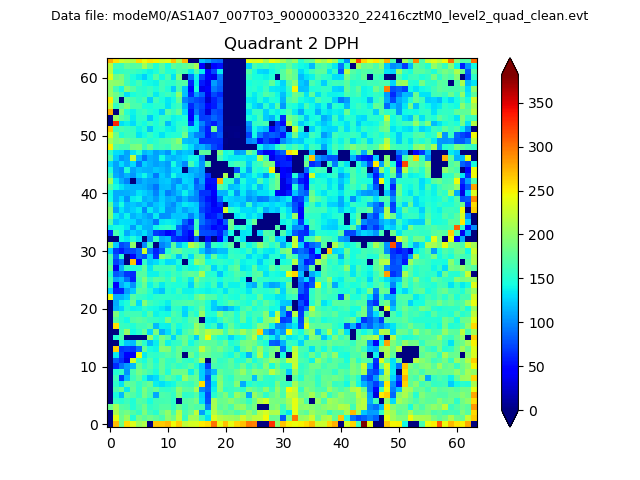
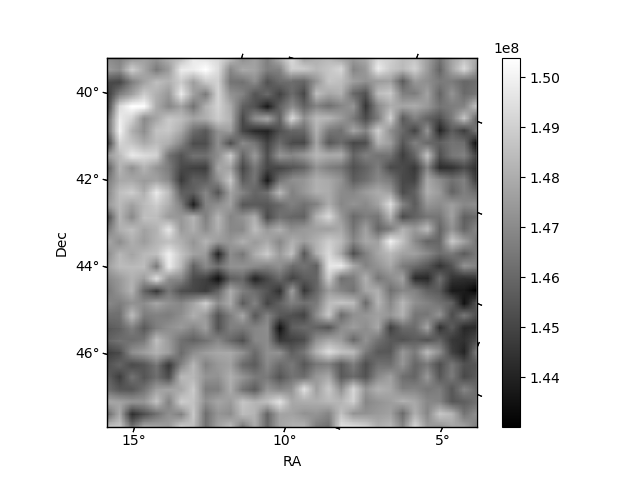
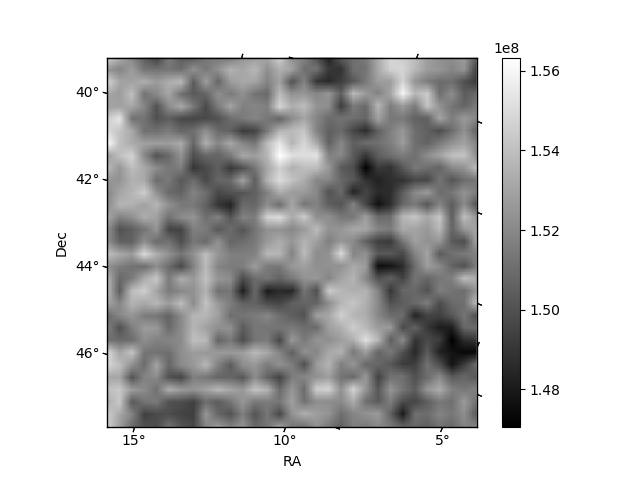
Histogram calculated using DETX and DETY for each event in the final _common_clean file
| Quadrant A | 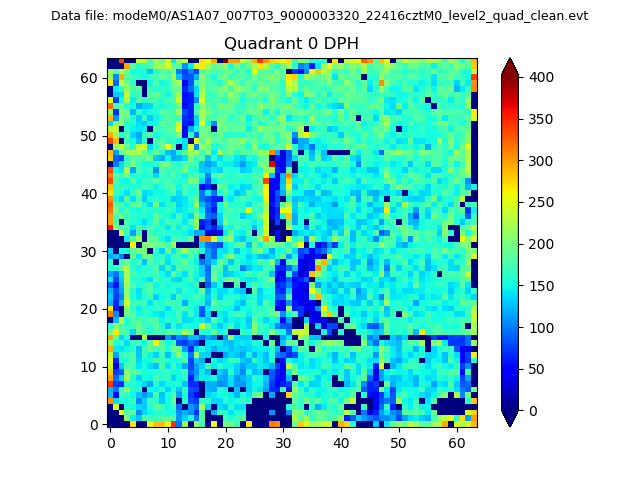 |
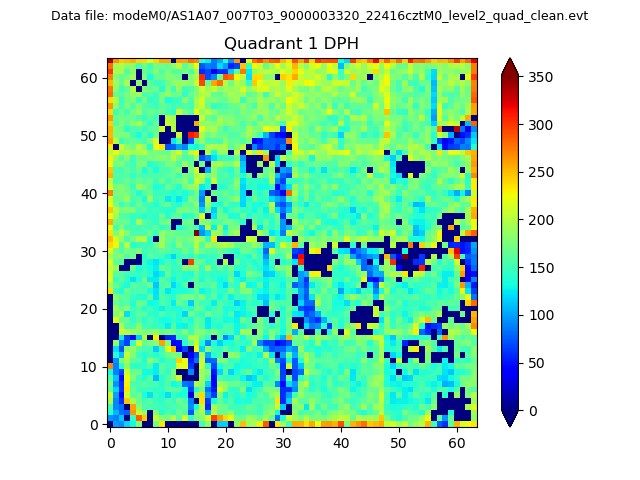 |
Quadrant B |
|---|---|---|---|
| Quadrant D | 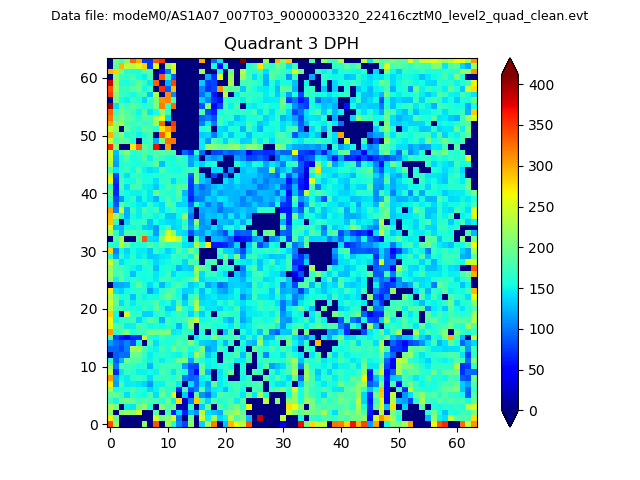 |
 |
Quadrant C |
| Plot type | Count rate plots | Images |
|---|---|---|
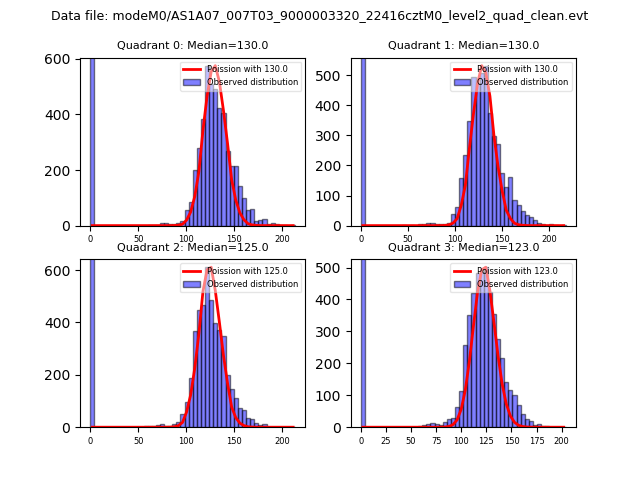
| Comparison with Poisson distribution Blue bars denote a histogram of data divided into 1 sec bins. Red curve is a Poisson curve with rate = median count rate of data. |
 |
 |
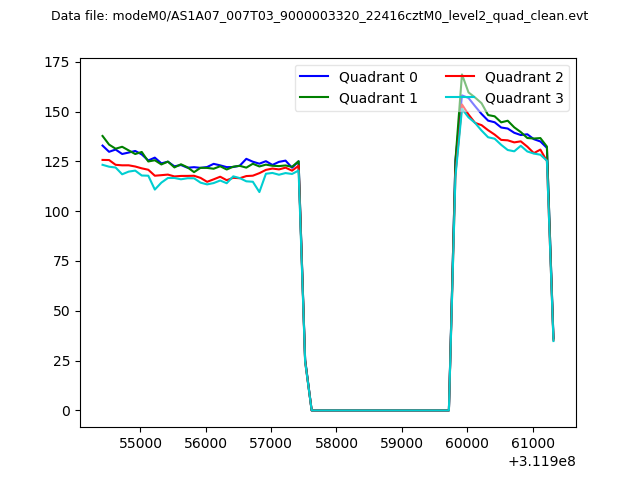
| Quadrant-wise count rates Data is divided into 100 sec bins |
 |
|
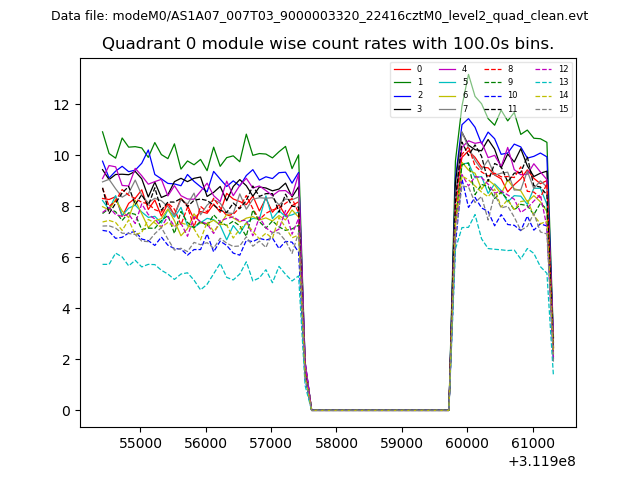
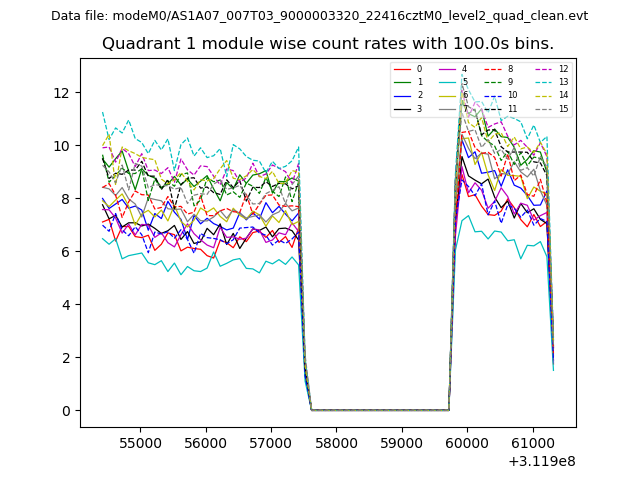
| Module-wise count rates for Quadrant A Data is divided into 100 sec bins |
 |
 |
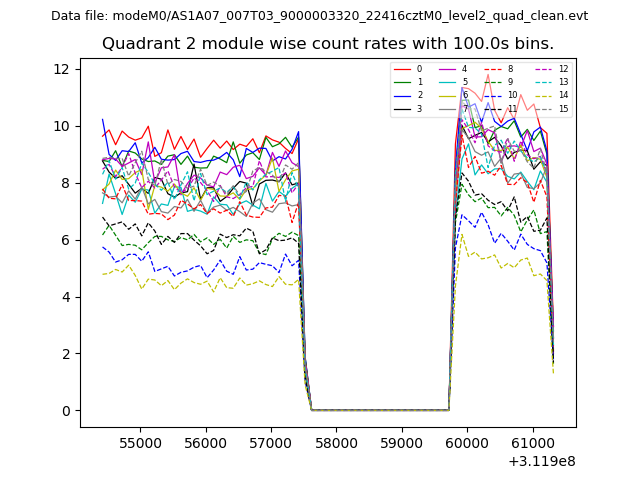
| Module-wise count rates for Quadrant B Data is divided into 100 sec bins |
 |
 |
| Module-wise count rates for Quadrant C Data is divided into 100 sec bins |
 |
 |
| Module-wise count rates for Quadrant D Data is divided into 100 sec bins |
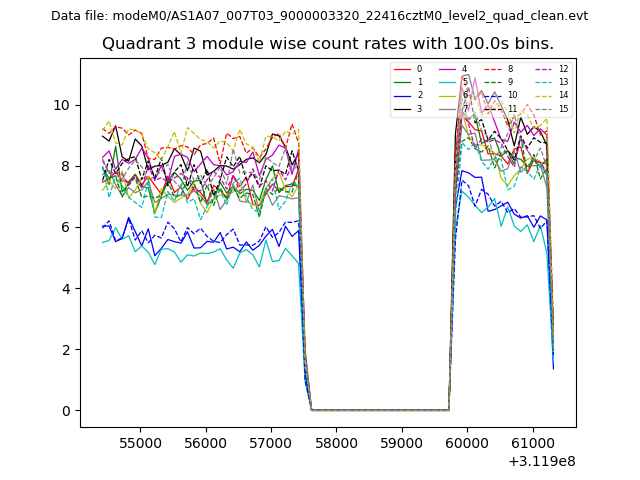 |
 |
| Parameter | Plot |
|---|---|
| CZT HV Monitor | 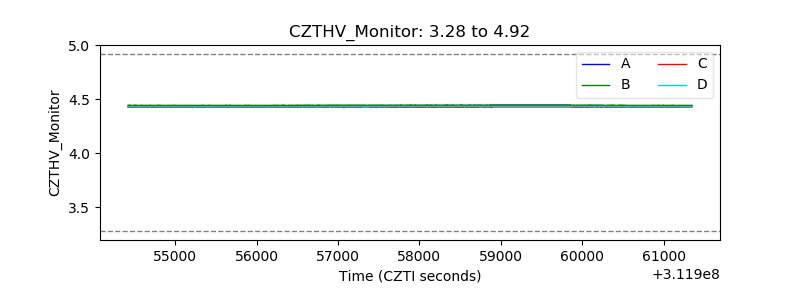 |
| D_VDD |  |
| Temperature 1 | 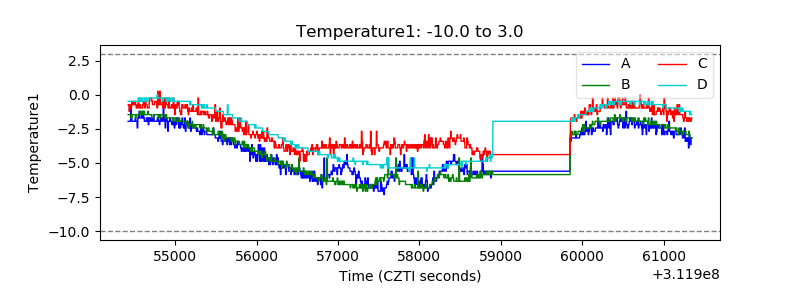 |
| Veto HV Monitor |  |
| Veto LLD | 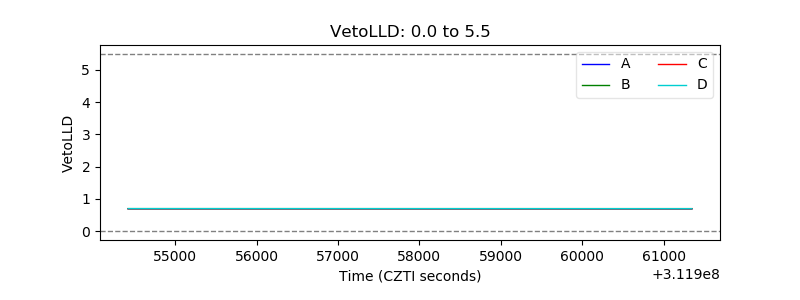 |
| Alpha Counter | 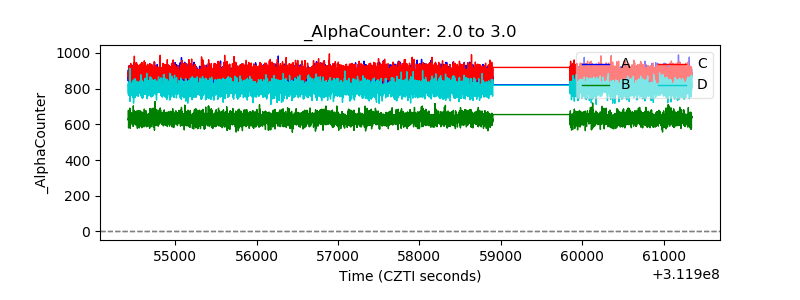 |
| _CPM_Rate | 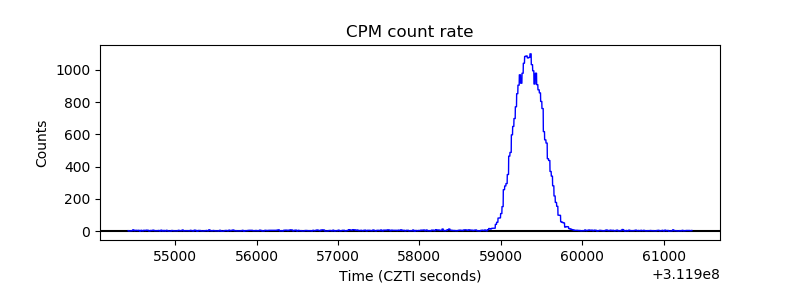 |
| CZT Counter | 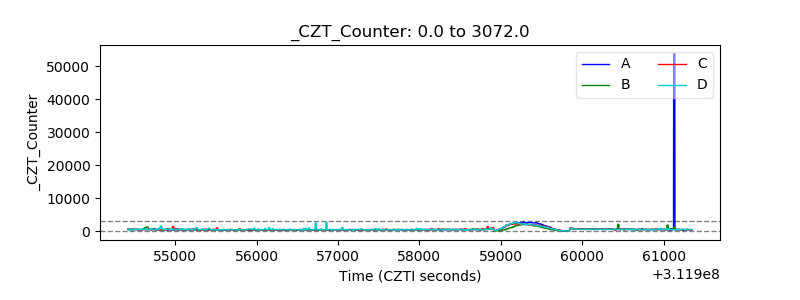 |
| +2.5 Volts monitor | 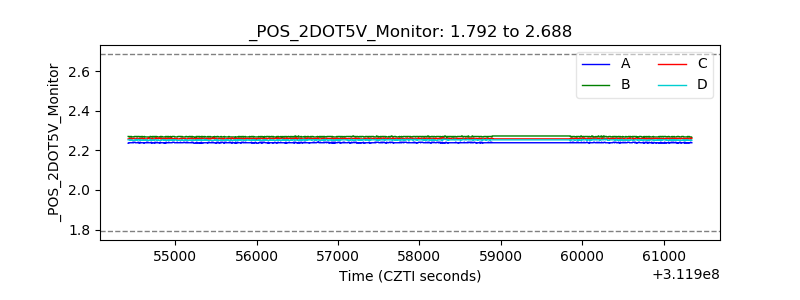 |
| +5 Volts monitor |  |
| _ROLL_ROT | 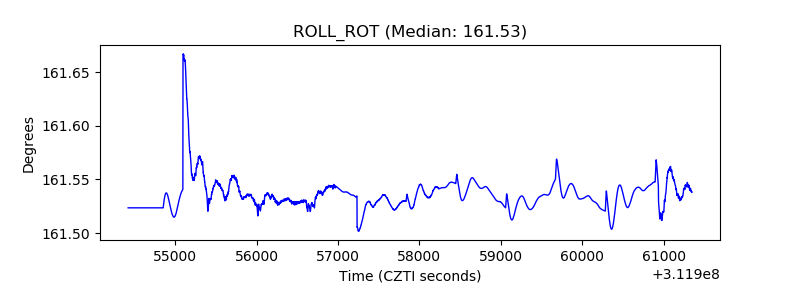 |
| _Roll_DEC | 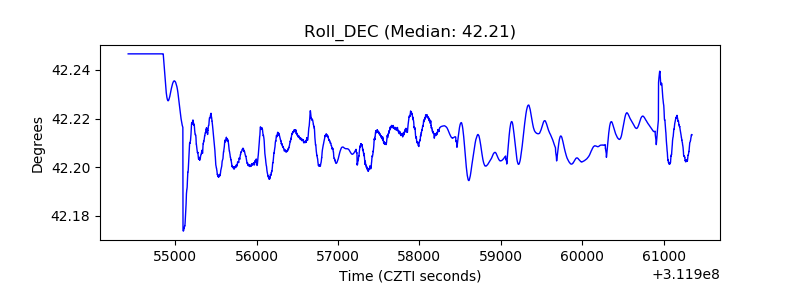 |
| _Roll_RA | 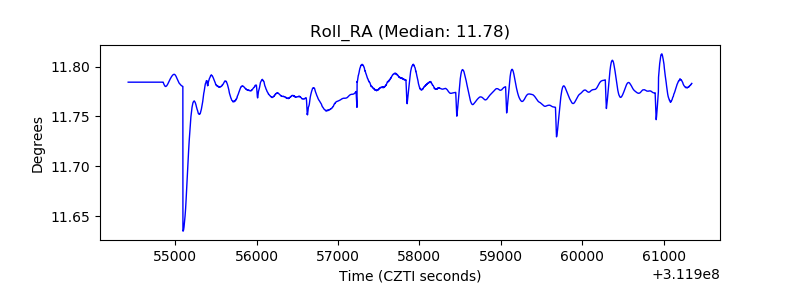 |
| Veto Counter | 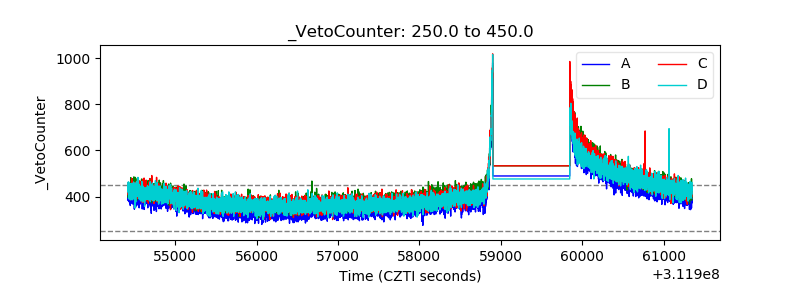 |