| Param | Original file | Final file |
|---|---|---|
| Filename | modeM0/AS1A07_007T03_9000003320_22418cztM0_level2.evt | modeM0/AS1A07_007T03_9000003320_22418cztM0_level2_quad_clean.evt |
| Size (bytes) | 438,445,440 | 97,459,200 |
| Size | 418.1 MB | 92.9 MB |
| Events in quadrant A | 3,001,890 | 644,141 |
| Events in quadrant B | 3,149,600 | 647,693 |
| Events in quadrant C | 3,057,813 | 620,924 |
| Events in quadrant D | 3,641,818 | 600,285 |
| Mode SS | |||
|---|---|---|---|
| Quadrant | BADHDUFLAG | Total packets | Discarded packets |
| A | 0 | 128 | 0 |
| B | 0 | 128 | 0 |
| C | 0 | 128 | 0 |
| D | 0 | 128 | 0 |
| Mode M9 | |||
|---|---|---|---|
| Quadrant | BADHDUFLAG | Total packets | Discarded packets |
| A | 0 | 11 | 0 |
| B | 0 | 11 | 0 |
| C | 0 | 11 | 0 |
| D | 0 | 11 | 0 |
| Mode M0 | |||
|---|---|---|---|
| Quadrant | BADHDUFLAG | Total packets | Discarded packets |
| A | 0 | 13126 | 2 |
| B | 0 | 13463 | 1 |
| C | 0 | 13164 | 1 |
| D | 0 | 14946 | 1 |
| Quadrant | Total seconds | Saturated seconds | Saturation percentage |
|---|---|---|---|
| A | 6281 | 54 | 0.859736% |
| B | 6282 | 51 | 0.811843% |
| C | 6282 | 73 | 1.162050% |
| D | 6282 | 160 | 2.546960% |
Noise dominated data is calculated using 1-second bins in cleaned event files. If a bin has >2000 counts, and if more than 50% of those come from <1% of pixels, then it is considered to be noise-dominated and hence unusable.
| Quadrant | # 1 sec bins | Bins with >0 counts | Bins with >2000 counts | High rate bins dominated by noise | Noise dominated (total time) | Noise dominated (detector-on time) | Marked lightcurve |
|---|---|---|---|---|---|---|---|
| A | 7391 | 6281 | 0 | 0 | 0.00% | 0.00% | 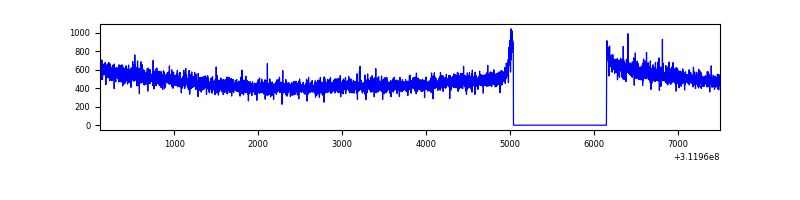 |
| B | 7392 | 6283 | 5 | 5 | 0.07% | 0.08% | 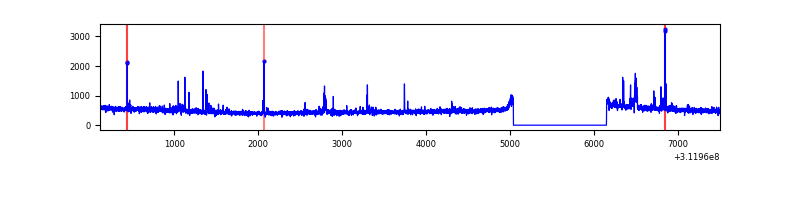 |
| C | 7392 | 6282 | 0 | 0 | 0.00% | 0.00% | 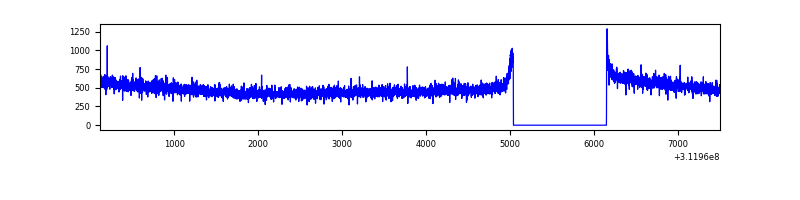 |
| D | 7392 | 6283 | 120 | 120 | 1.62% | 1.91% | 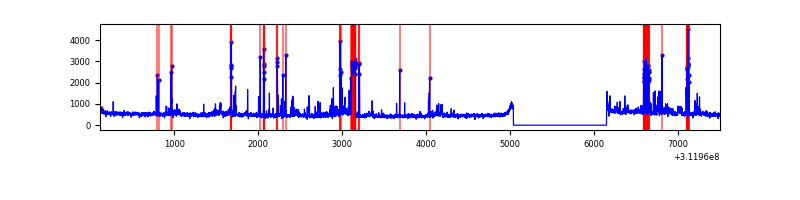 |
Top three noisy pixels from each quadrant. If the there are fewer than three noisy pixels in the level2.evt file, extra rows are filled as -1
| Pixel properties | Quadrant properties | ||||||
|---|---|---|---|---|---|---|---|
| Quadrant | DetID | PixID | Counts | Sigma | Mean | Median | Sigma |
| A | 13 | 254 | 9016 | 53.61 | 777 | 762 | 154.0 |
| A | 0 | 226 | 6700 | 38.57 | 777 | 762 | 154.0 |
| A | 3 | 137 | 6311 | 36.04 | 777 | 762 | 154.0 |
| B | 0 | 190 | 54605 | 370.86 | 770 | 754 | 145.2 |
| B | 0 | 228 | 25984 | 173.75 | 770 | 754 | 145.2 |
| B | 3 | 64 | 18855 | 124.66 | 770 | 754 | 145.2 |
| C | 14 | 238 | 116980 | 659.8 | 749 | 756 | 176.1 |
| C | 1 | 16 | 15466 | 83.51 | 749 | 756 | 176.1 |
| C | 0 | 10 | 5897 | 29.19 | 749 | 756 | 176.1 |
| D | 1 | 52 | 556240 | 3038.07 | 754 | 734 | 182.8 |
| D | 13 | 249 | 122840 | 667.8 | 754 | 734 | 182.8 |
| D | 12 | 227 | 53404 | 288.05 | 754 | 734 | 182.8 |
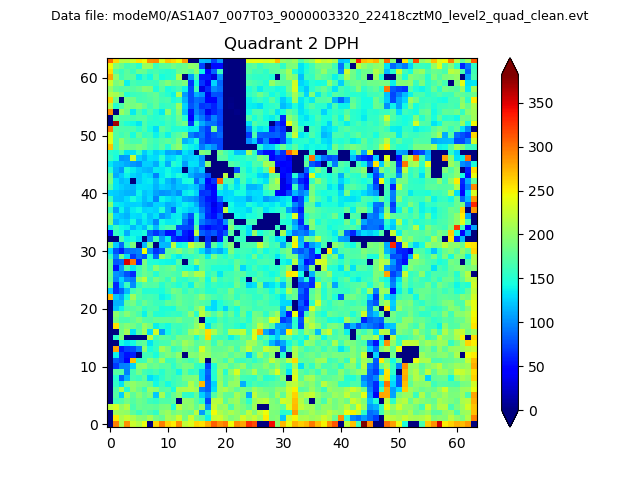
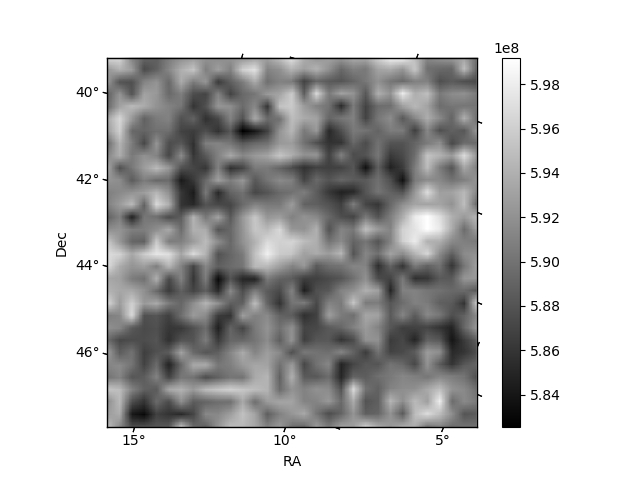
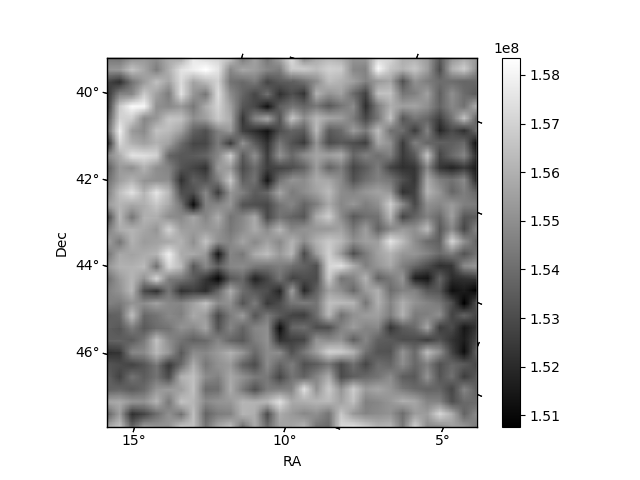
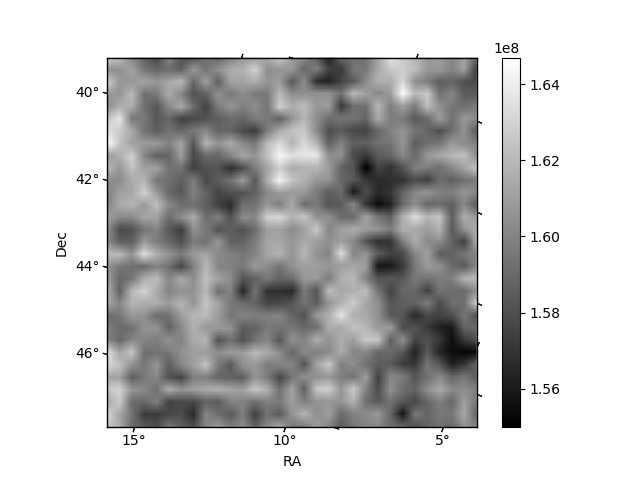
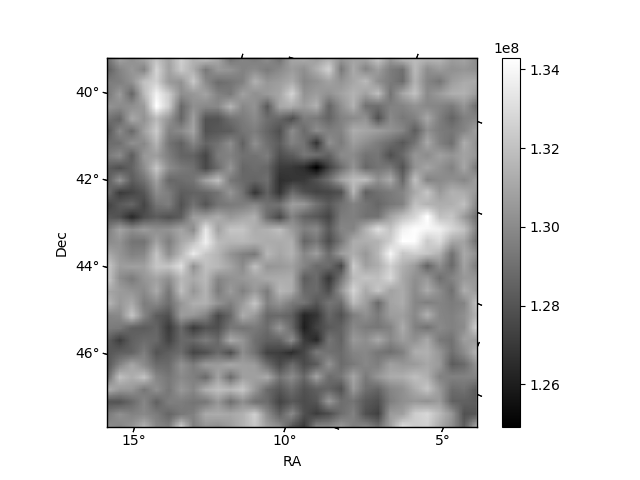
Histogram calculated using DETX and DETY for each event in the final _common_clean file
| Quadrant A | 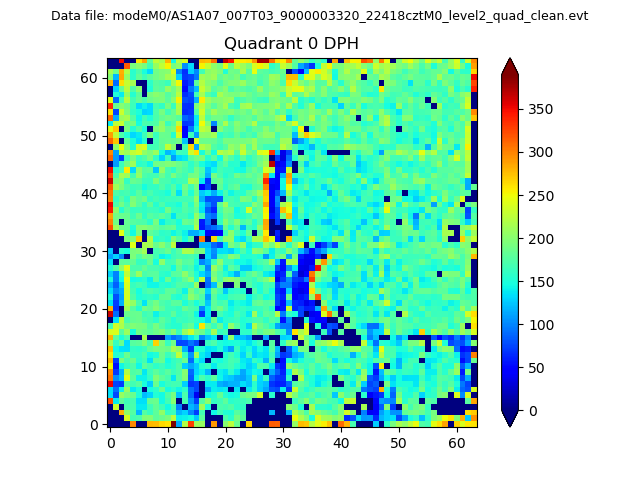 |
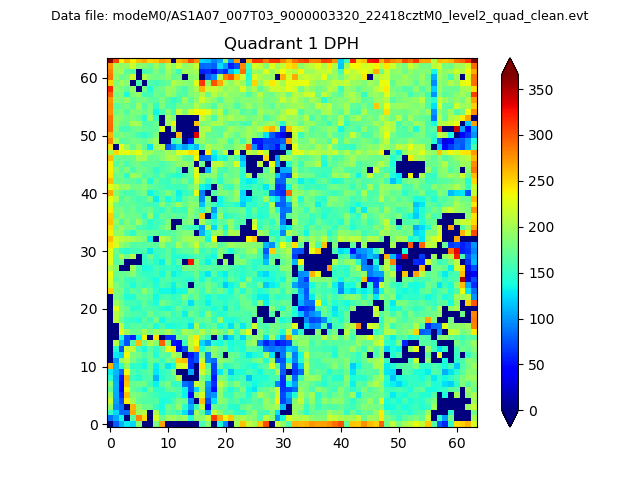 |
Quadrant B |
|---|---|---|---|
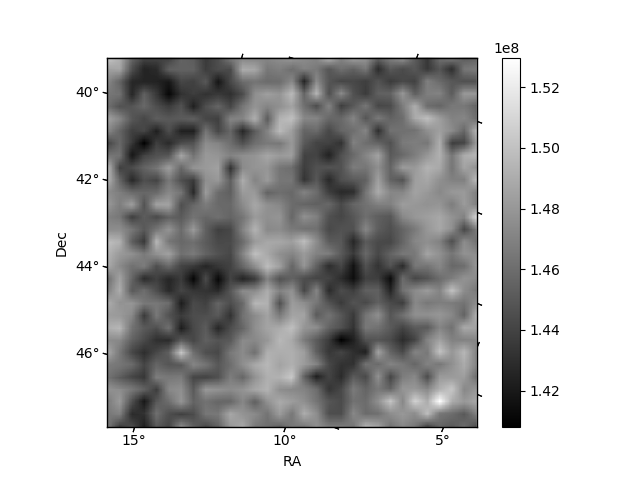
| Quadrant D | 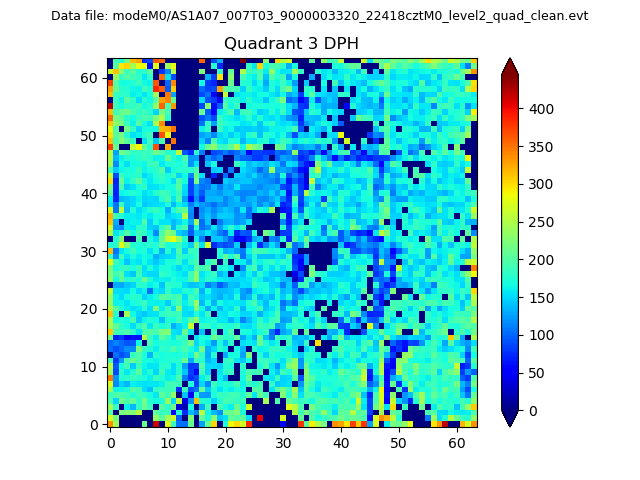 |
 |
Quadrant C |
| Plot type | Count rate plots | Images |
|---|---|---|
| Comparison with Poisson distribution Blue bars denote a histogram of data divided into 1 sec bins. Red curve is a Poisson curve with rate = median count rate of data. |
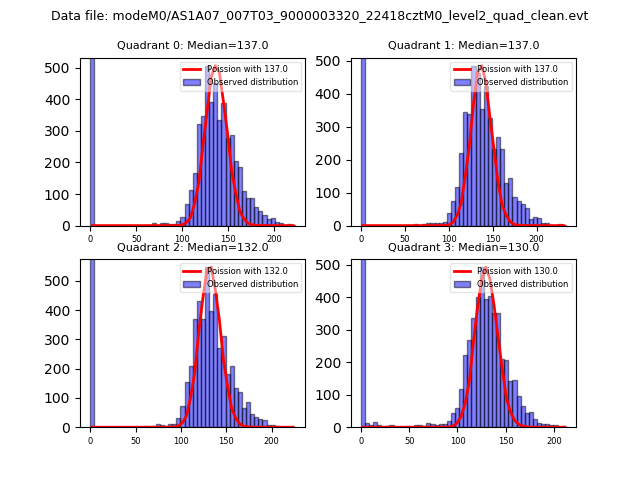 |
 |
| Quadrant-wise count rates Data is divided into 100 sec bins |
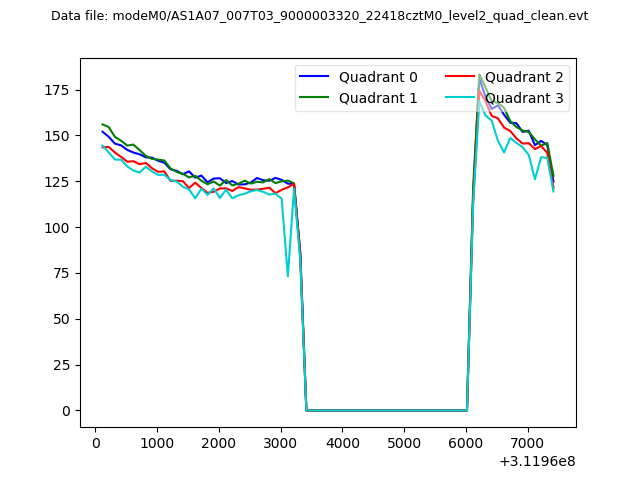 |
|
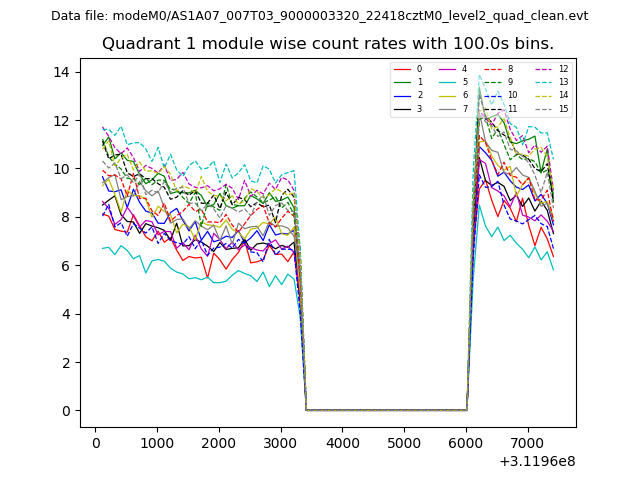
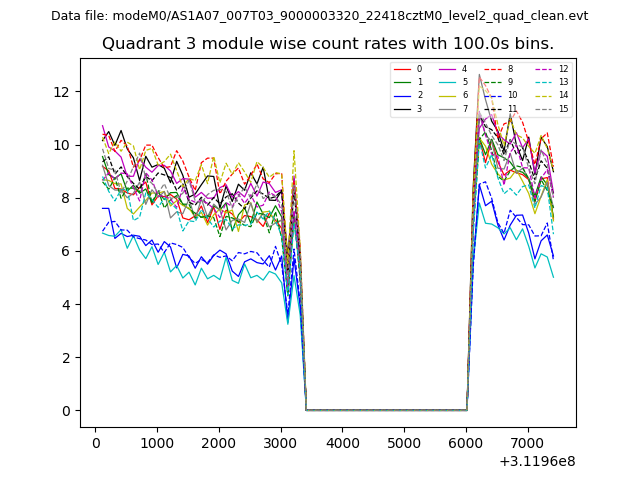
| Module-wise count rates for Quadrant A Data is divided into 100 sec bins |
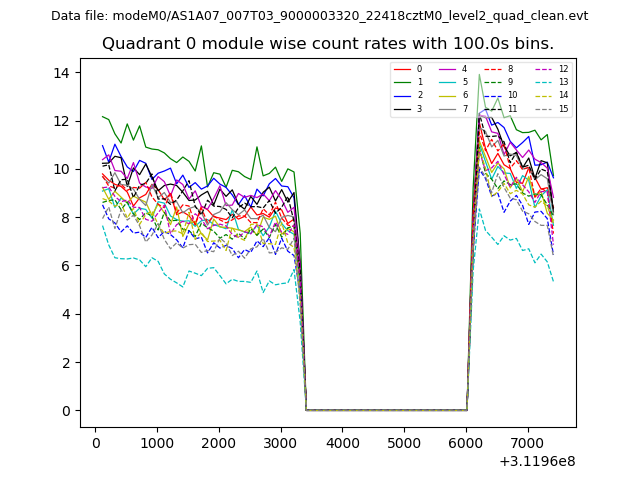 |
 |
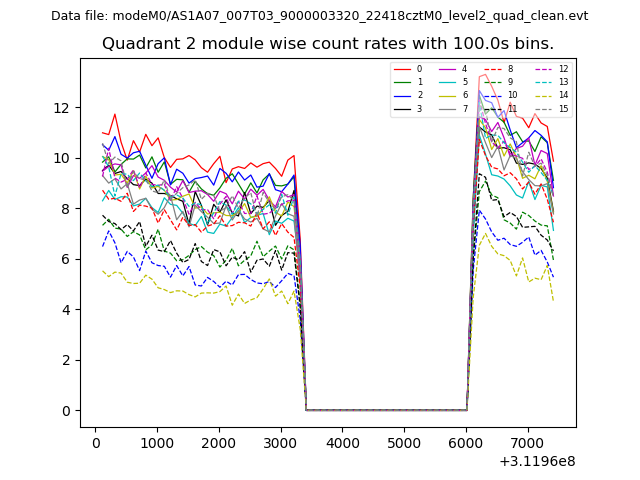
| Module-wise count rates for Quadrant B Data is divided into 100 sec bins |
 |
 |
| Module-wise count rates for Quadrant C Data is divided into 100 sec bins |
 |
 |
| Module-wise count rates for Quadrant D Data is divided into 100 sec bins |
 |
 |
| Parameter | Plot |
|---|---|
| CZT HV Monitor | 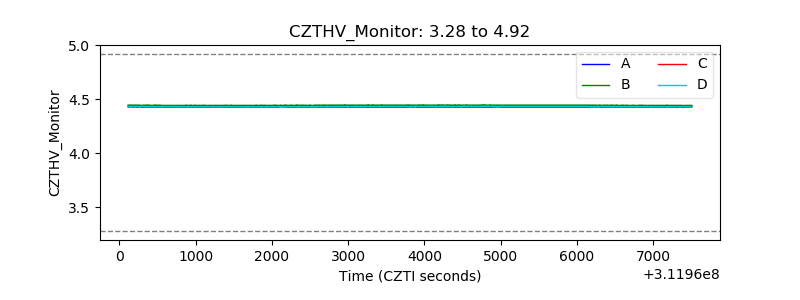 |
| D_VDD | 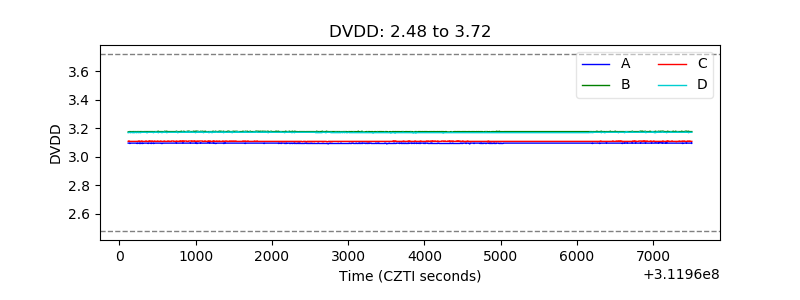 |
| Temperature 1 | 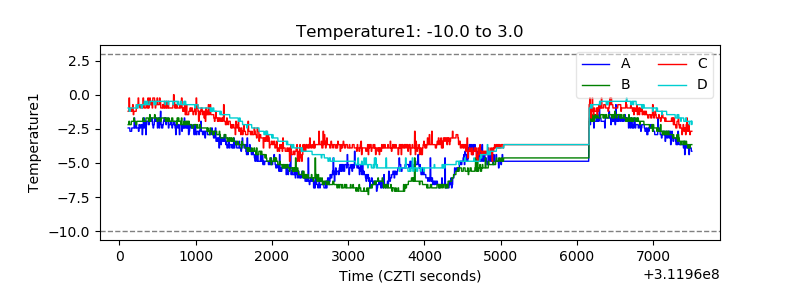 |
| Veto HV Monitor | 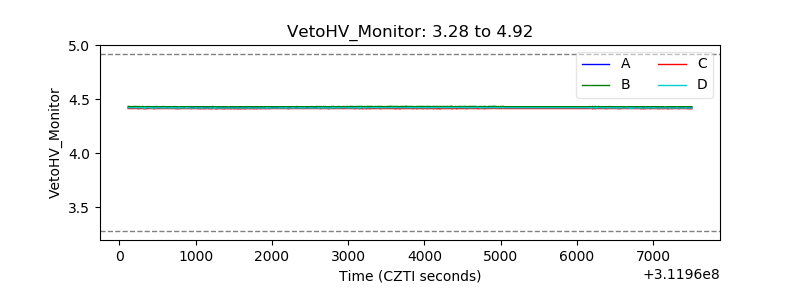 |
| Veto LLD | 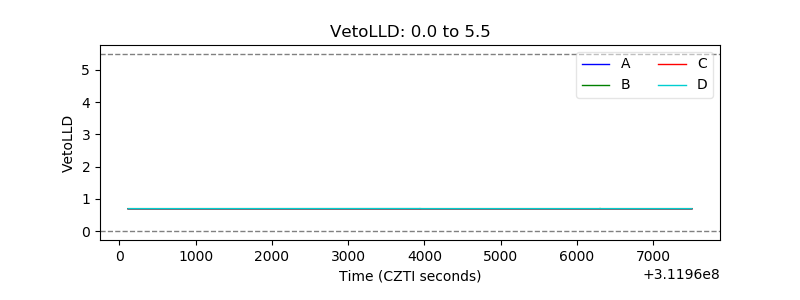 |
| Alpha Counter | 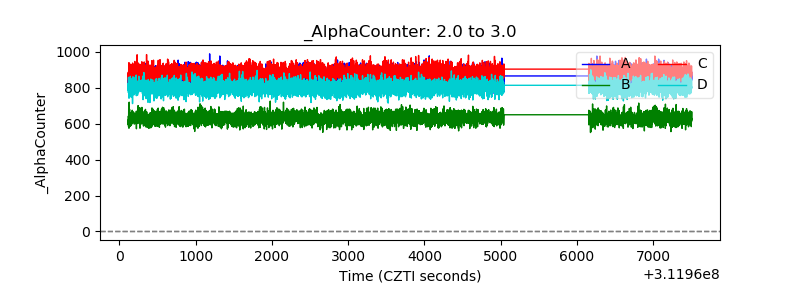 |
| _CPM_Rate | 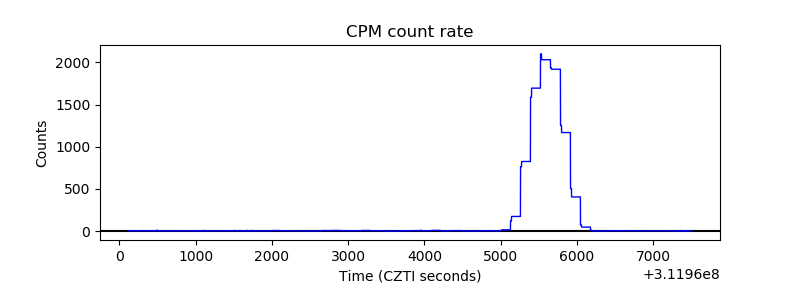 |
| CZT Counter | 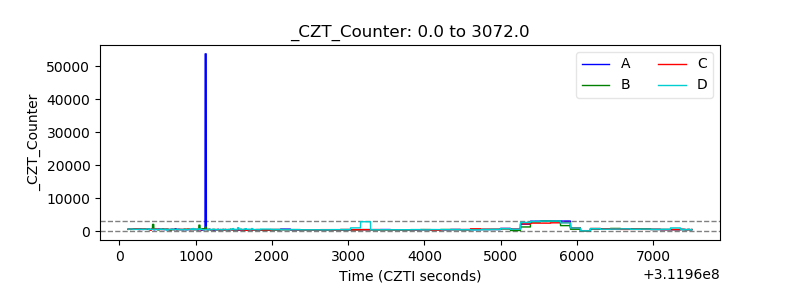 |
| +2.5 Volts monitor |  |
| +5 Volts monitor |  |
| _ROLL_ROT | 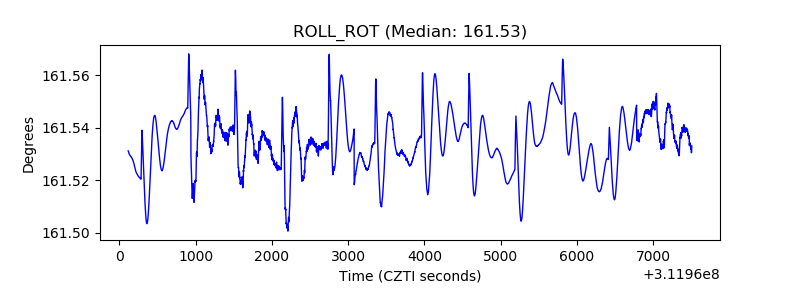 |
| _Roll_DEC | 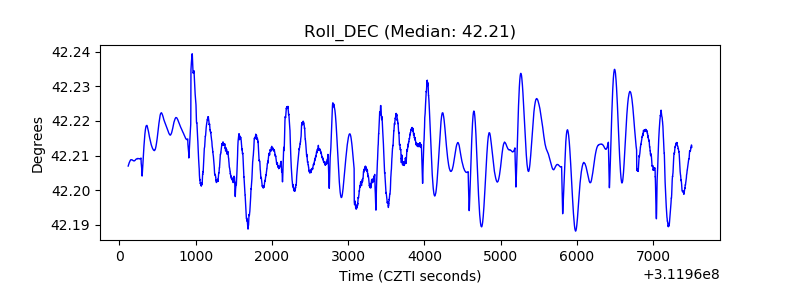 |
| _Roll_RA | 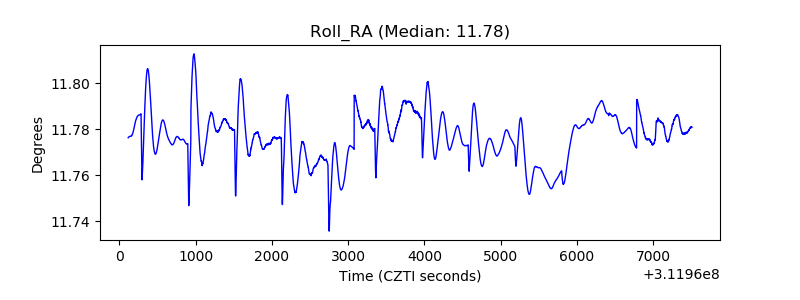 |
| Veto Counter | 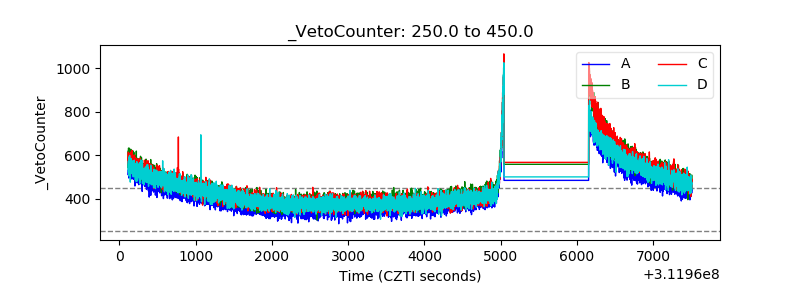 |