| Param | Original file | Final file |
|---|---|---|
| Filename | modeM0/AS1A07_007T03_9000003320_22419cztM0_level2.evt | modeM0/AS1A07_007T03_9000003320_22419cztM0_level2_quad_clean.evt |
| Size (bytes) | 460,298,880 | 100,650,240 |
| Size | 439.0 MB | 96.0 MB |
| Events in quadrant A | 3,153,884 | 667,929 |
| Events in quadrant B | 3,303,034 | 673,659 |
| Events in quadrant C | 3,220,532 | 644,983 |
| Events in quadrant D | 3,831,927 | 618,947 |
| Mode SS | |||
|---|---|---|---|
| Quadrant | BADHDUFLAG | Total packets | Discarded packets |
| A | 0 | 128 | 0 |
| B | 0 | 128 | 0 |
| C | 0 | 128 | 0 |
| D | 0 | 128 | 0 |
| Mode M9 | |||
|---|---|---|---|
| Quadrant | BADHDUFLAG | Total packets | Discarded packets |
| A | 0 | 16 | 0 |
| B | 0 | 17 | 0 |
| C | 0 | 17 | 0 |
| D | 0 | 17 | 0 |
| Mode M0 | |||
|---|---|---|---|
| Quadrant | BADHDUFLAG | Total packets | Discarded packets |
| A | 0 | 13582 | 2 |
| B | 0 | 13964 | 4 |
| C | 0 | 13706 | 2 |
| D | 0 | 15821 | 2 |
| Quadrant | Total seconds | Saturated seconds | Saturation percentage |
|---|---|---|---|
| A | 6346 | 45 | 0.709108% |
| B | 6345 | 54 | 0.851064% |
| C | 6345 | 82 | 1.292356% |
| D | 6345 | 190 | 2.994484% |
Noise dominated data is calculated using 1-second bins in cleaned event files. If a bin has >2000 counts, and if more than 50% of those come from <1% of pixels, then it is considered to be noise-dominated and hence unusable.
| Quadrant | # 1 sec bins | Bins with >0 counts | Bins with >2000 counts | High rate bins dominated by noise | Noise dominated (total time) | Noise dominated (detector-on time) | Marked lightcurve |
|---|---|---|---|---|---|---|---|
| A | 7576 | 6347 | 0 | 0 | 0.00% | 0.00% | 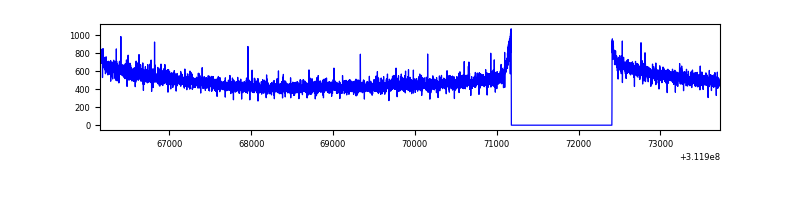 |
| B | 7575 | 6346 | 4 | 4 | 0.05% | 0.06% |  |
| C | 7575 | 6345 | 0 | 0 | 0.00% | 0.00% | 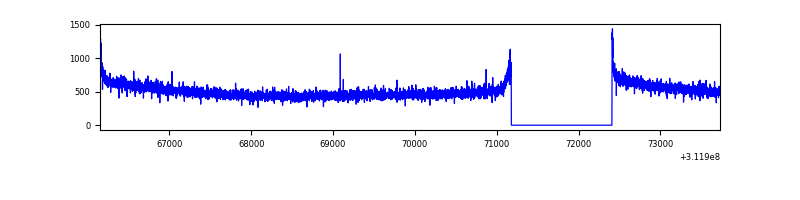 |
| D | 7575 | 6346 | 128 | 128 | 1.69% | 2.02% | 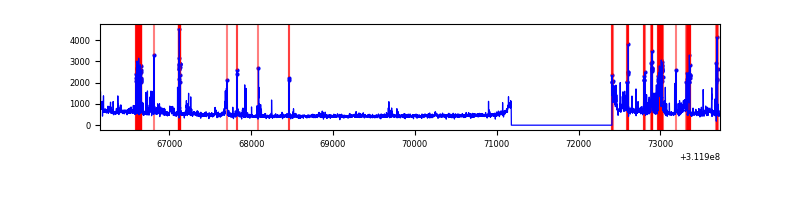 |
Top three noisy pixels from each quadrant. If the there are fewer than three noisy pixels in the level2.evt file, extra rows are filled as -1
| Pixel properties | Quadrant properties | ||||||
|---|---|---|---|---|---|---|---|
| Quadrant | DetID | PixID | Counts | Sigma | Mean | Median | Sigma |
| A | 13 | 254 | 9562 | 54.15 | 815 | 800 | 161.8 |
| A | 3 | 1 | 7863 | 43.65 | 815 | 800 | 161.8 |
| A | 0 | 226 | 7150 | 39.24 | 815 | 800 | 161.8 |
| B | 3 | 64 | 52614 | 343.15 | 809 | 788 | 151.0 |
| B | 0 | 190 | 39238 | 254.59 | 809 | 788 | 151.0 |
| B | 4 | 173 | 19435 | 123.47 | 809 | 788 | 151.0 |
| C | 14 | 238 | 124061 | 674.83 | 787 | 793 | 182.7 |
| C | 1 | 16 | 14659 | 75.91 | 787 | 793 | 182.7 |
| C | 0 | 10 | 12039 | 61.57 | 787 | 793 | 182.7 |
| D | 1 | 52 | 382526 | 2014.03 | 790 | 770 | 189.5 |
| D | 13 | 249 | 314200 | 1653.56 | 790 | 770 | 189.5 |
| D | 7 | 222 | 83647 | 437.23 | 790 | 770 | 189.5 |
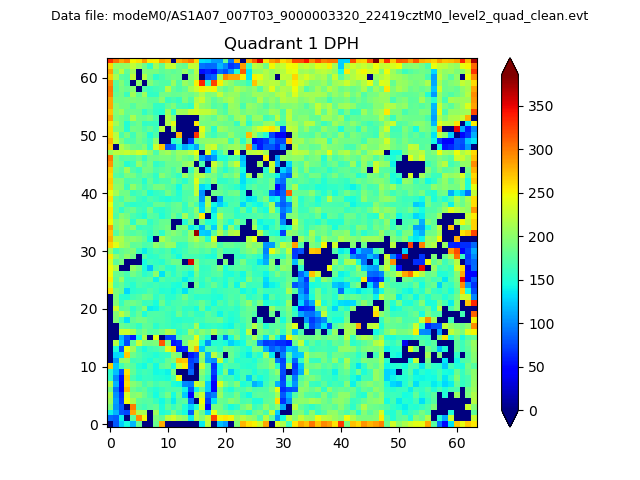
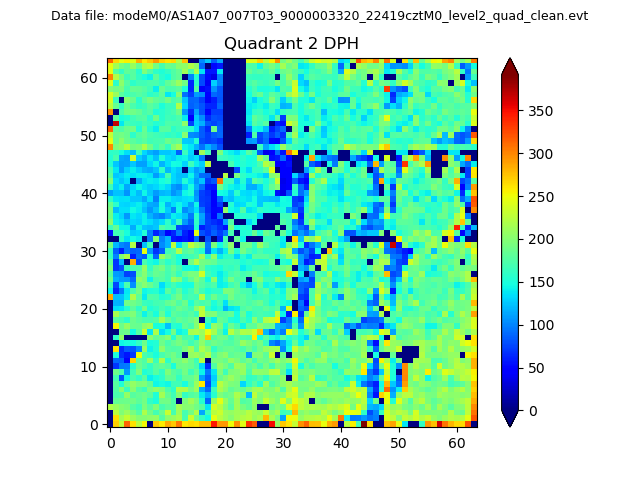
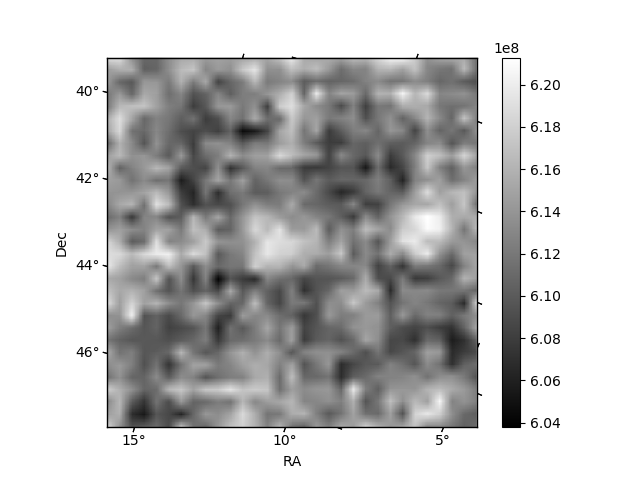
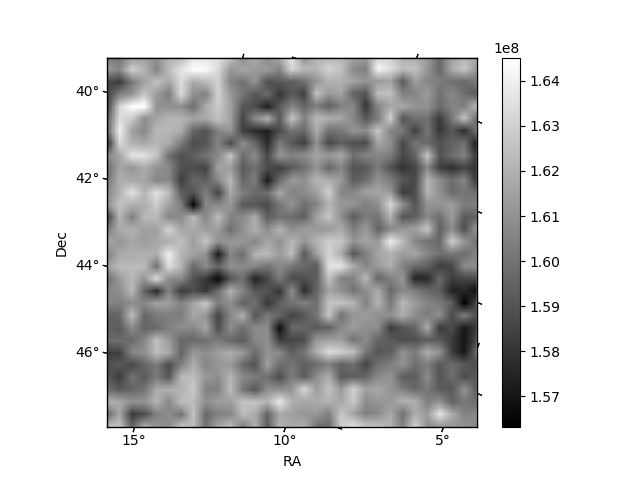
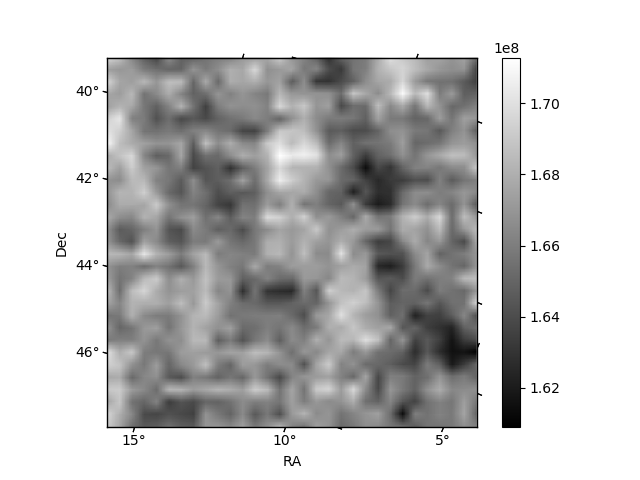
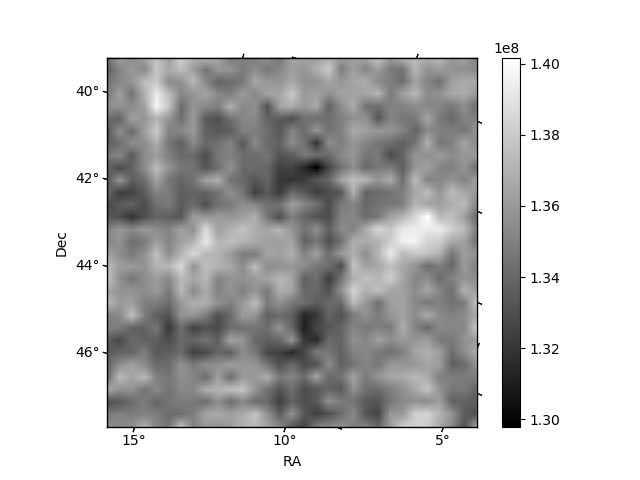
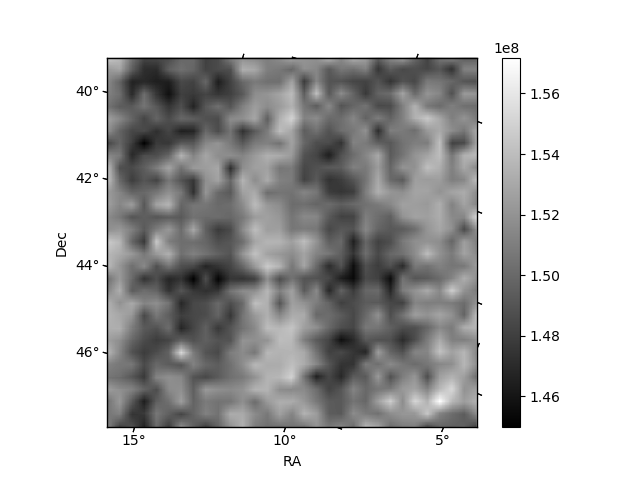
Histogram calculated using DETX and DETY for each event in the final _common_clean file
| Quadrant A | 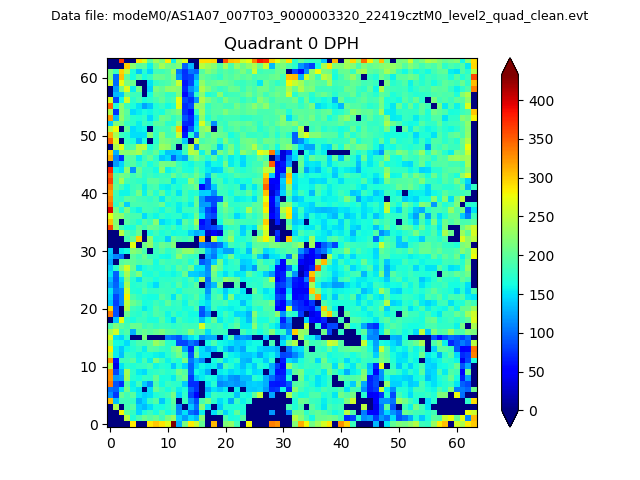 |
 |
Quadrant B |
|---|---|---|---|
| Quadrant D | 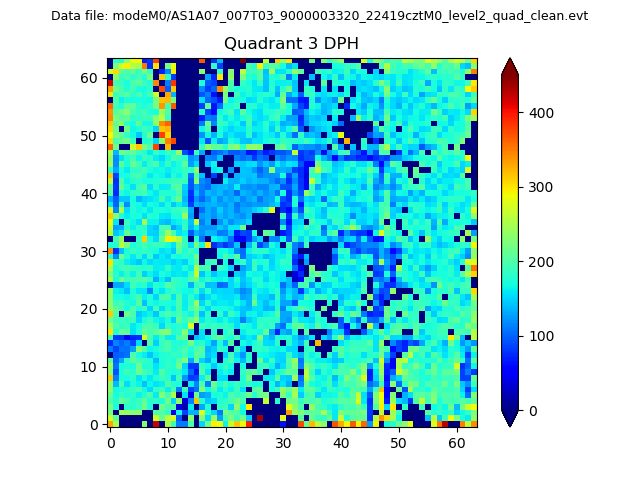 |
 |
Quadrant C |
| Plot type | Count rate plots | Images |
|---|---|---|
| Comparison with Poisson distribution Blue bars denote a histogram of data divided into 1 sec bins. Red curve is a Poisson curve with rate = median count rate of data. |
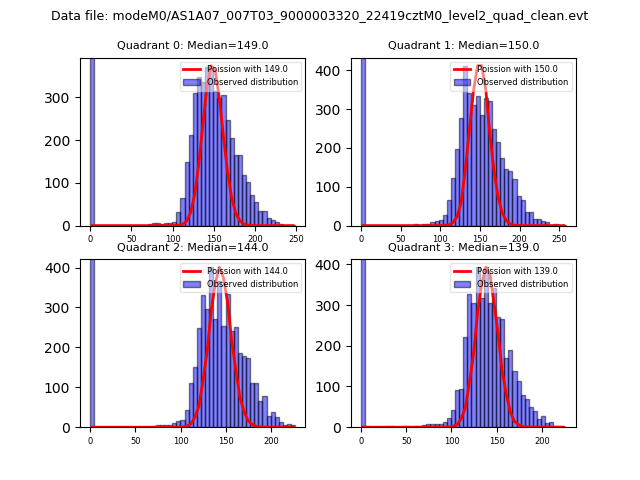 |
 |
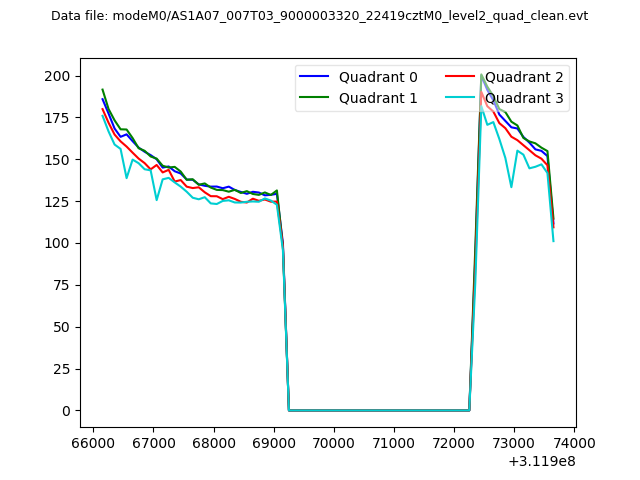
| Quadrant-wise count rates Data is divided into 100 sec bins |
 |
|
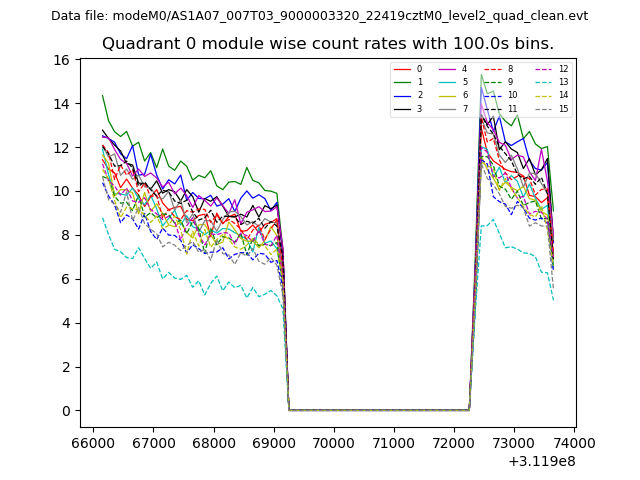
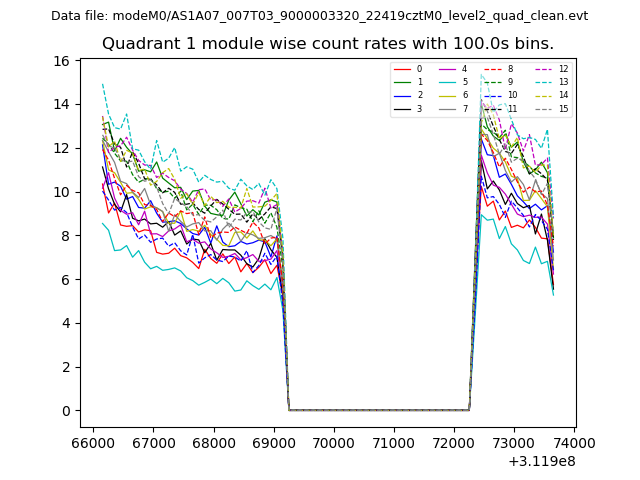
| Module-wise count rates for Quadrant A Data is divided into 100 sec bins |
 |
 |
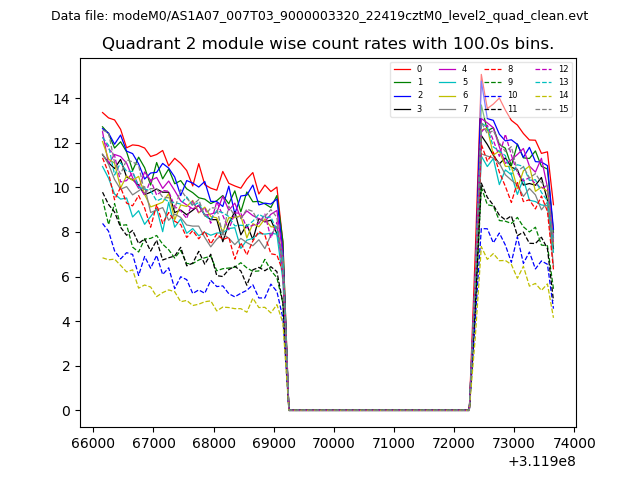
| Module-wise count rates for Quadrant B Data is divided into 100 sec bins |
 |
 |
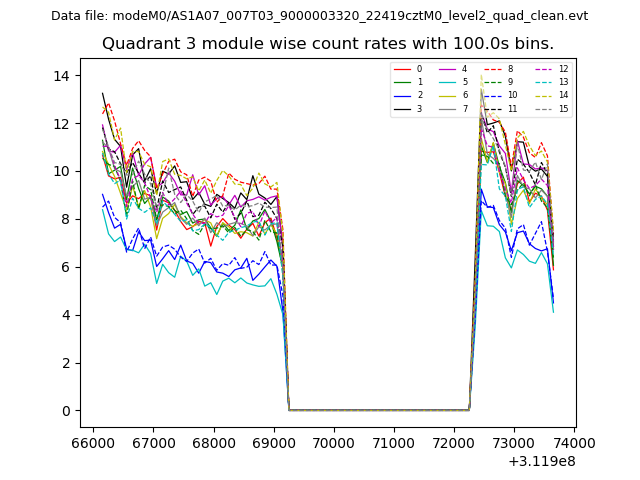
| Module-wise count rates for Quadrant C Data is divided into 100 sec bins |
 |
 |
| Module-wise count rates for Quadrant D Data is divided into 100 sec bins |
 |
 |
| Parameter | Plot |
|---|---|
| CZT HV Monitor | 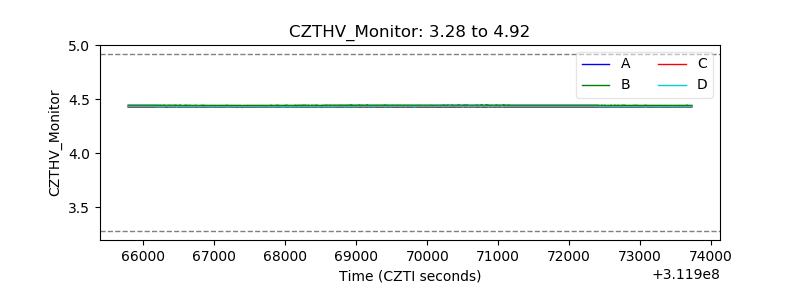 |
| D_VDD |  |
| Temperature 1 | 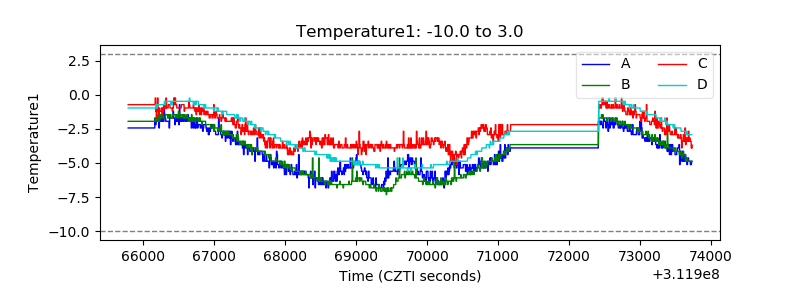 |
| Veto HV Monitor | 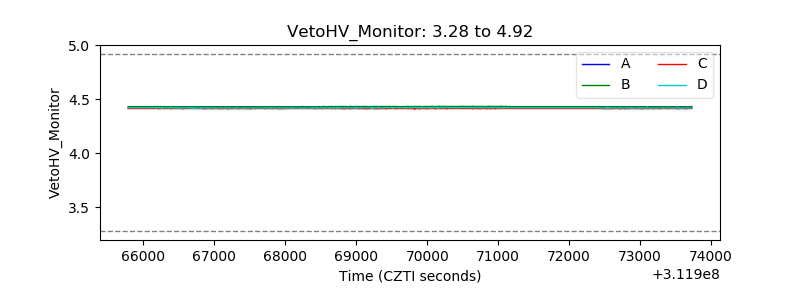 |
| Veto LLD | 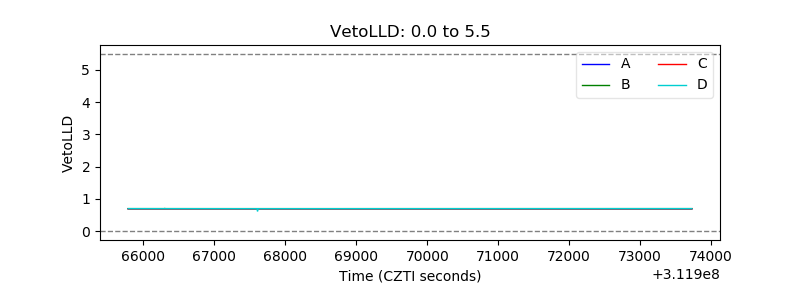 |
| Alpha Counter | 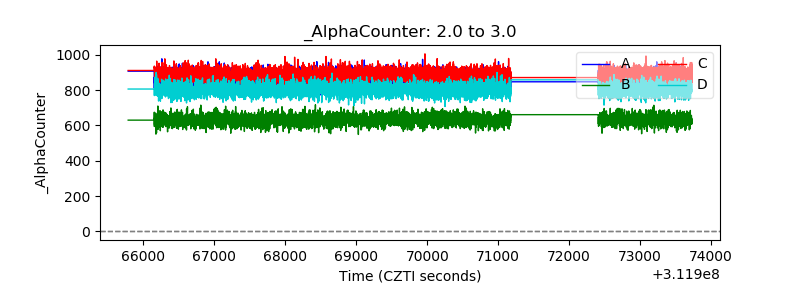 |
| _CPM_Rate | 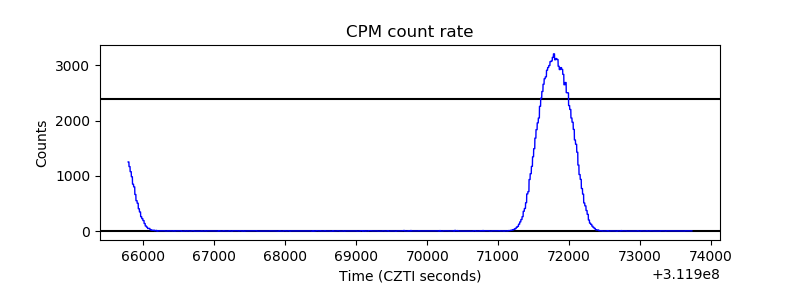 |
| CZT Counter | 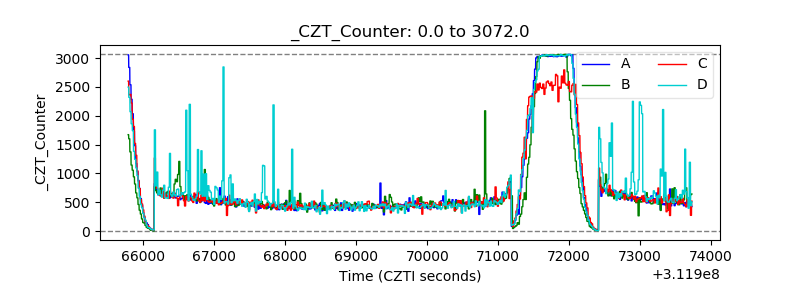 |
| +2.5 Volts monitor | 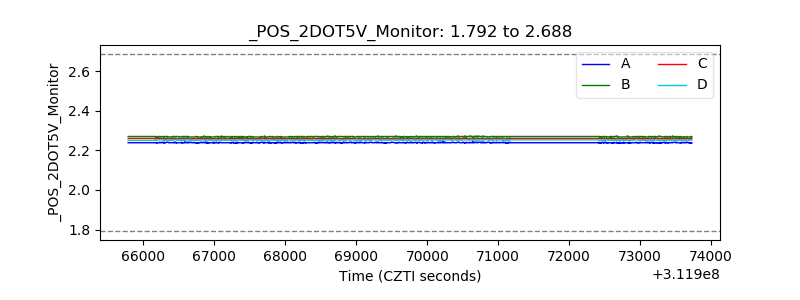 |
| +5 Volts monitor |  |
| _ROLL_ROT | 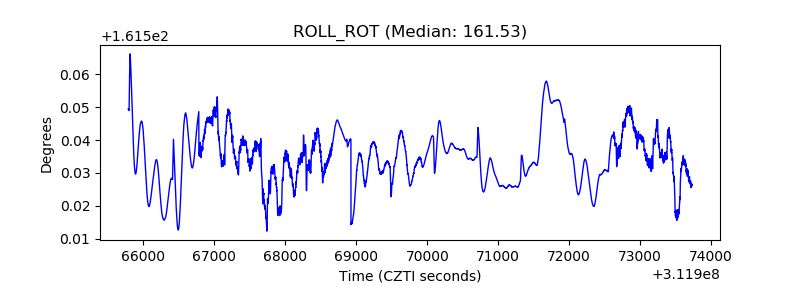 |
| _Roll_DEC | 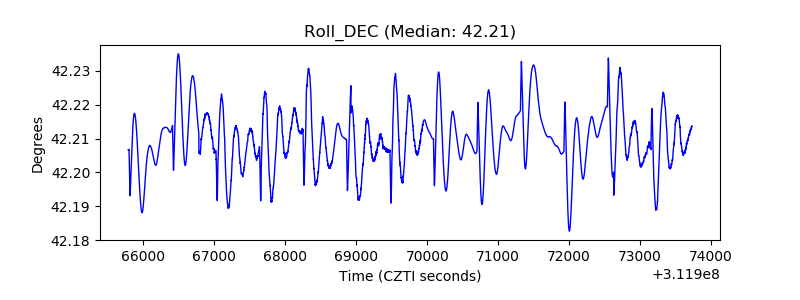 |
| _Roll_RA | 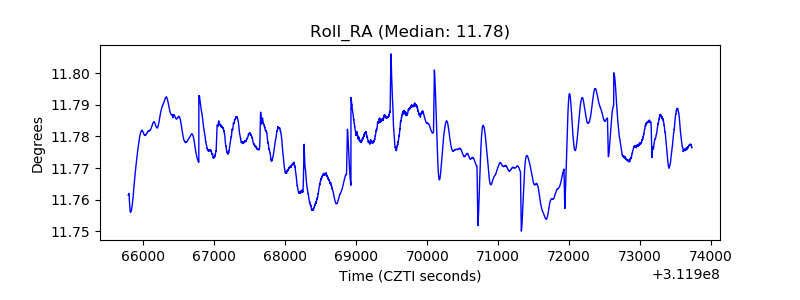 |
| Veto Counter | 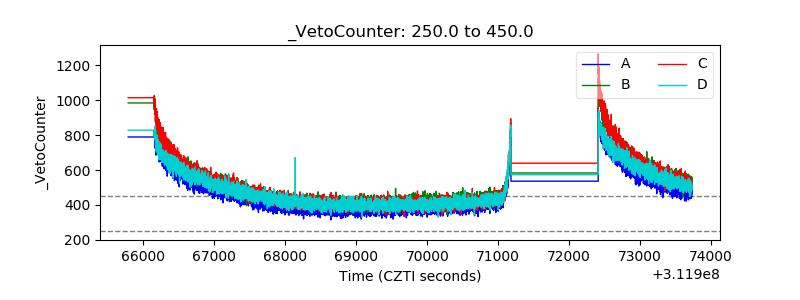 |