| Param | Original file | Final file |
|---|---|---|
| Filename | modeM0/AS1A07_007T03_9000003320_22421cztM0_level2.evt | modeM0/AS1A07_007T03_9000003320_22421cztM0_level2_quad_clean.evt |
| Size (bytes) | 476,533,440 | 96,635,520 |
| Size | 454.5 MB | 92.2 MB |
| Events in quadrant A | 3,064,708 | 643,716 |
| Events in quadrant B | 3,161,920 | 662,771 |
| Events in quadrant C | 3,247,619 | 625,380 |
| Events in quadrant D | 4,547,351 | 572,695 |
| Mode SS | |||
|---|---|---|---|
| Quadrant | BADHDUFLAG | Total packets | Discarded packets |
| A | 0 | 122 | 0 |
| B | 0 | 122 | 0 |
| C | 0 | 122 | 0 |
| D | 0 | 122 | 0 |
| Mode M9 | |||
|---|---|---|---|
| Quadrant | BADHDUFLAG | Total packets | Discarded packets |
| A | 0 | 21 | 0 |
| B | 0 | 22 | 0 |
| C | 0 | 22 | 0 |
| D | 0 | 22 | 0 |
| Mode M0 | |||
|---|---|---|---|
| Quadrant | BADHDUFLAG | Total packets | Discarded packets |
| A | 0 | 12856 | 2 |
| B | 0 | 13114 | 2 |
| C | 0 | 13343 | 2 |
| D | 0 | 17596 | 3 |
| Quadrant | Total seconds | Saturated seconds | Saturation percentage |
|---|---|---|---|
| A | 6044 | 26 | 0.430179% |
| B | 6044 | 41 | 0.678359% |
| C | 6044 | 136 | 2.250165% |
| D | 6043 | 400 | 6.619229% |
Noise dominated data is calculated using 1-second bins in cleaned event files. If a bin has >2000 counts, and if more than 50% of those come from <1% of pixels, then it is considered to be noise-dominated and hence unusable.
| Quadrant | # 1 sec bins | Bins with >0 counts | Bins with >2000 counts | High rate bins dominated by noise | Noise dominated (total time) | Noise dominated (detector-on time) | Marked lightcurve |
|---|---|---|---|---|---|---|---|
| A | 7429 | 6045 | 0 | 0 | 0.00% | 0.00% | 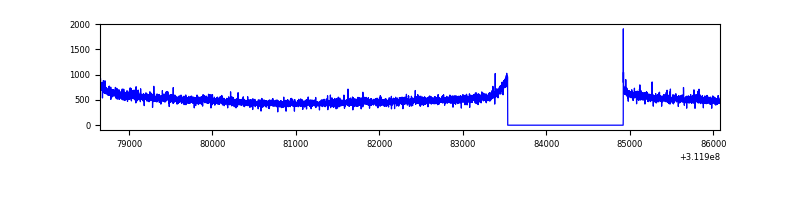 |
| B | 7429 | 6045 | 0 | 0 | 0.00% | 0.00% | 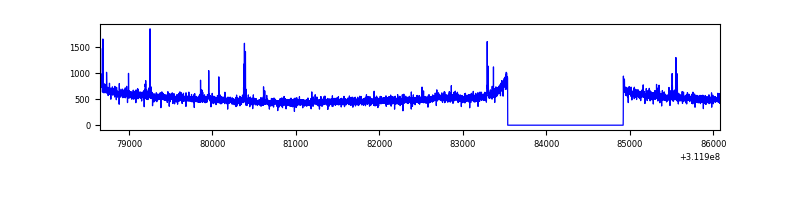 |
| C | 7429 | 6045 | 24 | 24 | 0.32% | 0.40% |  |
| D | 7428 | 6044 | 324 | 324 | 4.36% | 5.36% | 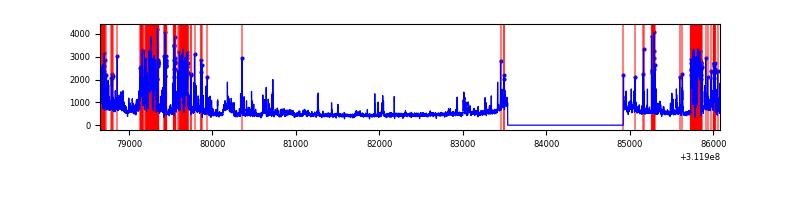 |
Top three noisy pixels from each quadrant. If the there are fewer than three noisy pixels in the level2.evt file, extra rows are filled as -1
| Pixel properties | Quadrant properties | ||||||
|---|---|---|---|---|---|---|---|
| Quadrant | DetID | PixID | Counts | Sigma | Mean | Median | Sigma |
| A | 3 | 1 | 10165 | 59.85 | 790 | 775 | 156.9 |
| A | 15 | 174 | 9887 | 58.08 | 790 | 775 | 156.9 |
| A | 13 | 254 | 9624 | 56.4 | 790 | 775 | 156.9 |
| B | 3 | 64 | 36082 | 241.13 | 795 | 776 | 146.4 |
| B | 12 | 111 | 16663 | 108.5 | 795 | 776 | 146.4 |
| B | 11 | 111 | 14664 | 94.85 | 795 | 776 | 146.4 |
| C | 14 | 238 | 122676 | 679.46 | 769 | 774 | 179.4 |
| C | 0 | 10 | 91147 | 503.72 | 769 | 774 | 179.4 |
| C | 1 | 16 | 27458 | 148.73 | 769 | 774 | 179.4 |
| D | 1 | 52 | 865298 | 4835.45 | 746 | 726 | 178.8 |
| D | 13 | 172 | 593184 | 3313.55 | 746 | 726 | 178.8 |
| D | 13 | 249 | 194776 | 1085.3 | 746 | 726 | 178.8 |
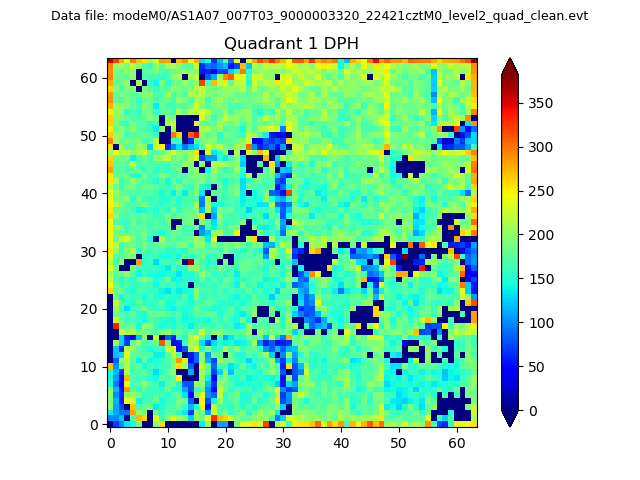
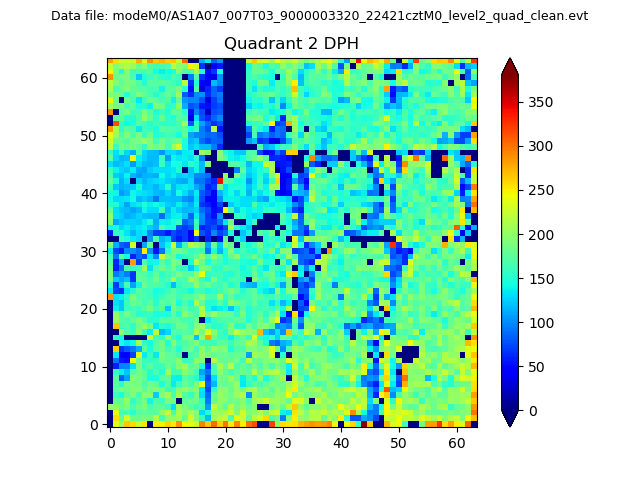
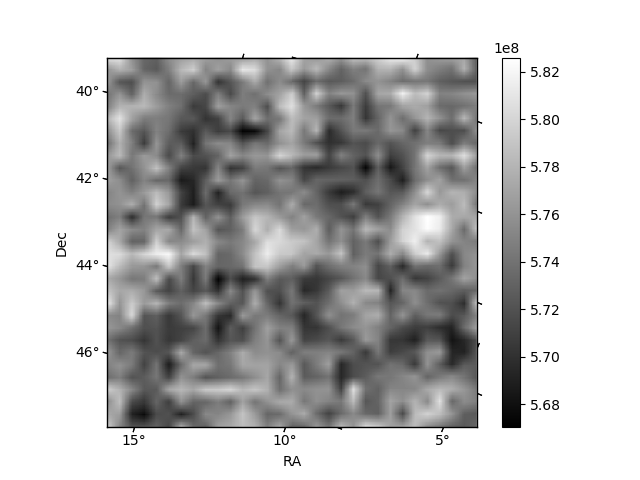
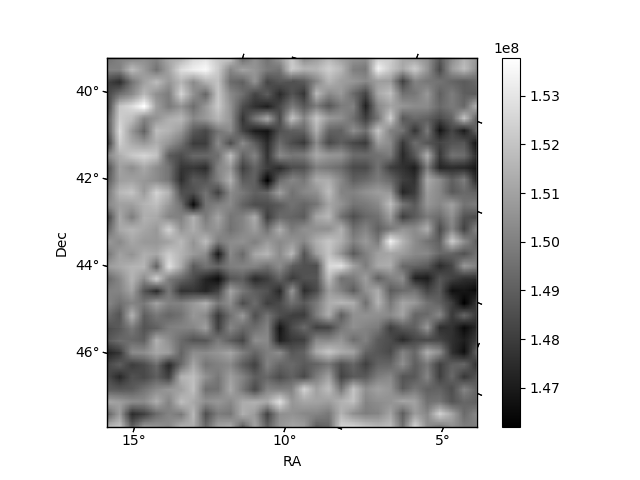
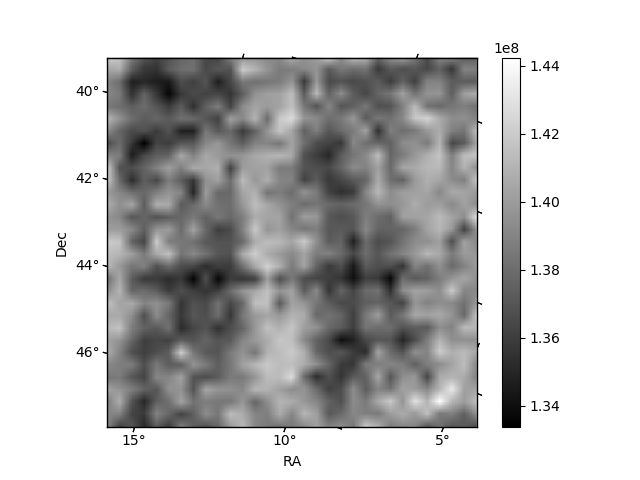
Histogram calculated using DETX and DETY for each event in the final _common_clean file
| Quadrant A | 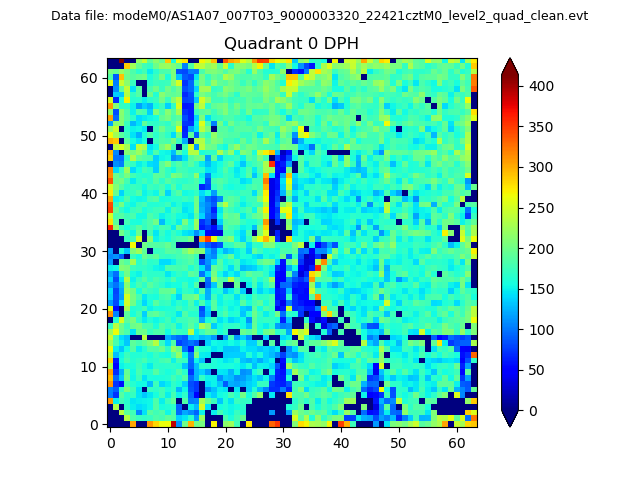 |
 |
Quadrant B |
|---|---|---|---|
| Quadrant D | 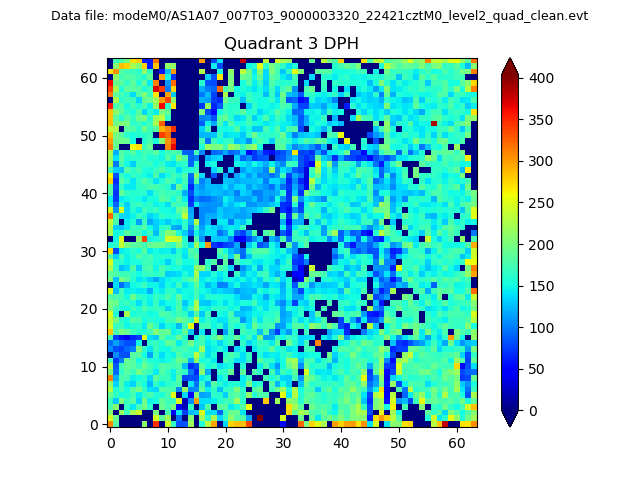 |
 |
Quadrant C |
| Plot type | Count rate plots | Images |
|---|---|---|
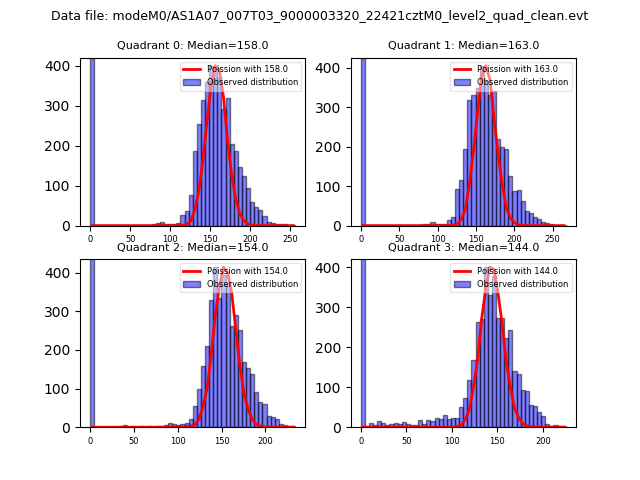
| Comparison with Poisson distribution Blue bars denote a histogram of data divided into 1 sec bins. Red curve is a Poisson curve with rate = median count rate of data. |
 |
 |
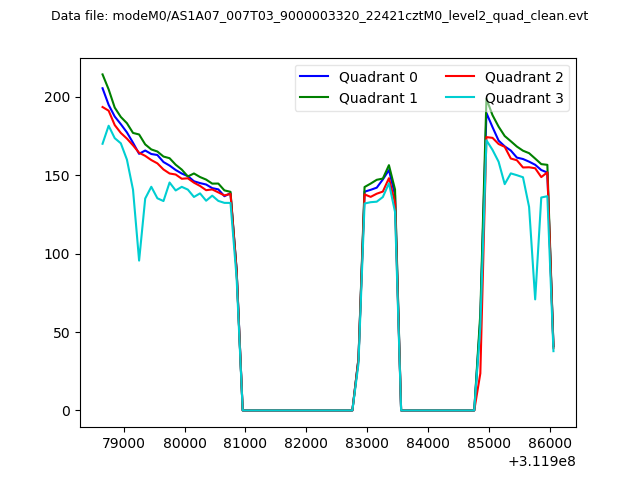
| Quadrant-wise count rates Data is divided into 100 sec bins |
 |
|
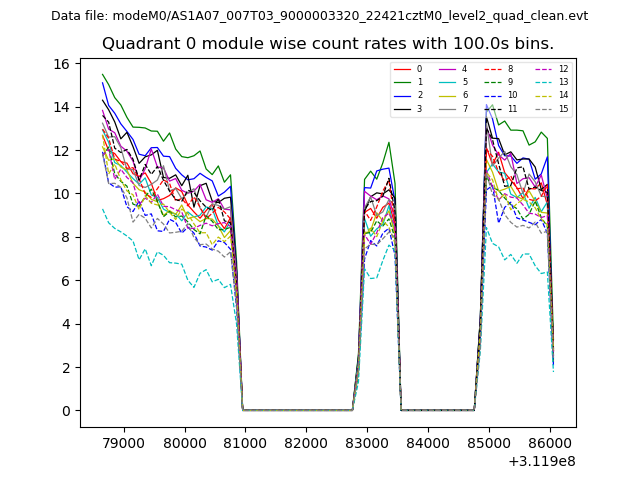
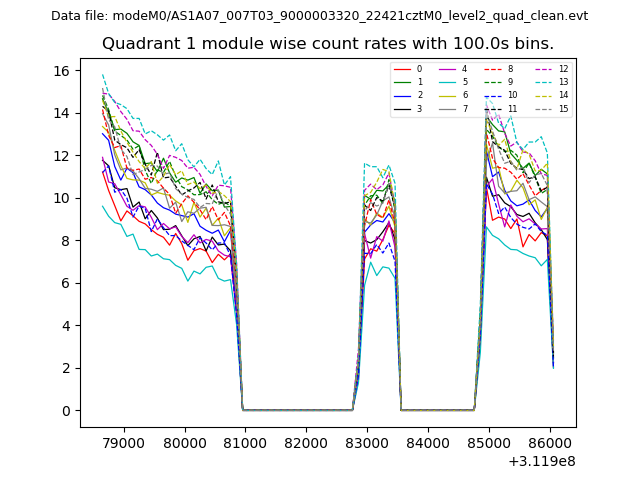
| Module-wise count rates for Quadrant A Data is divided into 100 sec bins |
 |
 |
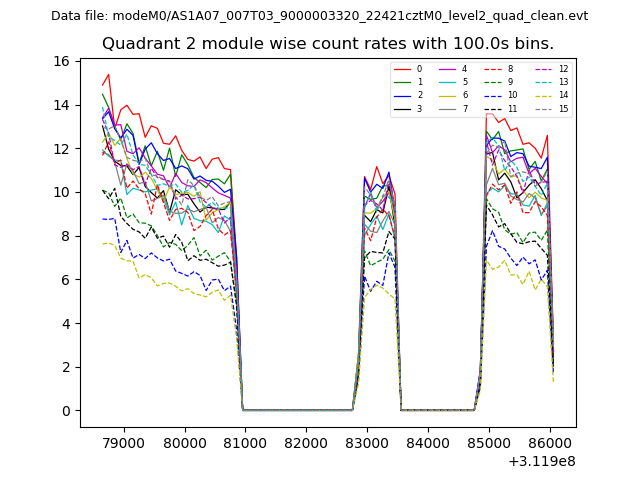
| Module-wise count rates for Quadrant B Data is divided into 100 sec bins |
 |
 |
| Module-wise count rates for Quadrant C Data is divided into 100 sec bins |
 |
 |
| Module-wise count rates for Quadrant D Data is divided into 100 sec bins |
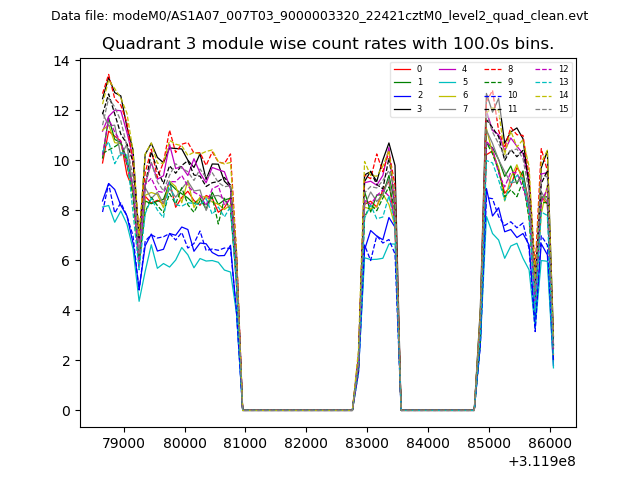 |
 |
| Parameter | Plot |
|---|---|
| CZT HV Monitor | 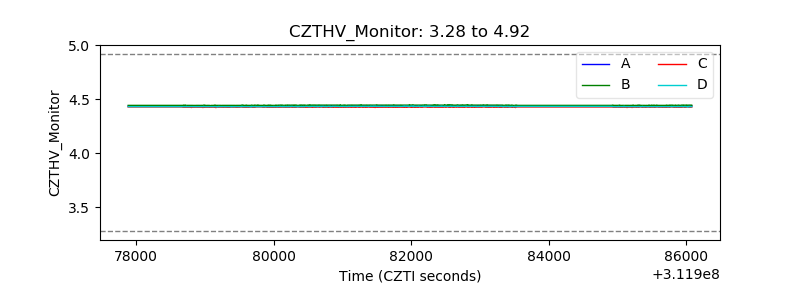 |
| D_VDD | 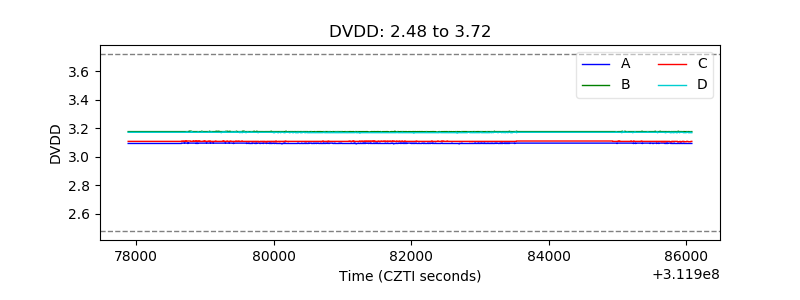 |
| Temperature 1 | 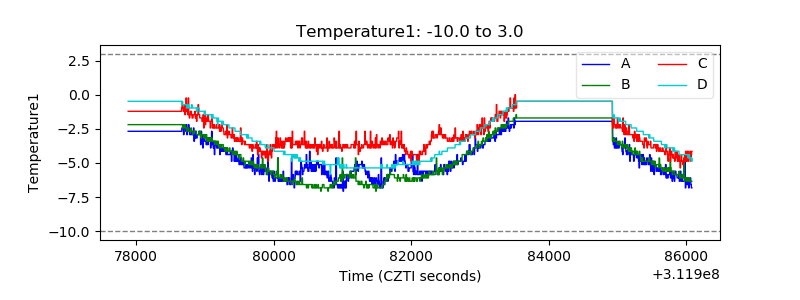 |
| Veto HV Monitor |  |
| Veto LLD | 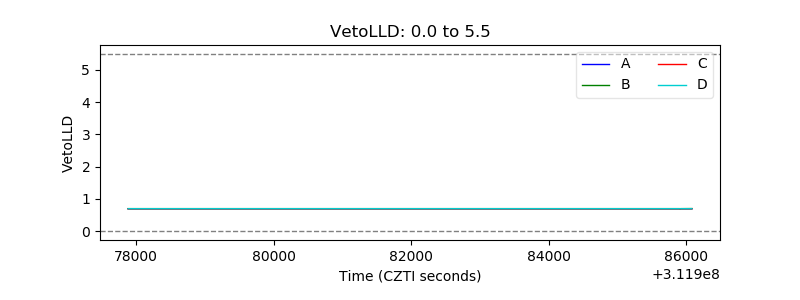 |
| Alpha Counter | 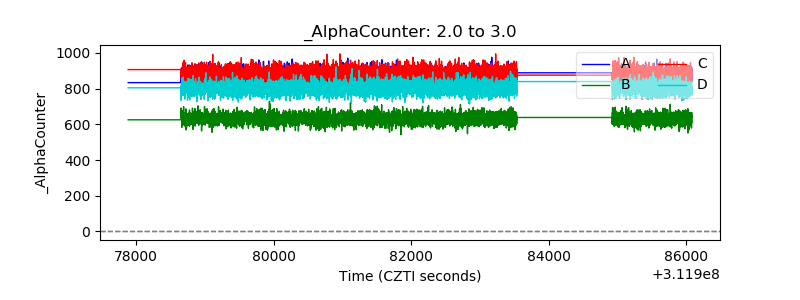 |
| _CPM_Rate | 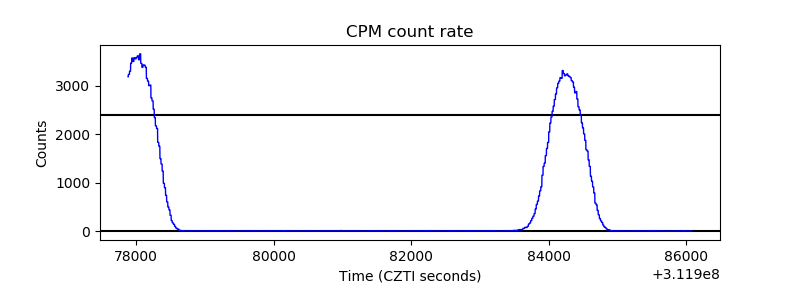 |
| CZT Counter | 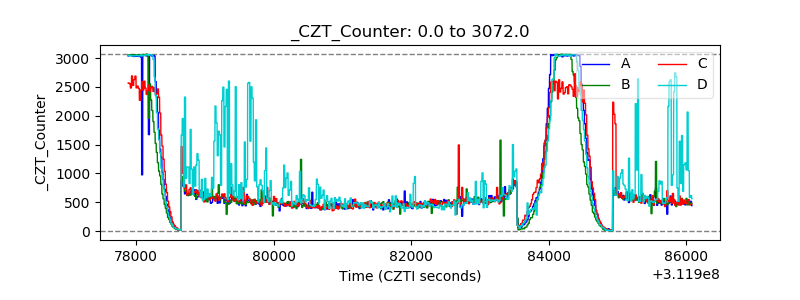 |
| +2.5 Volts monitor |  |
| +5 Volts monitor | 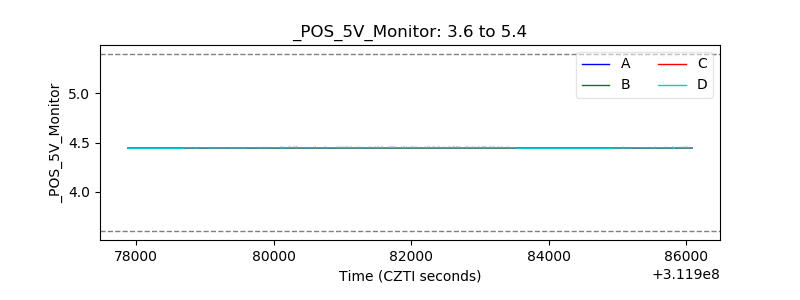 |
| _ROLL_ROT | 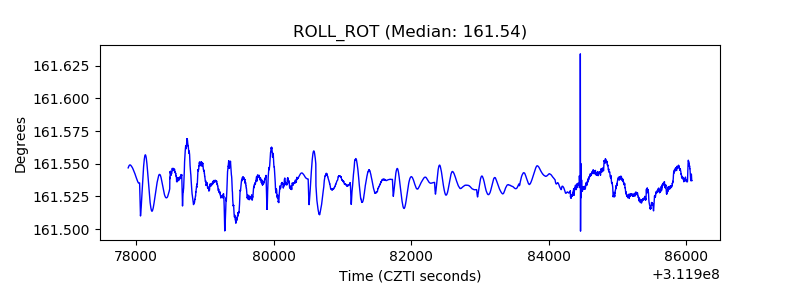 |
| _Roll_DEC | 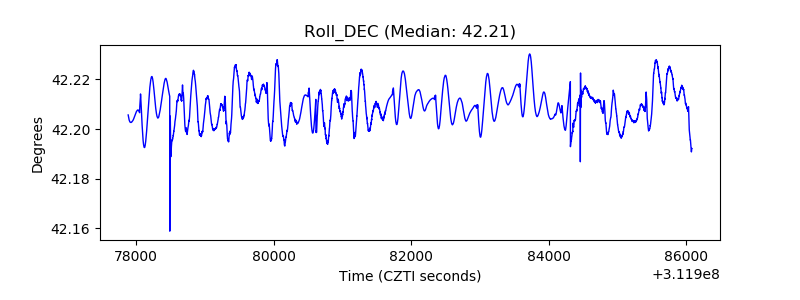 |
| _Roll_RA | 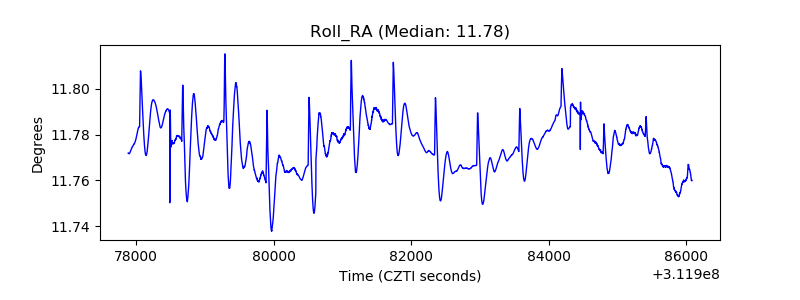 |
| Veto Counter | 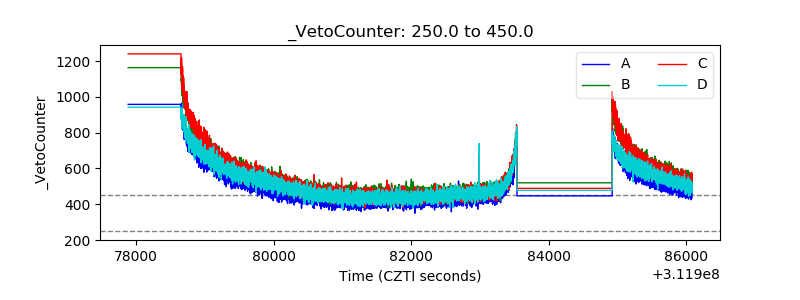 |