| Param | Original file | Final file |
|---|---|---|
| Filename | modeM0/AS1A07_007T03_9000003320_22422cztM0_level2.evt | modeM0/AS1A07_007T03_9000003320_22422cztM0_level2_quad_clean.evt |
| Size (bytes) | 129,758,400 | 35,328,960 |
| Size | 123.7 MB | 33.7 MB |
| Events in quadrant A | 790,377 | 246,627 |
| Events in quadrant B | 820,852 | 254,813 |
| Events in quadrant C | 894,849 | 237,342 |
| Events in quadrant D | 1,317,178 | 217,678 |
| Mode SS | |||
|---|---|---|---|
| Quadrant | BADHDUFLAG | Total packets | Discarded packets |
| A | 0 | 30 | 0 |
| B | 0 | 30 | 0 |
| C | 0 | 30 | 0 |
| D | 0 | 30 | 0 |
| Mode M9 | |||
|---|---|---|---|
| Quadrant | BADHDUFLAG | Total packets | Discarded packets |
| A | 0 | 6 | 0 |
| B | 0 | 7 | 0 |
| C | 0 | 7 | 0 |
| D | 0 | 7 | 0 |
| Mode M0 | |||
|---|---|---|---|
| Quadrant | BADHDUFLAG | Total packets | Discarded packets |
| A | 0 | 3237 | 1 |
| B | 0 | 3336 | 1 |
| C | 0 | 3555 | 1 |
| D | 0 | 4932 | 1 |
| Quadrant | Total seconds | Saturated seconds | Saturation percentage |
|---|---|---|---|
| A | 1531 | 3 | 0.195950% |
| B | 1531 | 2 | 0.130634% |
| C | 1531 | 52 | 3.396473% |
| D | 1531 | 139 | 9.079033% |
Noise dominated data is calculated using 1-second bins in cleaned event files. If a bin has >2000 counts, and if more than 50% of those come from <1% of pixels, then it is considered to be noise-dominated and hence unusable.
| Quadrant | # 1 sec bins | Bins with >0 counts | Bins with >2000 counts | High rate bins dominated by noise | Noise dominated (total time) | Noise dominated (detector-on time) | Marked lightcurve |
|---|---|---|---|---|---|---|---|
| A | 1531 | 1531 | 0 | 0 | 0.00% | 0.00% | 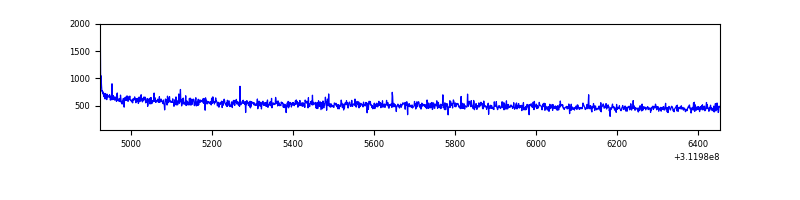 |
| B | 1531 | 1531 | 0 | 0 | 0.00% | 0.00% | 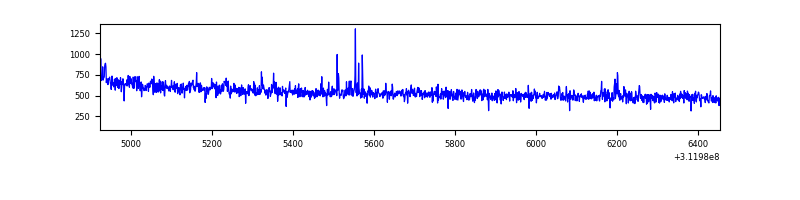 |
| C | 1531 | 1531 | 22 | 22 | 1.44% | 1.44% | 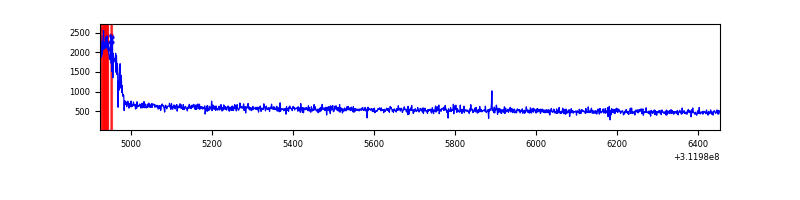 |
| D | 1531 | 1531 | 126 | 126 | 8.23% | 8.23% | 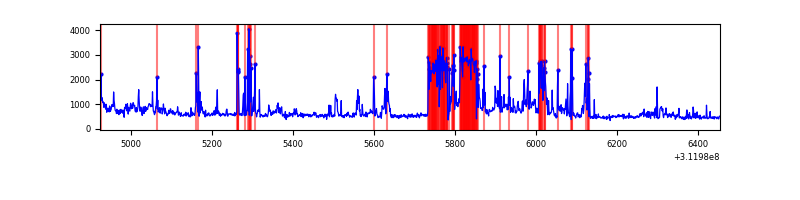 |
Top three noisy pixels from each quadrant. If the there are fewer than three noisy pixels in the level2.evt file, extra rows are filled as -1
| Pixel properties | Quadrant properties | ||||||
|---|---|---|---|---|---|---|---|
| Quadrant | DetID | PixID | Counts | Sigma | Mean | Median | Sigma |
| A | 15 | 174 | 3765 | 84.87 | 203 | 200 | 42.0 |
| A | 15 | 48 | 2828 | 62.56 | 203 | 200 | 42.0 |
| A | 13 | 254 | 2646 | 58.23 | 203 | 200 | 42.0 |
| B | 3 | 64 | 5414 | 131.21 | 206 | 202 | 39.7 |
| B | 0 | 229 | 4442 | 106.74 | 206 | 202 | 39.7 |
| B | 12 | 111 | 4068 | 97.33 | 206 | 202 | 39.7 |
| C | 0 | 10 | 78708 | 1638.15 | 199 | 200 | 47.9 |
| C | 14 | 238 | 31805 | 659.47 | 199 | 200 | 47.9 |
| C | 1 | 16 | 6169 | 124.55 | 199 | 200 | 47.9 |
| D | 13 | 172 | 472262 | 10025.05 | 190 | 184 | 47.1 |
| D | 1 | 52 | 101845 | 2158.87 | 190 | 184 | 47.1 |
| D | 2 | 136 | 10177 | 212.21 | 190 | 184 | 47.1 |
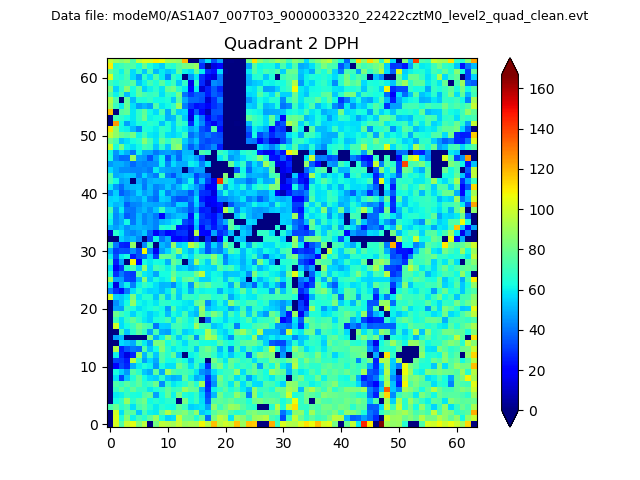
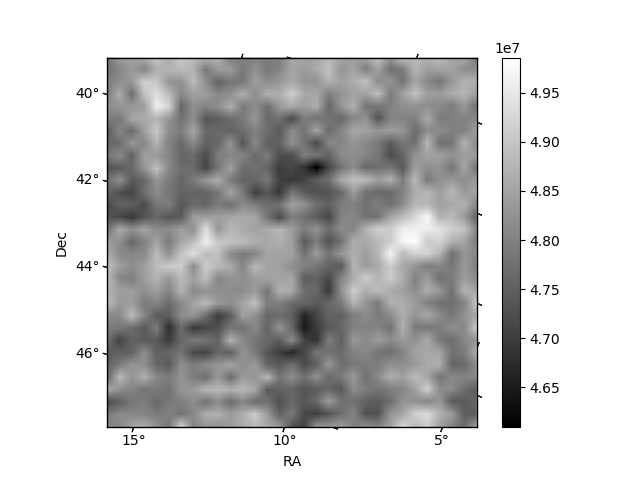
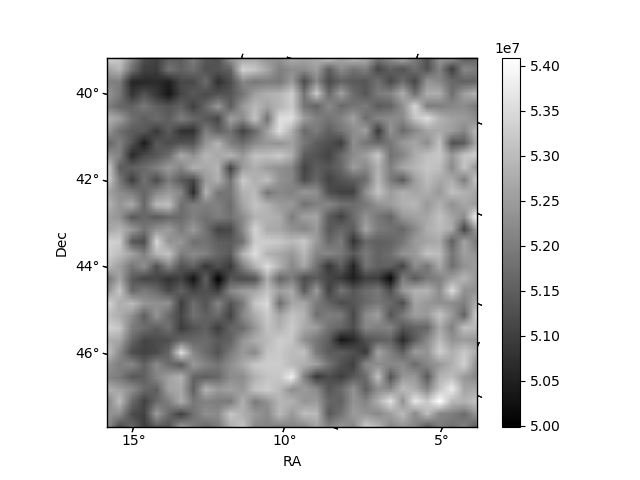
Histogram calculated using DETX and DETY for each event in the final _common_clean file
| Quadrant A | 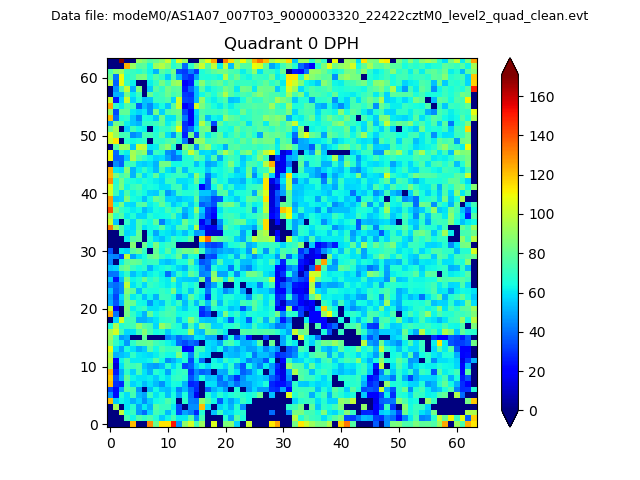 |
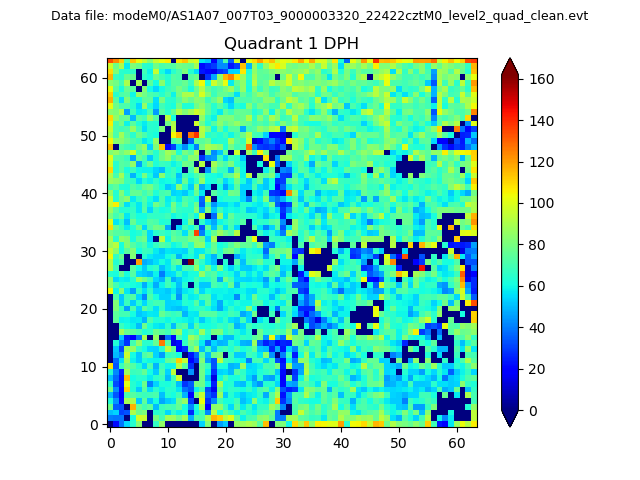 |
Quadrant B |
|---|---|---|---|
| Quadrant D | 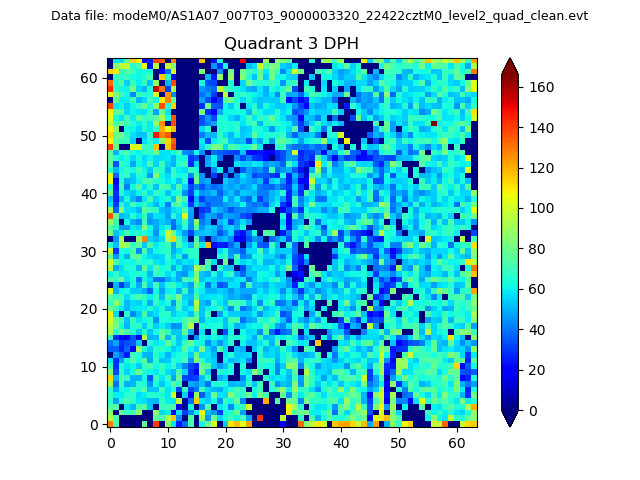 |
 |
Quadrant C |
| Plot type | Count rate plots | Images |
|---|---|---|
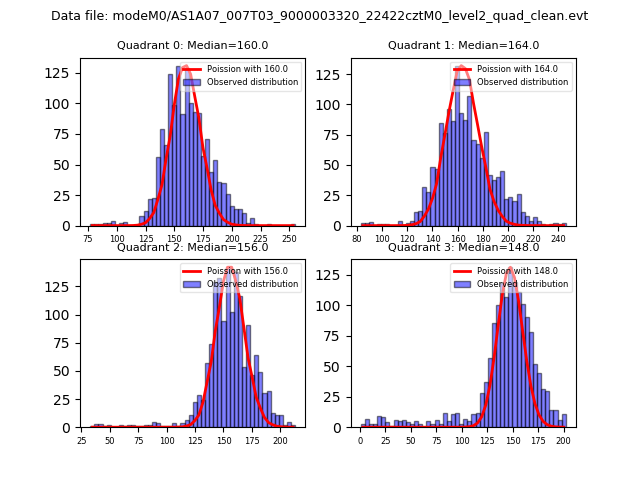
| Comparison with Poisson distribution Blue bars denote a histogram of data divided into 1 sec bins. Red curve is a Poisson curve with rate = median count rate of data. |
 |
 |
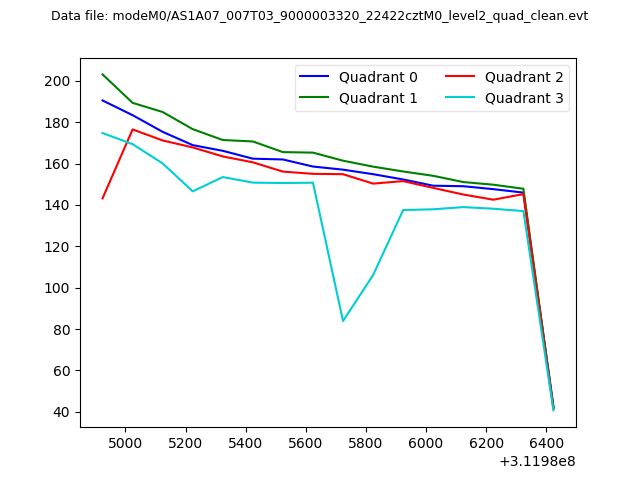
| Quadrant-wise count rates Data is divided into 100 sec bins |
 |
|
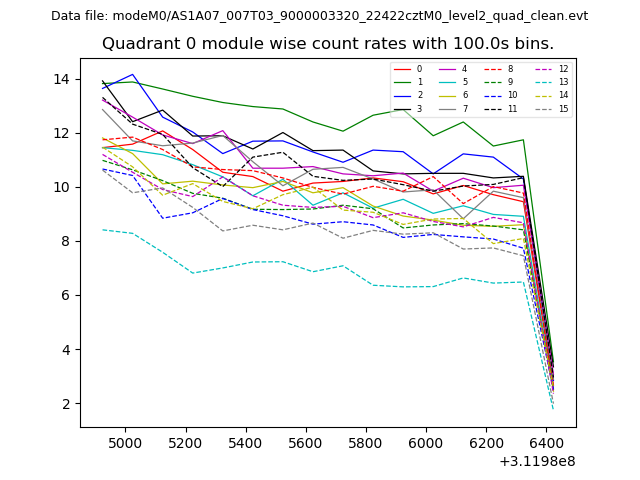
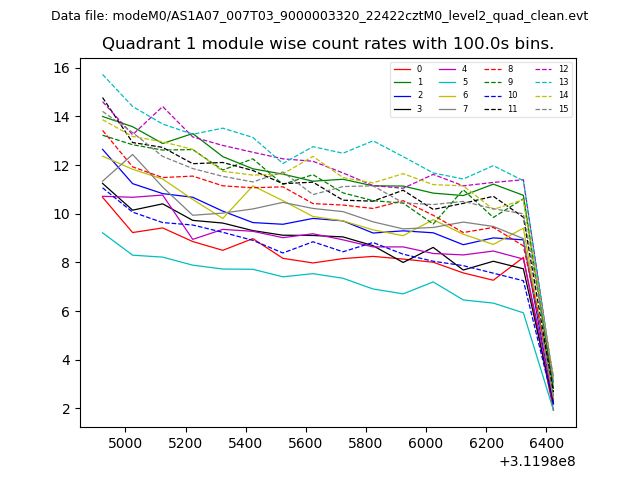
| Module-wise count rates for Quadrant A Data is divided into 100 sec bins |
 |
 |
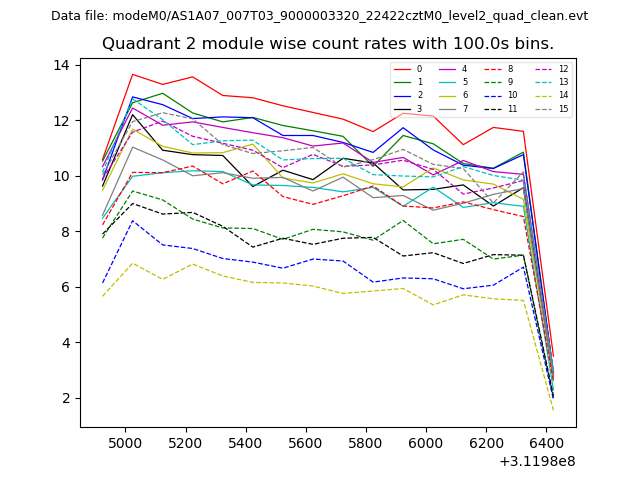
| Module-wise count rates for Quadrant B Data is divided into 100 sec bins |
 |
 |
| Module-wise count rates for Quadrant C Data is divided into 100 sec bins |
 |
 |
| Module-wise count rates for Quadrant D Data is divided into 100 sec bins |
 |
 |
| Parameter | Plot |
|---|---|
| CZT HV Monitor | 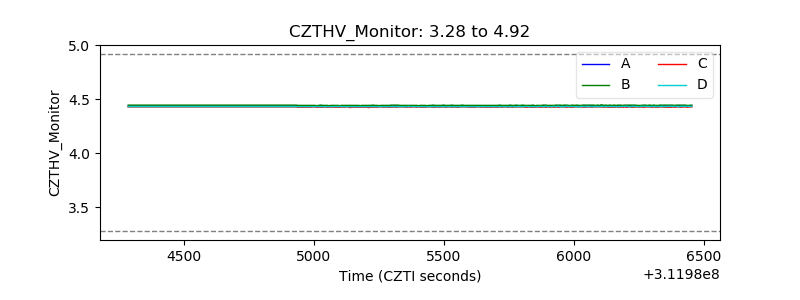 |
| D_VDD | 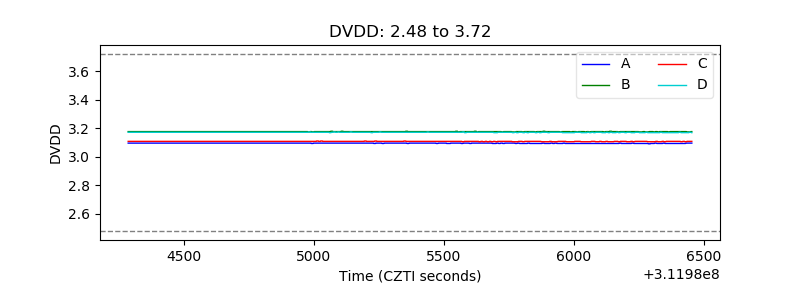 |
| Temperature 1 | 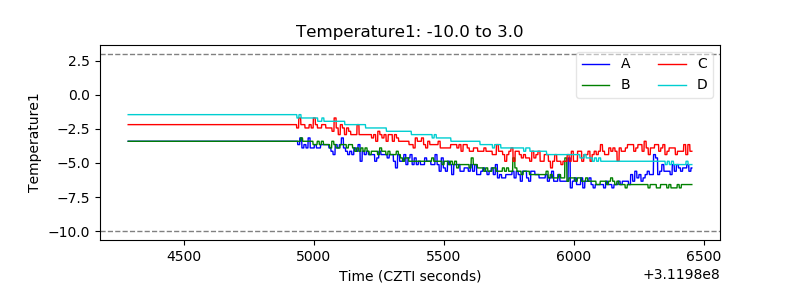 |
| Veto HV Monitor | 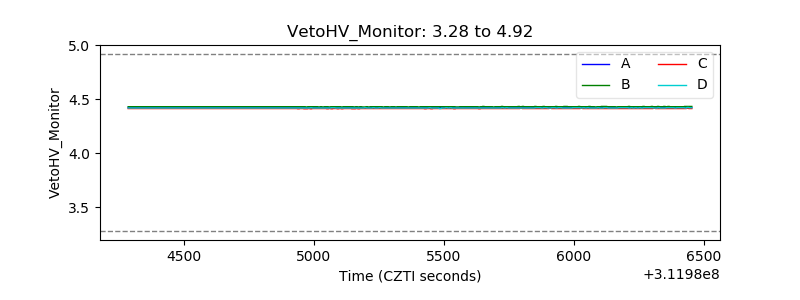 |
| Veto LLD | 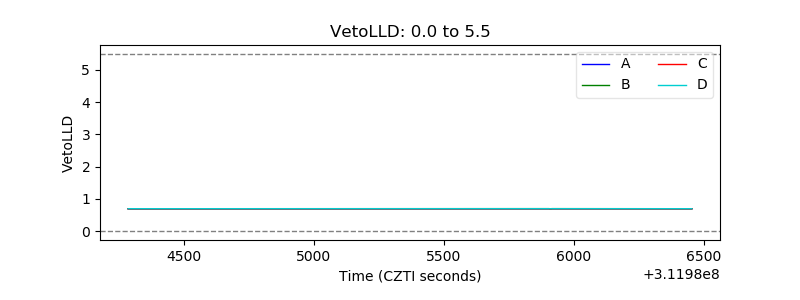 |
| Alpha Counter | 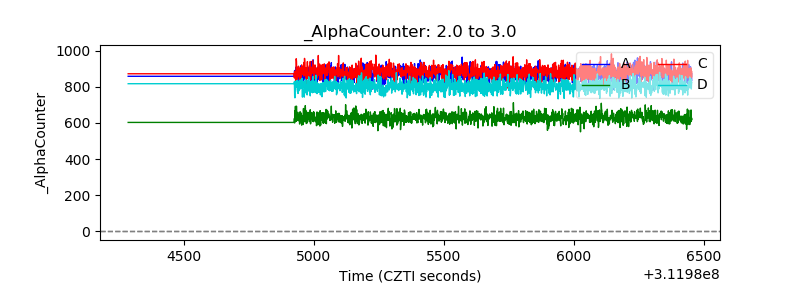 |
| _CPM_Rate | 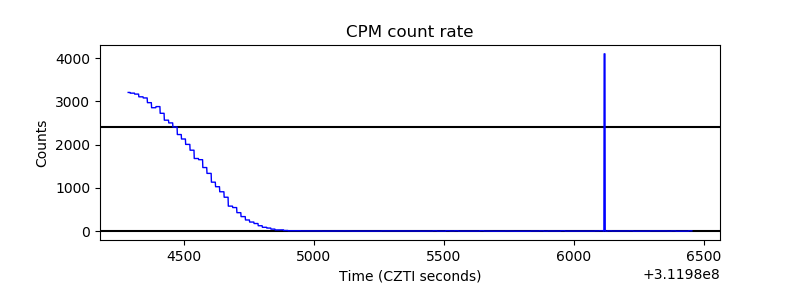 |
| CZT Counter | 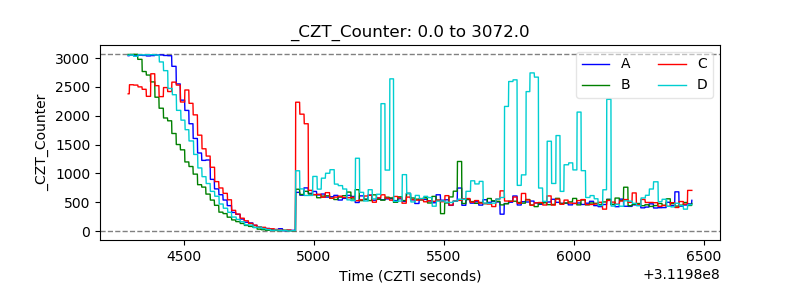 |
| +2.5 Volts monitor |  |
| +5 Volts monitor | 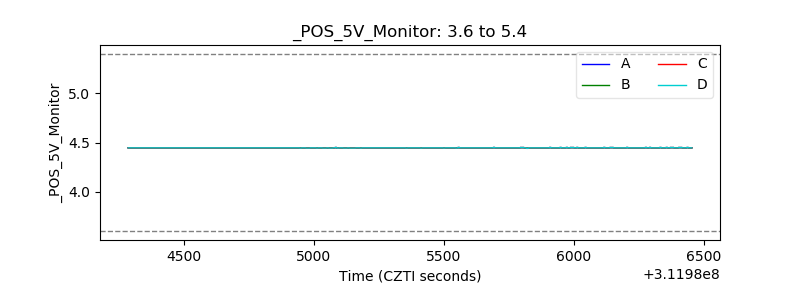 |
| _ROLL_ROT | 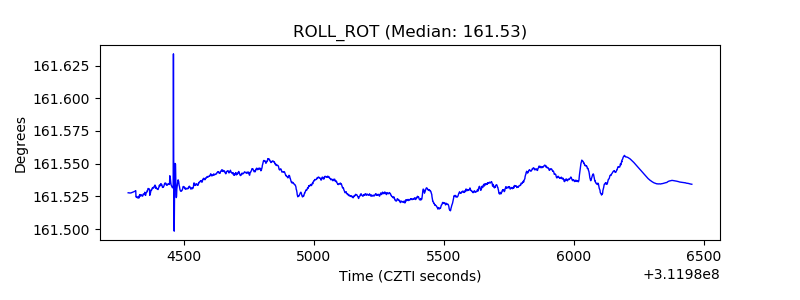 |
| _Roll_DEC |  |
| _Roll_RA | 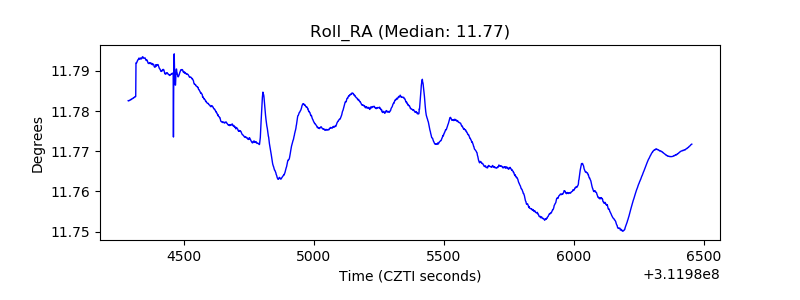 |
| Veto Counter | 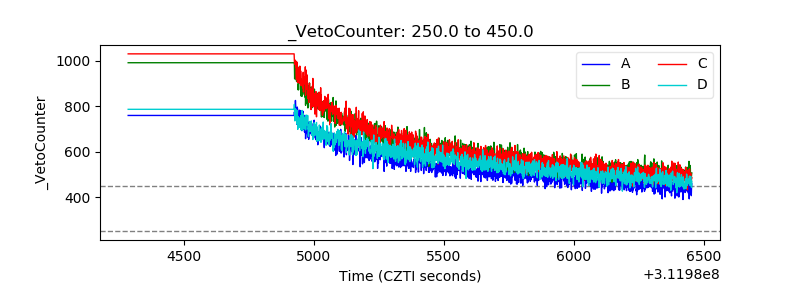 |