| Param | Original file | Final file |
|---|---|---|
| Filename | modeM0/AS1T03_149T01_9000003314cztM0_level2.fits | modeM0/AS1T03_149T01_9000003314cztM0_level2_quad_clean.evt |
| Size (bytes) | 48,024,000 | 33,874,560 |
| Size | 45.8 MB | 32.3 MB |
| Events in quadrant A | 286,528 | 171,547 |
| Events in quadrant B | 278,176 | 172,655 |
| Events in quadrant C | 281,984 | 163,930 |
| Events in quadrant D | 243,774 | 152,484 |
| Mode M0 | |||
|---|---|---|---|
| Quadrant | BADHDUFLAG | Total packets | Discarded packets |
| A | 0 | 10408 | 0 |
| B | 0 | 10662 | 0 |
| C | 0 | 10410 | 0 |
| D | 0 | 12765 | 0 |
| Mode SS | |||
|---|---|---|---|
| Quadrant | BADHDUFLAG | Total packets | Discarded packets |
| A | 0 | 104 | 0 |
| B | 0 | 104 | 0 |
| C | 0 | 104 | 0 |
| D | 0 | 104 | 0 |
| Quadrant | Total seconds | Saturated seconds | Saturation percentage |
|---|---|---|---|
| A | 5196 | 2 | 0.038491% |
| B | 5196 | 5 | 0.096228% |
| C | 5196 | 14 | 0.269438% |
| D | 5196 | 88 | 1.693610% |
Noise dominated data is calculated using 1-second bins in cleaned event files. If a bin has >2000 counts, and if more than 50% of those come from <1% of pixels, then it is considered to be noise-dominated and hence unusable.
| Quadrant | # 1 sec bins | Bins with >0 counts | Bins with >2000 counts | High rate bins dominated by noise | Noise dominated (total time) | Noise dominated (detector-on time) | Marked lightcurve |
|---|---|---|---|---|---|---|---|
| A | 5196 | 5196 | 0 | 0 | 0.00% | 0.00% |  |
| B | 5196 | 5196 | 0 | 0 | 0.00% | 0.00% |  |
| C | 5196 | 5196 | 0 | 0 | 0.00% | 0.00% |  |
| D | 5196 | 5196 | 0 | 0 | 0.00% | 0.00% |  |
Top three noisy pixels from each quadrant. If the there are fewer than three noisy pixels in the level2.evt file, extra rows are filled as -1
| Pixel properties | Quadrant properties | ||||||
|---|---|---|---|---|---|---|---|
| Quadrant | DetID | PixID | Counts | Sigma | Mean | Median | Sigma |
| A | 0 | 29 | 295 | 11.0 | 74 | 70 | 20.4 |
| A | 7 | 110 | 239 | 8.27 | 74 | 70 | 20.4 |
| A | 0 | 30 | 223 | 7.48 | 74 | 70 | 20.4 |
| B | 2 | 9 | 231 | 9.45 | 73 | 70 | 17.0 |
| B | 5 | 225 | 193 | 7.22 | 73 | 70 | 17.0 |
| B | 10 | 128 | 185 | 6.75 | 73 | 70 | 17.0 |
| C | 1 | 81 | 241 | 8.16 | 74 | 69 | 21.1 |
| C | 1 | 80 | 225 | 7.4 | 74 | 69 | 21.1 |
| C | 3 | 234 | 222 | 7.26 | 74 | 69 | 21.1 |
| D | 3 | 14 | 186 | 5.94 | 69 | 63 | 20.7 |
| D | 10 | 189 | 184 | 5.84 | 69 | 63 | 20.7 |
| D | 12 | 235 | 178 | 5.55 | 69 | 63 | 20.7 |
Histogram calculated using DETX and DETY for each event in the final _common_clean file
| Quadrant A | 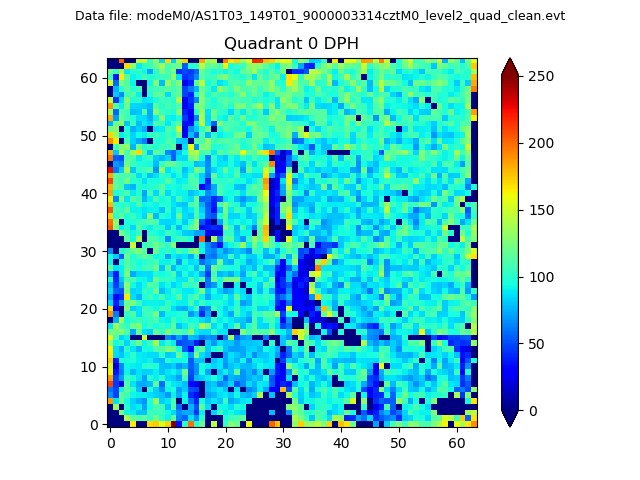 |
 |
Quadrant B |
|---|---|---|---|
| Quadrant D |  |
 |
Quadrant C |
| Plot type | Count rate plots | Images |
|---|---|---|
| Comparison with Poisson distribution Blue bars denote a histogram of data divided into 1 sec bins. Red curve is a Poisson curve with rate = median count rate of data. |
 |
 |
| Quadrant-wise count rates Data is divided into 100 sec bins |
 |
|
| Module-wise count rates for Quadrant A Data is divided into 100 sec bins |
 |
 |
| Module-wise count rates for Quadrant B Data is divided into 100 sec bins |
 |
 |
| Module-wise count rates for Quadrant C Data is divided into 100 sec bins |
 |
 |
| Module-wise count rates for Quadrant D Data is divided into 100 sec bins |
 |
 |
| Parameter | Plot |
|---|---|
| CZT HV Monitor |  |
| D_VDD | 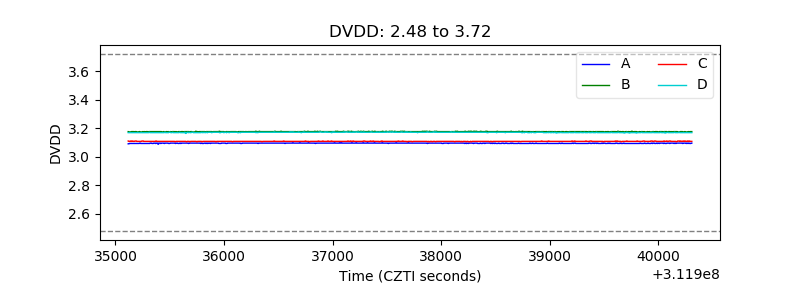 |
| Temperature 1 |  |
| Veto HV Monitor |  |
| Veto LLD |  |
| Alpha Counter |  |
| _CPM_Rate |  |
| CZT Counter |  |
| +2.5 Volts monitor |  |
| +5 Volts monitor |  |
| _ROLL_ROT | 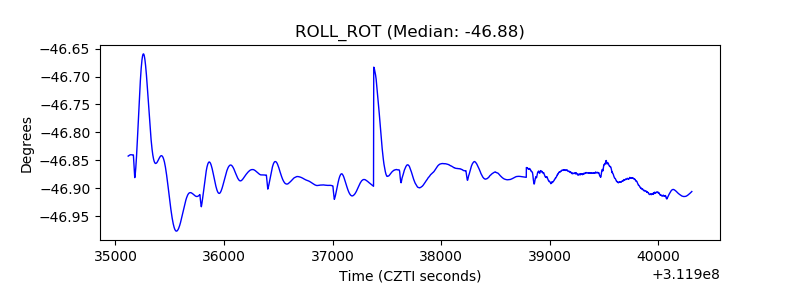 |
| _Roll_DEC |  |
| _Roll_RA | 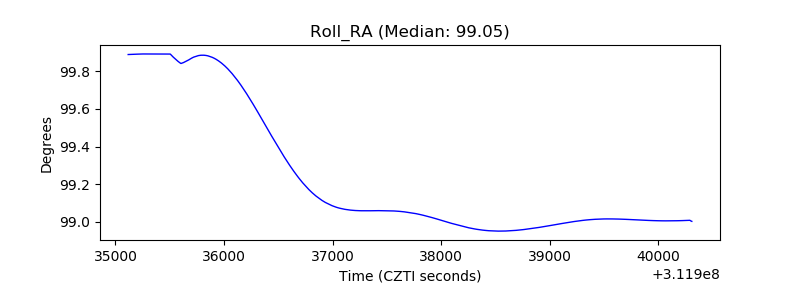 |
| Veto Counter |  |