| Param | Original file | Final file |
|---|---|---|
| Filename | modeM0/AS1T03_149T01_9000003314_22412cztM0_level2.evt | modeM0/AS1T03_149T01_9000003314_22412cztM0_level2_quad_clean.evt |
| Size (bytes) | 62,029,440 | 6,497,280 |
| Size | 59.2 MB | 6.2 MB |
| Events in quadrant A | 442,213 | 30,456 |
| Events in quadrant B | 450,317 | 31,264 |
| Events in quadrant C | 458,777 | 29,410 |
| Events in quadrant D | 457,079 | 29,125 |
| Mode M0 | |||
|---|---|---|---|
| Quadrant | BADHDUFLAG | Total packets | Discarded packets |
| A | 0 | 1965 | 0 |
| B | 0 | 1968 | 0 |
| C | 0 | 1970 | 0 |
| D | 0 | 2007 | 1 |
| Mode SS | |||
|---|---|---|---|
| Quadrant | BADHDUFLAG | Total packets | Discarded packets |
| A | 0 | 20 | 0 |
| B | 0 | 20 | 0 |
| C | 0 | 20 | 0 |
| D | 0 | 20 | 0 |
| Quadrant | Total seconds | Saturated seconds | Saturation percentage |
|---|---|---|---|
| A | 981 | 1 | 0.101937% |
| B | 981 | 1 | 0.101937% |
| C | 981 | 6 | 0.611621% |
| D | 980 | 1 | 0.102041% |
Noise dominated data is calculated using 1-second bins in cleaned event files. If a bin has >2000 counts, and if more than 50% of those come from <1% of pixels, then it is considered to be noise-dominated and hence unusable.
| Quadrant | # 1 sec bins | Bins with >0 counts | Bins with >2000 counts | High rate bins dominated by noise | Noise dominated (total time) | Noise dominated (detector-on time) | Marked lightcurve |
|---|---|---|---|---|---|---|---|
| A | 981 | 981 | 0 | 0 | 0.00% | 0.00% | 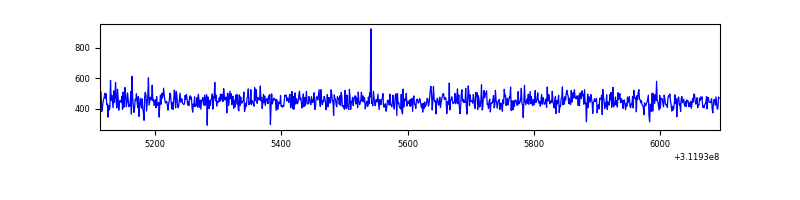 |
| B | 981 | 981 | 0 | 0 | 0.00% | 0.00% | 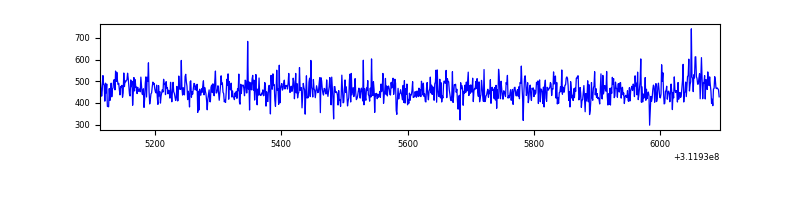 |
| C | 981 | 981 | 0 | 0 | 0.00% | 0.00% | 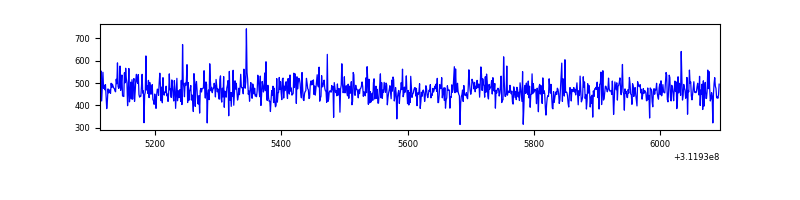 |
| D | 980 | 980 | 1 | 1 | 0.10% | 0.10% |  |
Top three noisy pixels from each quadrant. If the there are fewer than three noisy pixels in the level2.evt file, extra rows are filled as -1
| Pixel properties | Quadrant properties | ||||||
|---|---|---|---|---|---|---|---|
| Quadrant | DetID | PixID | Counts | Sigma | Mean | Median | Sigma |
| A | 13 | 254 | 1380 | 50.11 | 114 | 111 | 25.3 |
| A | 3 | 137 | 1013 | 35.62 | 114 | 111 | 25.3 |
| A | 0 | 226 | 986 | 34.55 | 114 | 111 | 25.3 |
| B | 0 | 244 | 2869 | 114.2 | 114 | 111 | 24.2 |
| B | 12 | 111 | 2704 | 107.37 | 114 | 111 | 24.2 |
| B | 11 | 111 | 2403 | 94.9 | 114 | 111 | 24.2 |
| C | 14 | 238 | 18619 | 661.13 | 112 | 112 | 28.0 |
| C | 10 | 22 | 1962 | 66.09 | 112 | 112 | 28.0 |
| C | 13 | 61 | 718 | 21.65 | 112 | 112 | 28.0 |
| D | 1 | 52 | 20081 | 681.85 | 114 | 110 | 29.3 |
| D | 13 | 104 | 4782 | 159.51 | 114 | 110 | 29.3 |
| D | 2 | 234 | 4256 | 141.55 | 114 | 110 | 29.3 |
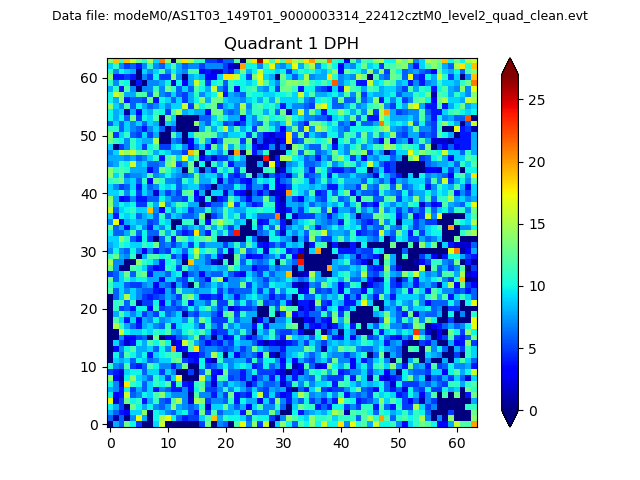
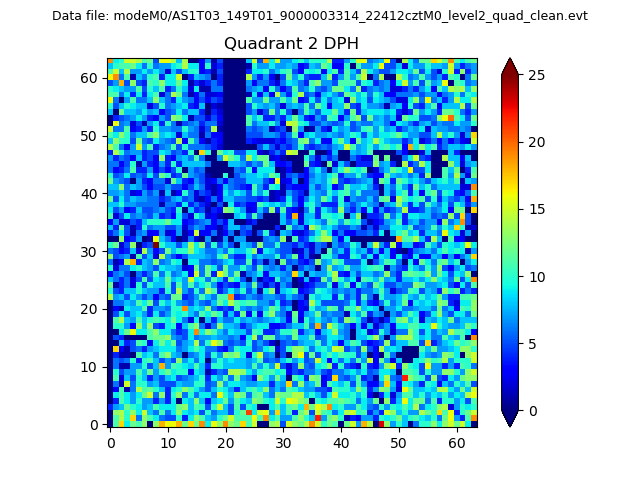
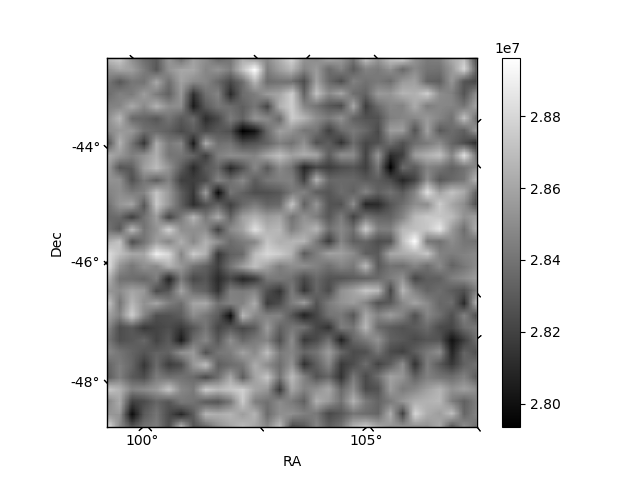
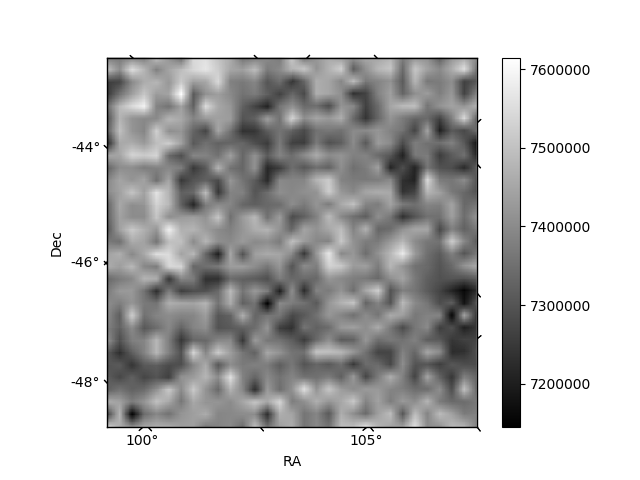
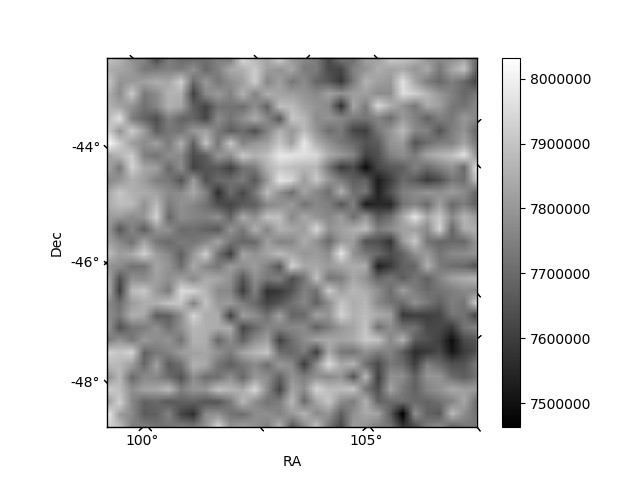
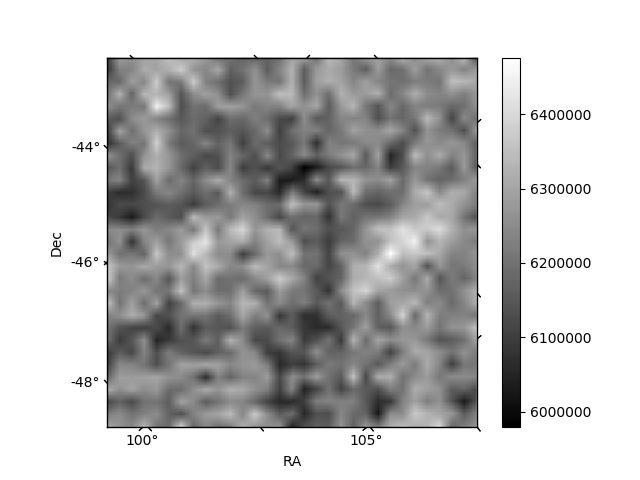
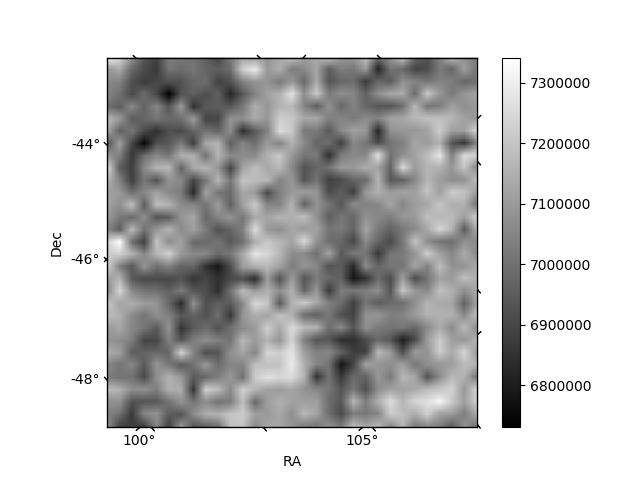
Histogram calculated using DETX and DETY for each event in the final _common_clean file
| Quadrant A | 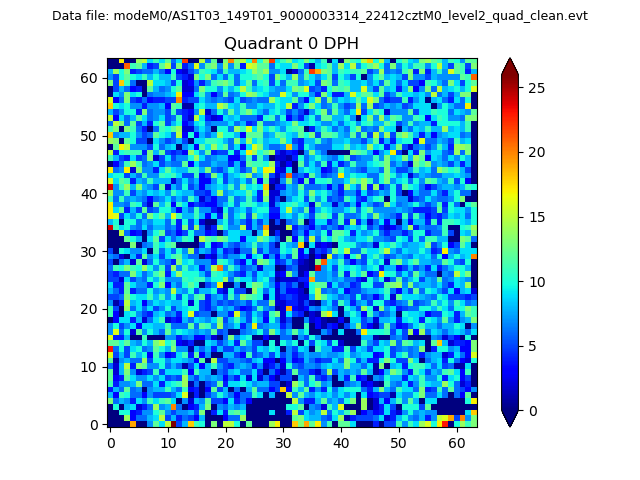 |
 |
Quadrant B |
|---|---|---|---|
| Quadrant D | 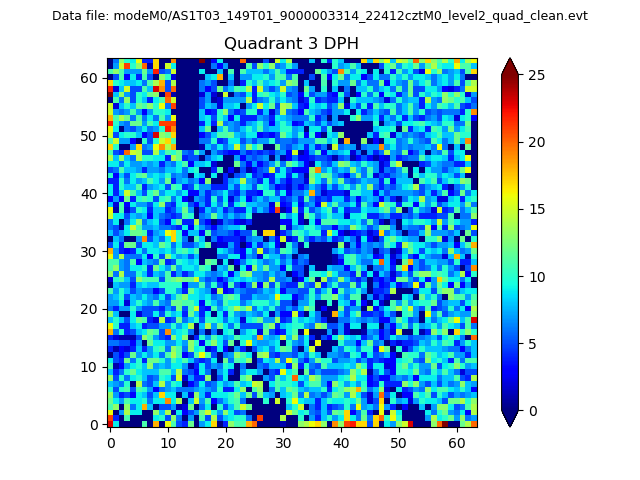 |
 |
Quadrant C |
| Plot type | Count rate plots | Images |
|---|---|---|
| Comparison with Poisson distribution Blue bars denote a histogram of data divided into 1 sec bins. Red curve is a Poisson curve with rate = median count rate of data. |
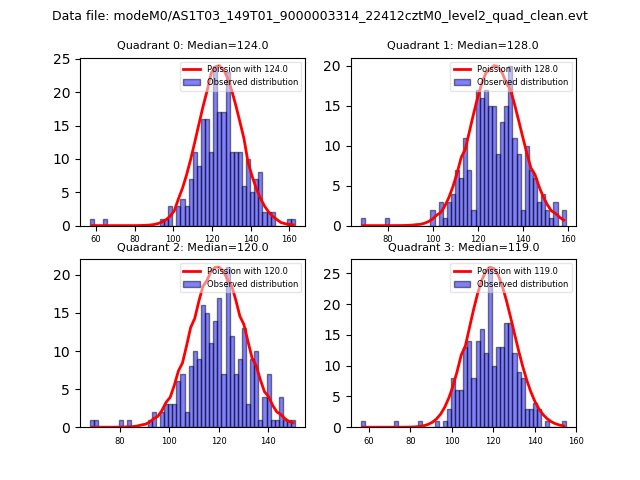 |
 |
| Quadrant-wise count rates Data is divided into 100 sec bins |
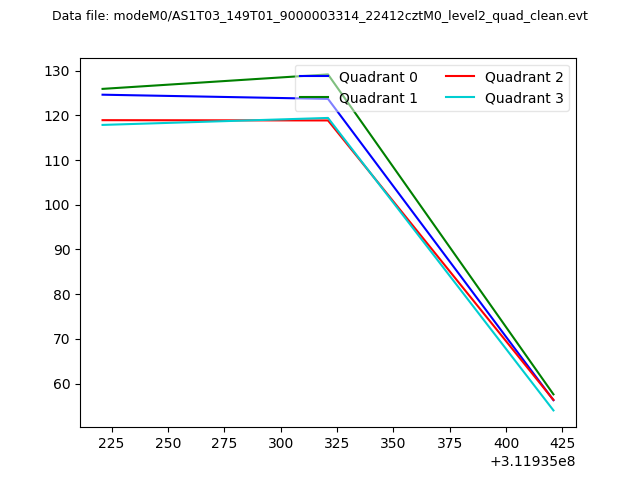 |
|
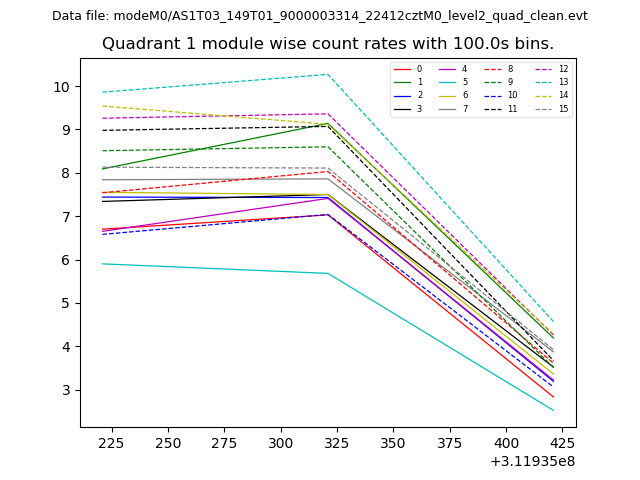
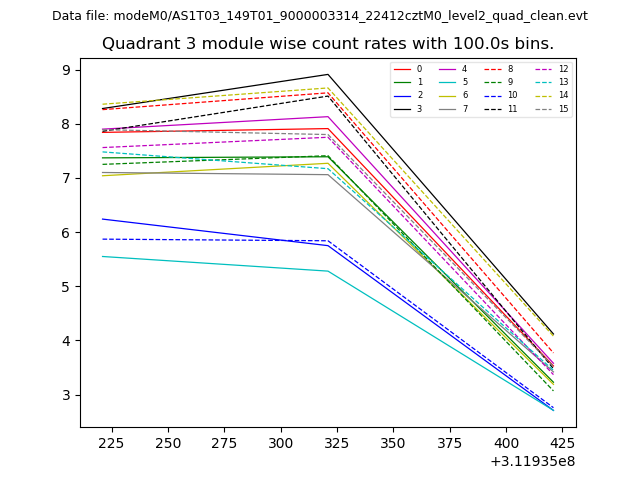
| Module-wise count rates for Quadrant A Data is divided into 100 sec bins |
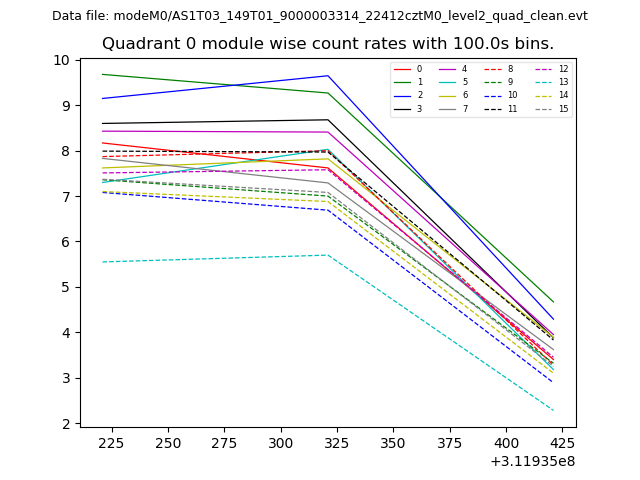 |
 |
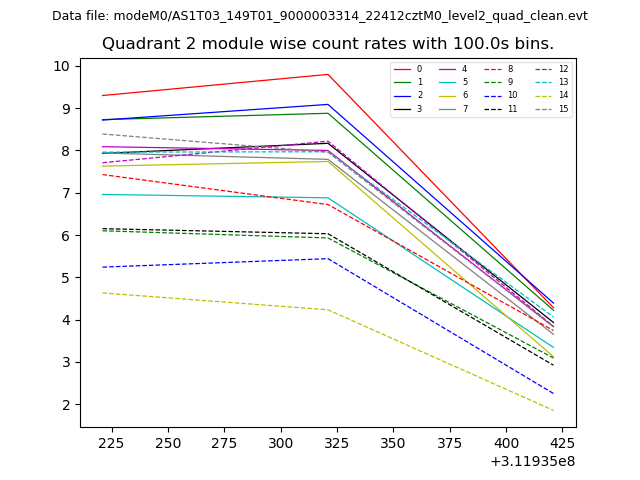
| Module-wise count rates for Quadrant B Data is divided into 100 sec bins |
 |
 |
| Module-wise count rates for Quadrant C Data is divided into 100 sec bins |
 |
 |
| Module-wise count rates for Quadrant D Data is divided into 100 sec bins |
 |
 |
| Parameter | Plot |
|---|---|
| CZT HV Monitor | 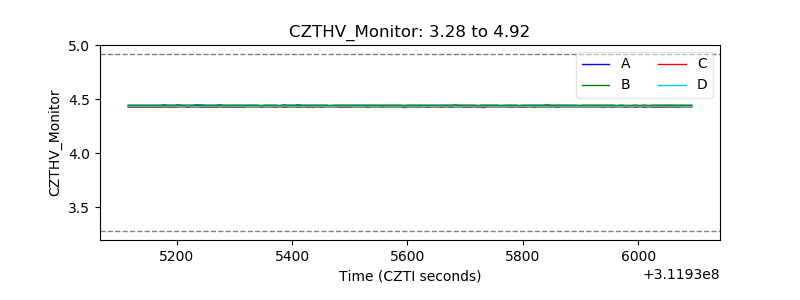 |
| D_VDD | 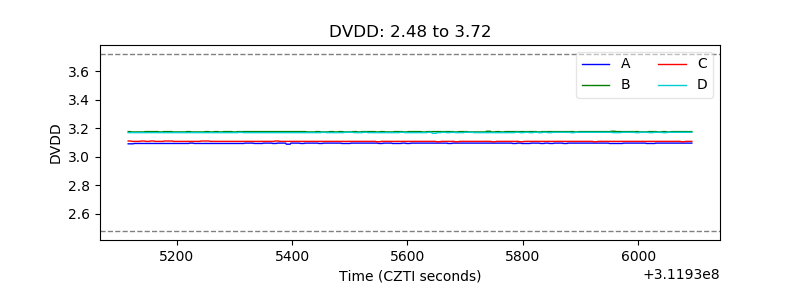 |
| Temperature 1 | 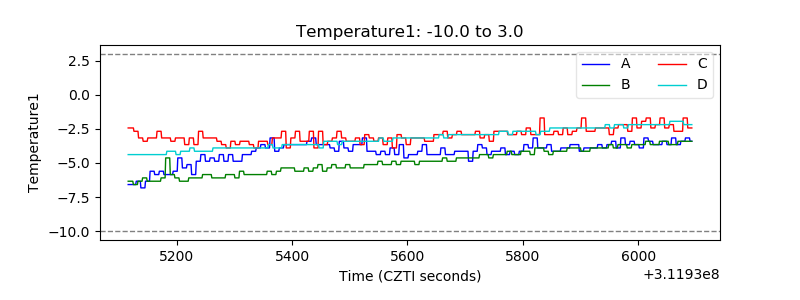 |
| Veto HV Monitor | 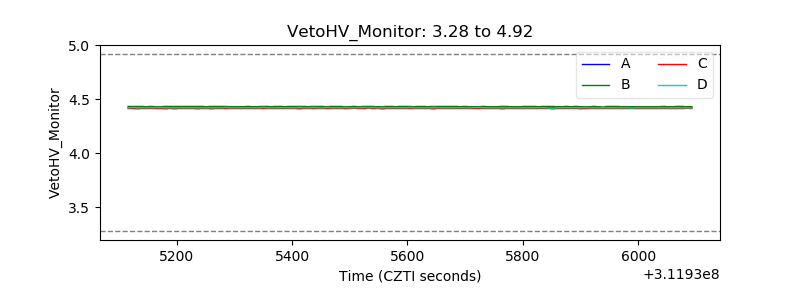 |
| Veto LLD | 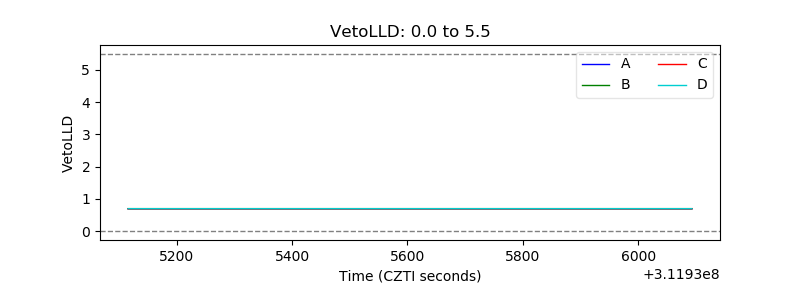 |
| Alpha Counter | 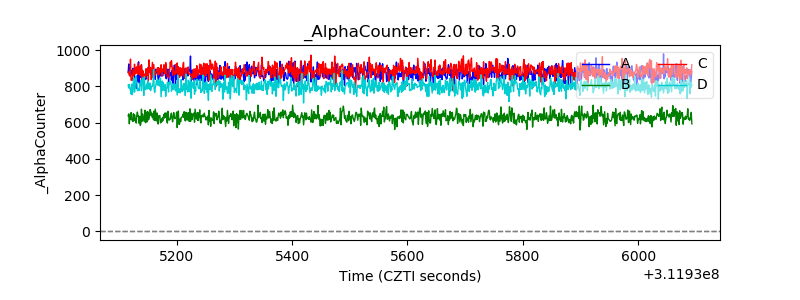 |
| _CPM_Rate | 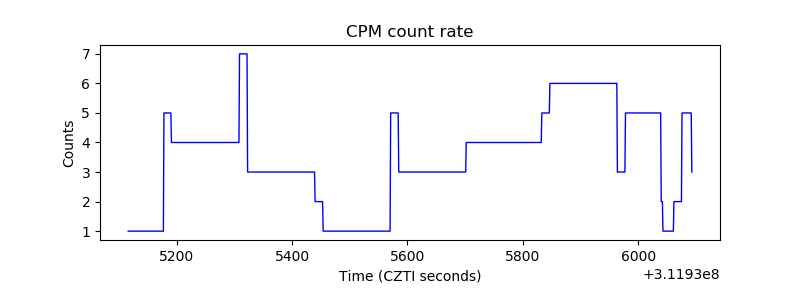 |
| CZT Counter | 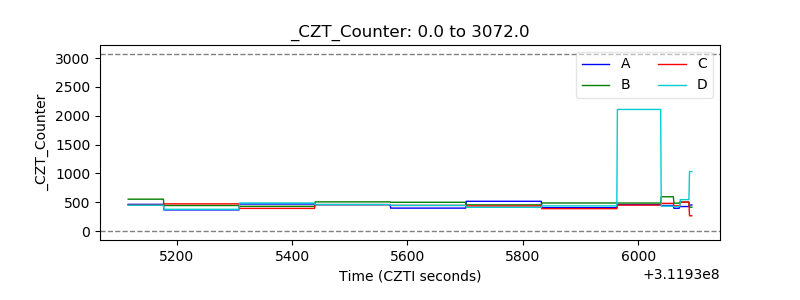 |
| +2.5 Volts monitor |  |
| +5 Volts monitor |  |
| _ROLL_ROT | 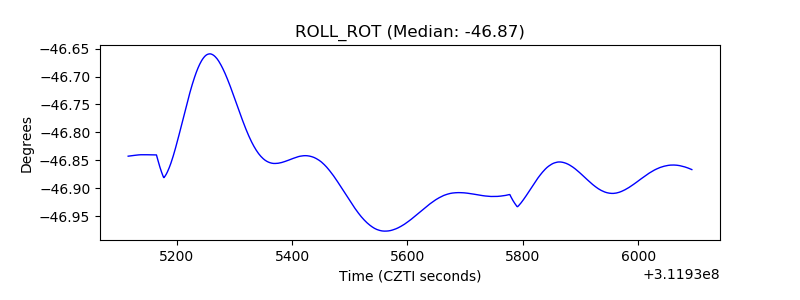 |
| _Roll_DEC | 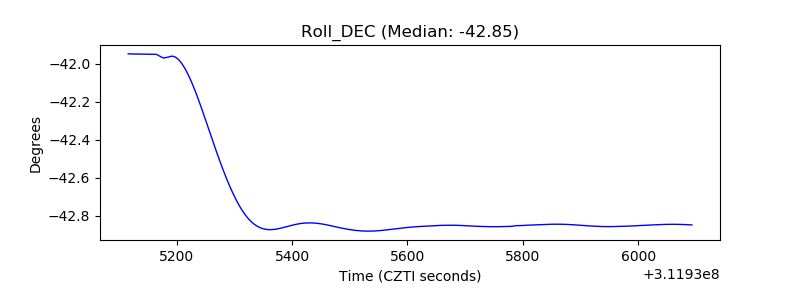 |
| _Roll_RA | 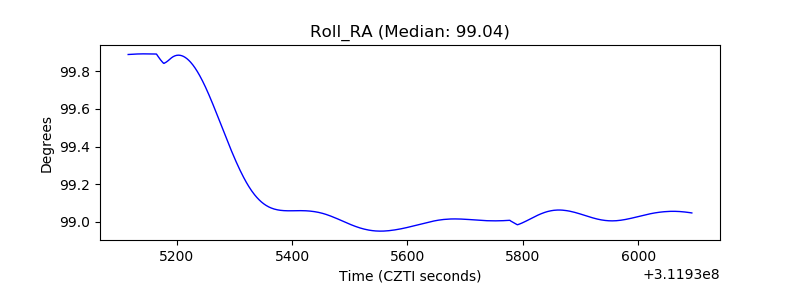 |
| Veto Counter | 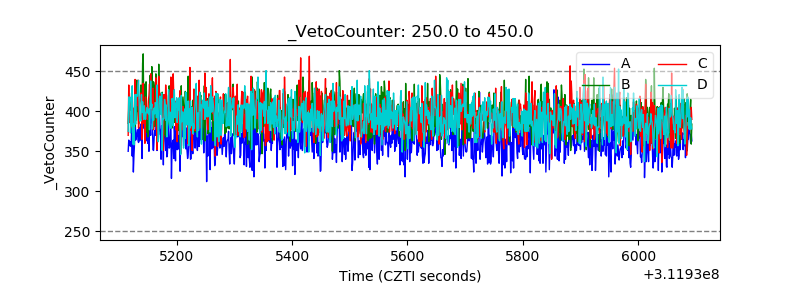 |