| Param | Original file | Final file |
|---|---|---|
| Filename | modeM0/AS1T03_149T01_9000003314_22415cztM0_level2.evt | modeM0/AS1T03_149T01_9000003314_22415cztM0_level2_quad_clean.evt |
| Size (bytes) | 348,834,240 | 62,994,240 |
| Size | 332.7 MB | 60.1 MB |
| Events in quadrant A | 2,295,701 | 393,325 |
| Events in quadrant B | 2,439,221 | 398,354 |
| Events in quadrant C | 2,336,856 | 380,370 |
| Events in quadrant D | 3,138,686 | 371,232 |
| Mode M0 | |||
|---|---|---|---|
| Quadrant | BADHDUFLAG | Total packets | Discarded packets |
| A | 0 | 10408 | 0 |
| B | 0 | 10662 | 0 |
| C | 0 | 10410 | 0 |
| D | 0 | 12765 | 0 |
| Mode SS | |||
|---|---|---|---|
| Quadrant | BADHDUFLAG | Total packets | Discarded packets |
| A | 0 | 104 | 0 |
| B | 0 | 104 | 0 |
| C | 0 | 104 | 0 |
| D | 0 | 104 | 0 |
| Quadrant | Total seconds | Saturated seconds | Saturation percentage |
|---|---|---|---|
| A | 5196 | 2 | 0.038491% |
| B | 5196 | 5 | 0.096228% |
| C | 5196 | 14 | 0.269438% |
| D | 5196 | 88 | 1.693610% |
Noise dominated data is calculated using 1-second bins in cleaned event files. If a bin has >2000 counts, and if more than 50% of those come from <1% of pixels, then it is considered to be noise-dominated and hence unusable.
| Quadrant | # 1 sec bins | Bins with >0 counts | Bins with >2000 counts | High rate bins dominated by noise | Noise dominated (total time) | Noise dominated (detector-on time) | Marked lightcurve |
|---|---|---|---|---|---|---|---|
| A | 5196 | 5196 | 0 | 0 | 0.00% | 0.00% |  |
| B | 5196 | 5196 | 3 | 3 | 0.06% | 0.06% |  |
| C | 5196 | 5196 | 0 | 0 | 0.00% | 0.00% | 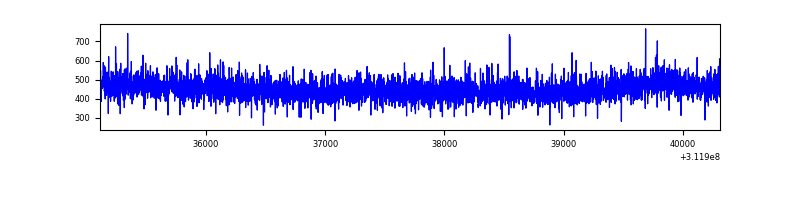 |
| D | 5196 | 5196 | 91 | 91 | 1.75% | 1.75% |  |
Top three noisy pixels from each quadrant. If the there are fewer than three noisy pixels in the level2.evt file, extra rows are filled as -1
| Pixel properties | Quadrant properties | ||||||
|---|---|---|---|---|---|---|---|
| Quadrant | DetID | PixID | Counts | Sigma | Mean | Median | Sigma |
| A | 13 | 254 | 8195 | 63.17 | 594 | 580 | 120.6 |
| A | 3 | 137 | 5211 | 38.41 | 594 | 580 | 120.6 |
| A | 0 | 226 | 5091 | 37.42 | 594 | 580 | 120.6 |
| B | 15 | 33 | 45589 | 392.68 | 597 | 582 | 114.6 |
| B | 3 | 64 | 20223 | 171.37 | 597 | 582 | 114.6 |
| B | 0 | 197 | 15050 | 126.23 | 597 | 582 | 114.6 |
| C | 14 | 238 | 90273 | 658.39 | 575 | 577 | 136.2 |
| C | 10 | 22 | 4943 | 32.05 | 575 | 577 | 136.2 |
| C | 13 | 61 | 3952 | 24.77 | 575 | 577 | 136.2 |
| D | 1 | 52 | 604813 | 4307.84 | 577 | 559 | 140.3 |
| D | 7 | 223 | 169723 | 1206.0 | 577 | 559 | 140.3 |
| D | 13 | 104 | 107714 | 763.93 | 577 | 559 | 140.3 |
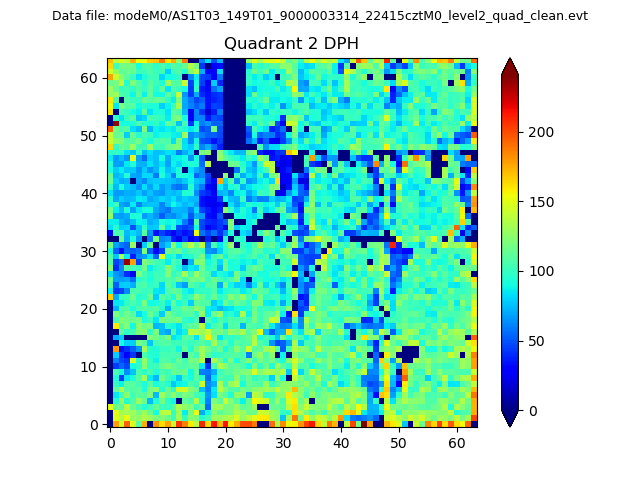
Histogram calculated using DETX and DETY for each event in the final _common_clean file
| Quadrant A | 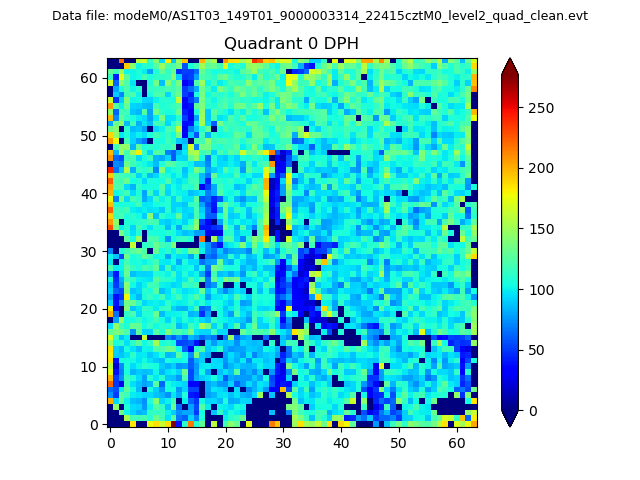 |
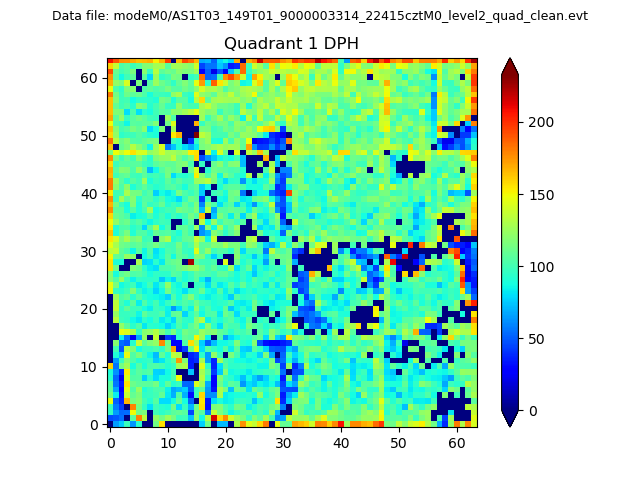 |
Quadrant B |
|---|---|---|---|
| Quadrant D | 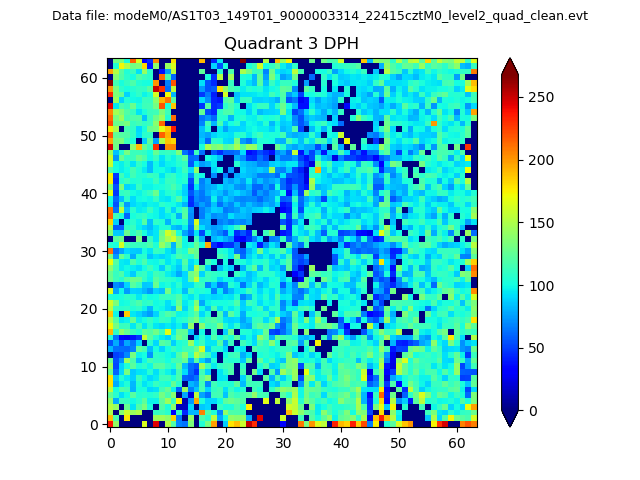 |
 |
Quadrant C |
| Plot type | Count rate plots | Images |
|---|---|---|
| Comparison with Poisson distribution Blue bars denote a histogram of data divided into 1 sec bins. Red curve is a Poisson curve with rate = median count rate of data. |
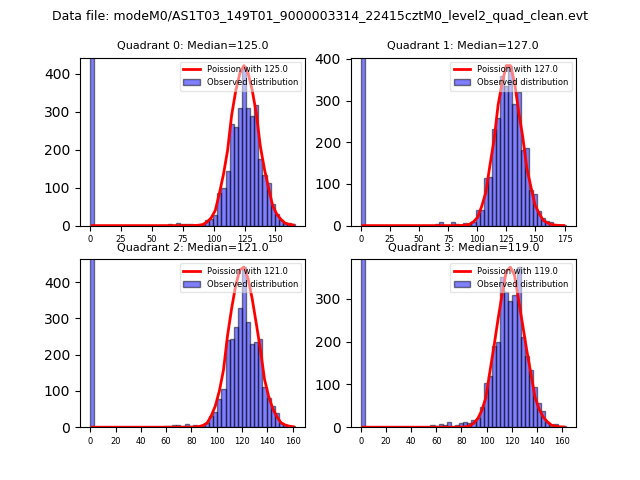 |
 |
| Quadrant-wise count rates Data is divided into 100 sec bins |
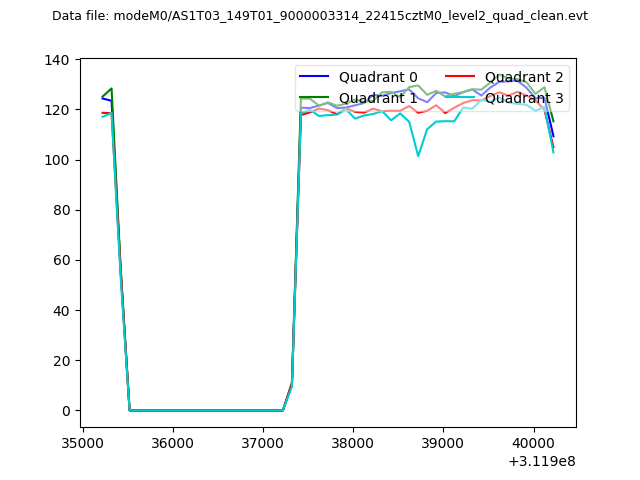 |
|
| Module-wise count rates for Quadrant A Data is divided into 100 sec bins |
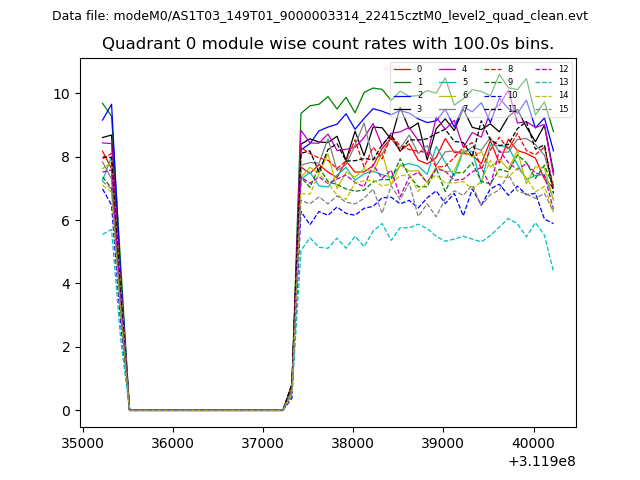 |
 |
| Module-wise count rates for Quadrant B Data is divided into 100 sec bins |
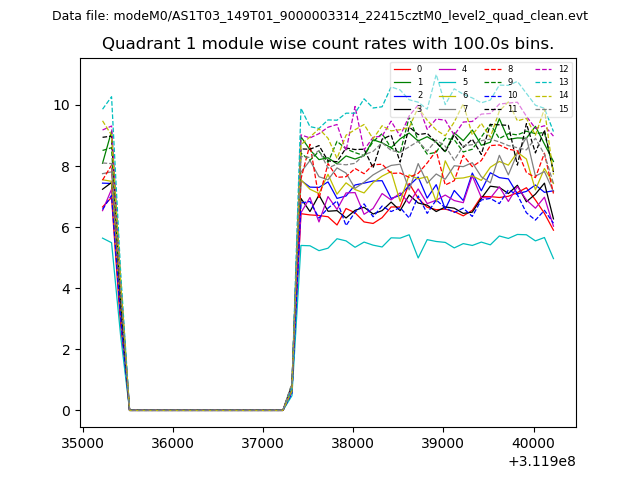 |
 |
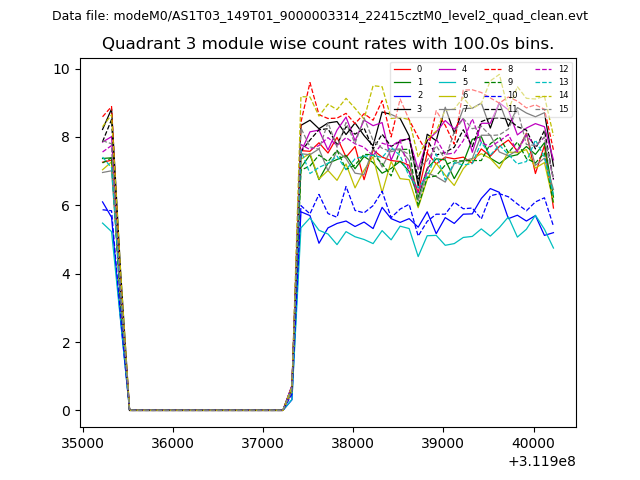
| Module-wise count rates for Quadrant C Data is divided into 100 sec bins |
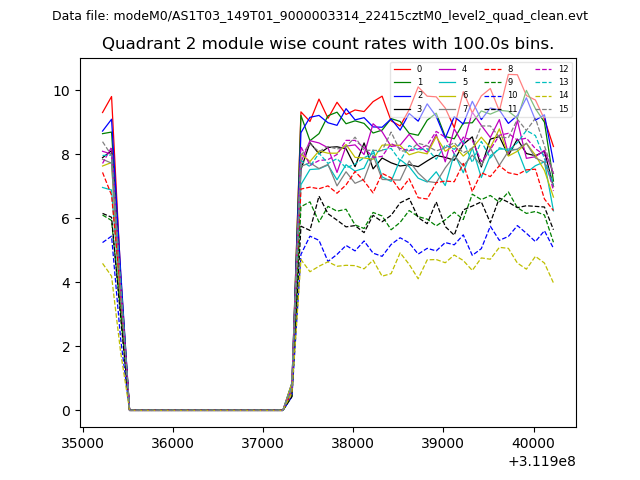 |
 |
| Module-wise count rates for Quadrant D Data is divided into 100 sec bins |
 |
 |
| Parameter | Plot |
|---|---|
| CZT HV Monitor | 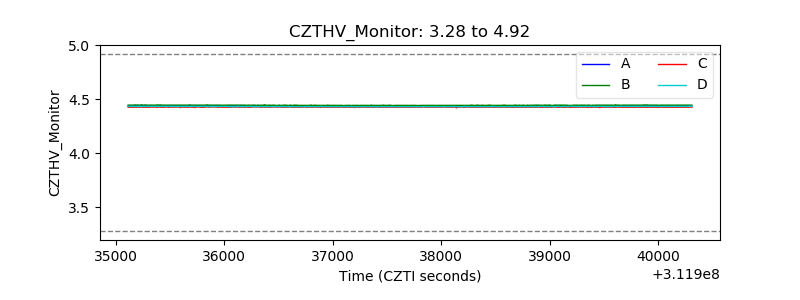 |
| D_VDD | 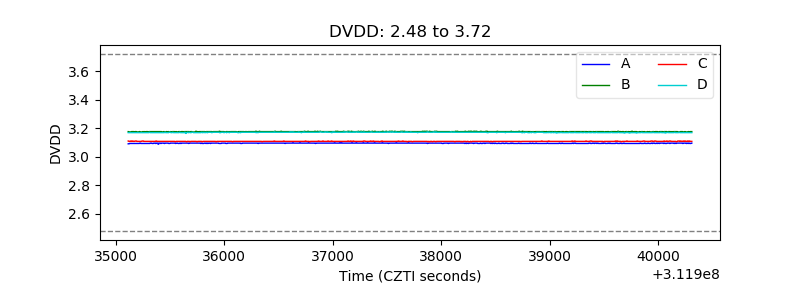 |
| Temperature 1 | 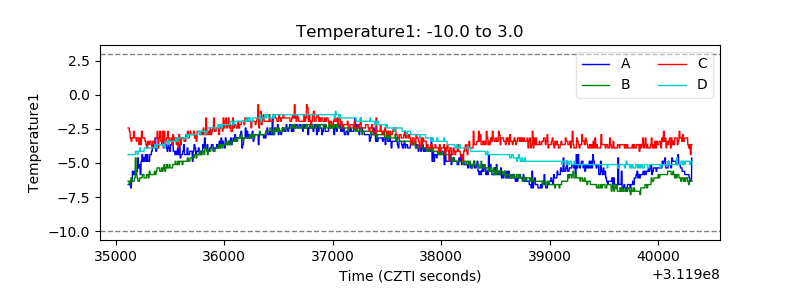 |
| Veto HV Monitor | 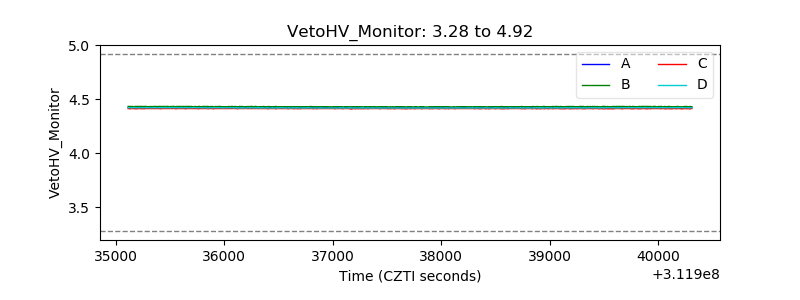 |
| Veto LLD | 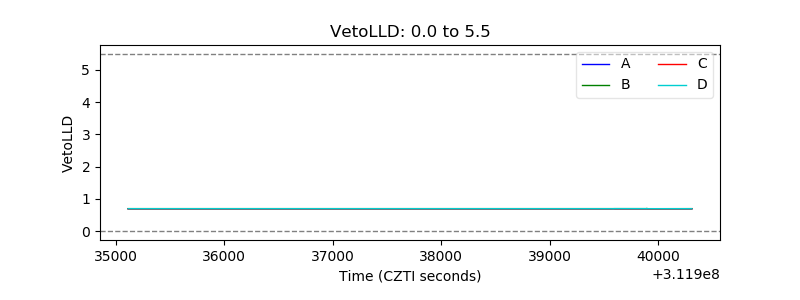 |
| Alpha Counter | 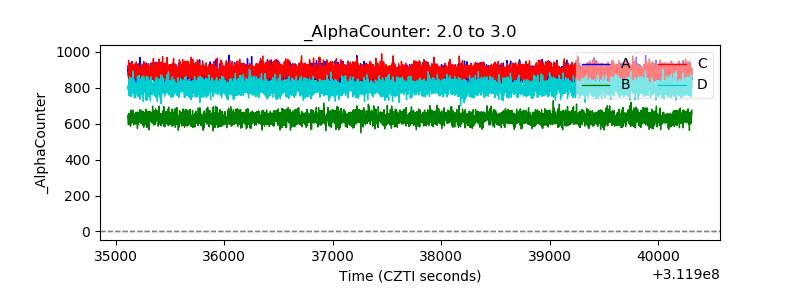 |
| _CPM_Rate | 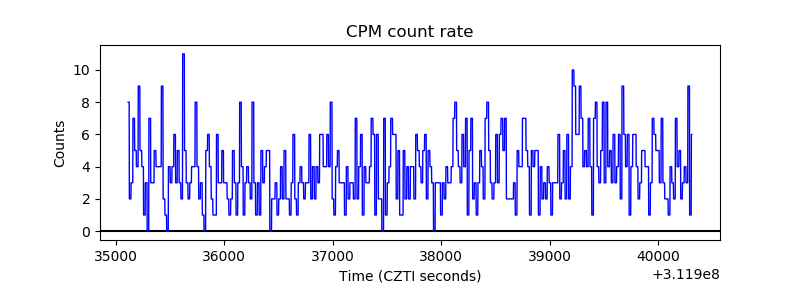 |
| CZT Counter | 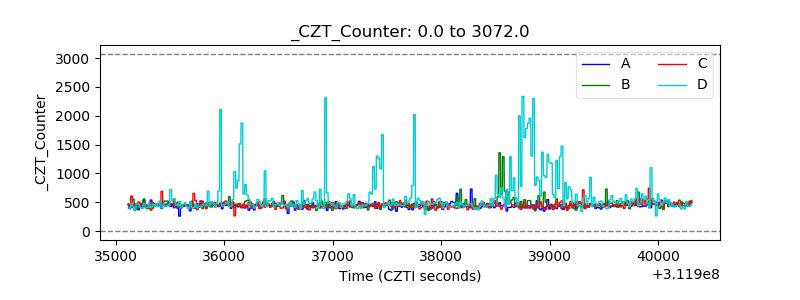 |
| +2.5 Volts monitor |  |
| +5 Volts monitor | 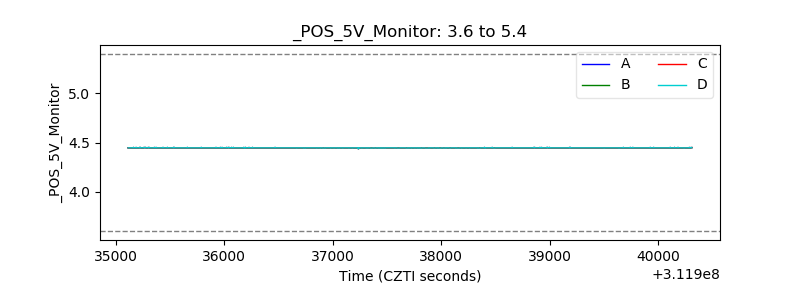 |
| _ROLL_ROT | 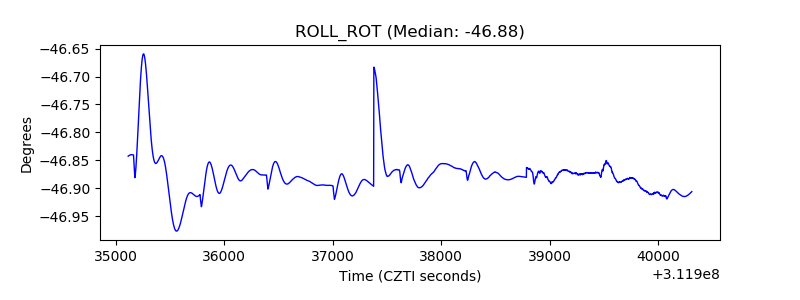 |
| _Roll_DEC | 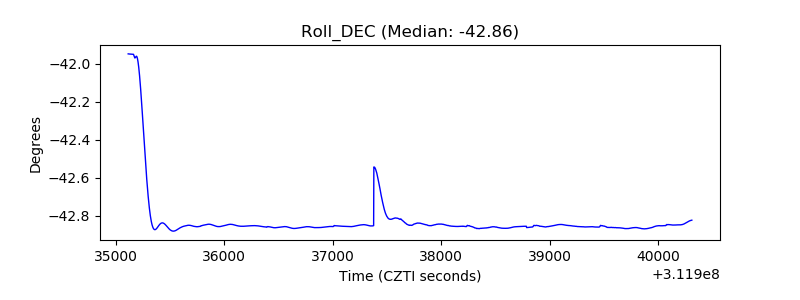 |
| _Roll_RA | 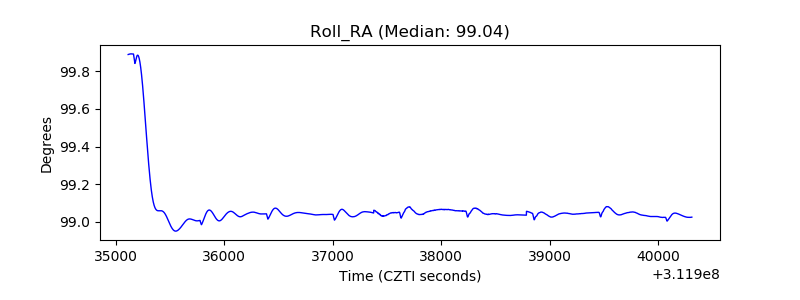 |
| Veto Counter | 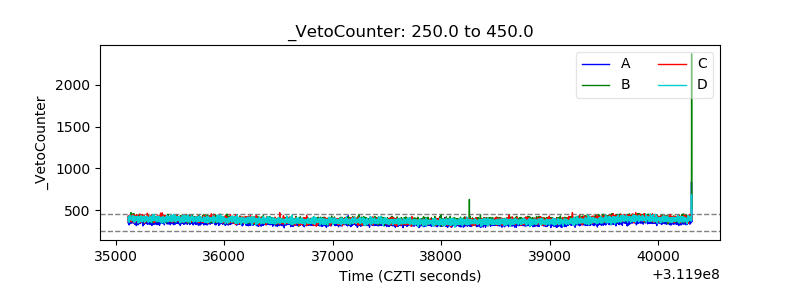 |