| Param | Original file | Final file |
|---|---|---|
| Filename | modeM0/AS1T03_149T02_9000003316_22415cztM0_level2.evt | modeM0/AS1T03_149T02_9000003316_22415cztM0_level2_quad_clean.evt |
| Size (bytes) | 391,389,120 | 73,753,920 |
| Size | 373.3 MB | 70.3 MB |
| Events in quadrant A | 2,591,352 | 468,751 |
| Events in quadrant B | 2,742,940 | 476,367 |
| Events in quadrant C | 2,628,650 | 452,644 |
| Events in quadrant D | 3,503,557 | 437,955 |
| Mode M9 | |||
|---|---|---|---|
| Quadrant | BADHDUFLAG | Total packets | Discarded packets |
| A | 0 | 3 | 0 |
| B | 0 | 3 | 0 |
| C | 0 | 3 | 0 |
| D | 0 | 3 | 0 |
| Mode SS | |||
|---|---|---|---|
| Quadrant | BADHDUFLAG | Total packets | Discarded packets |
| A | 0 | 114 | 0 |
| B | 0 | 114 | 0 |
| C | 0 | 114 | 0 |
| D | 0 | 114 | 0 |
| Mode M0 | |||
|---|---|---|---|
| Quadrant | BADHDUFLAG | Total packets | Discarded packets |
| A | 0 | 11570 | 1 |
| B | 0 | 11852 | 1 |
| C | 0 | 11585 | 1 |
| D | 0 | 14179 | 1 |
| Quadrant | Total seconds | Saturated seconds | Saturation percentage |
|---|---|---|---|
| A | 5682 | 47 | 0.827174% |
| B | 5682 | 70 | 1.231961% |
| C | 5682 | 58 | 1.020767% |
| D | 5682 | 166 | 2.921507% |
Noise dominated data is calculated using 1-second bins in cleaned event files. If a bin has >2000 counts, and if more than 50% of those come from <1% of pixels, then it is considered to be noise-dominated and hence unusable.
| Quadrant | # 1 sec bins | Bins with >0 counts | Bins with >2000 counts | High rate bins dominated by noise | Noise dominated (total time) | Noise dominated (detector-on time) | Marked lightcurve |
|---|---|---|---|---|---|---|---|
| A | 5681 | 5681 | 0 | 0 | 0.00% | 0.00% | 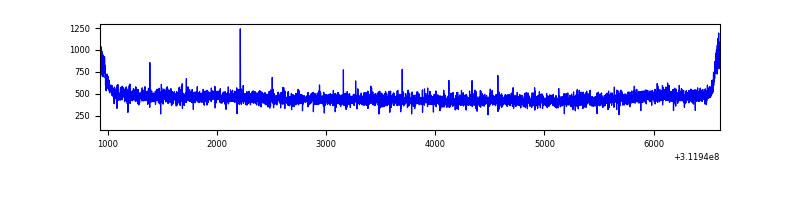 |
| B | 5682 | 5682 | 8 | 8 | 0.14% | 0.14% | 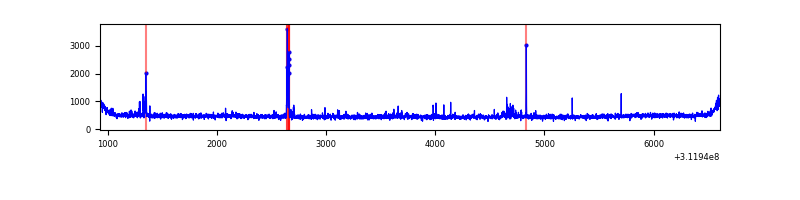 |
| C | 5682 | 5682 | 0 | 0 | 0.00% | 0.00% | 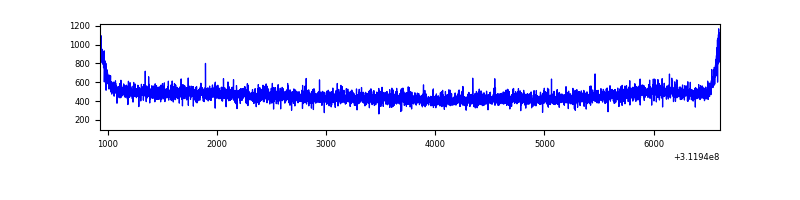 |
| D | 5681 | 5681 | 137 | 137 | 2.41% | 2.41% | 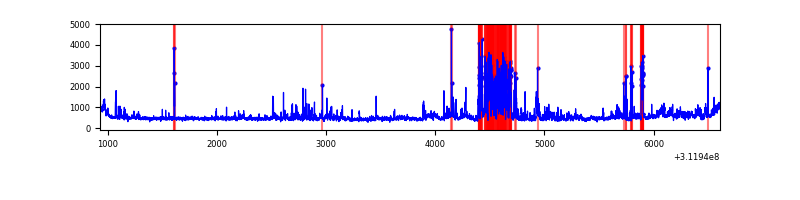 |
Top three noisy pixels from each quadrant. If the there are fewer than three noisy pixels in the level2.evt file, extra rows are filled as -1
| Pixel properties | Quadrant properties | ||||||
|---|---|---|---|---|---|---|---|
| Quadrant | DetID | PixID | Counts | Sigma | Mean | Median | Sigma |
| A | 13 | 254 | 8070 | 54.07 | 671 | 655 | 137.1 |
| A | 3 | 137 | 5972 | 38.77 | 671 | 655 | 137.1 |
| A | 0 | 226 | 5646 | 36.39 | 671 | 655 | 137.1 |
| B | 3 | 64 | 51303 | 393.57 | 669 | 650 | 128.7 |
| B | 0 | 197 | 22392 | 168.93 | 669 | 650 | 128.7 |
| B | 4 | 173 | 19911 | 149.66 | 669 | 650 | 128.7 |
| C | 14 | 238 | 100399 | 649.01 | 648 | 650 | 153.7 |
| C | 13 | 61 | 4415 | 24.5 | 648 | 650 | 153.7 |
| C | 1 | 16 | 4231 | 23.3 | 648 | 650 | 153.7 |
| D | 1 | 52 | 940346 | 5950.25 | 647 | 628 | 157.9 |
| D | 9 | 85 | 41889 | 261.26 | 647 | 628 | 157.9 |
| D | 13 | 104 | 31250 | 193.9 | 647 | 628 | 157.9 |
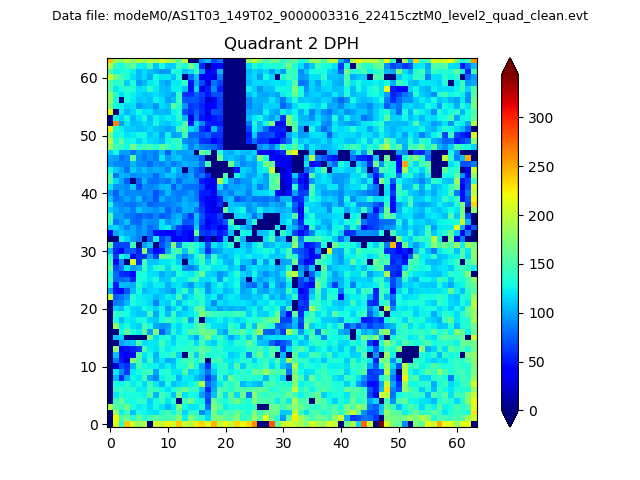
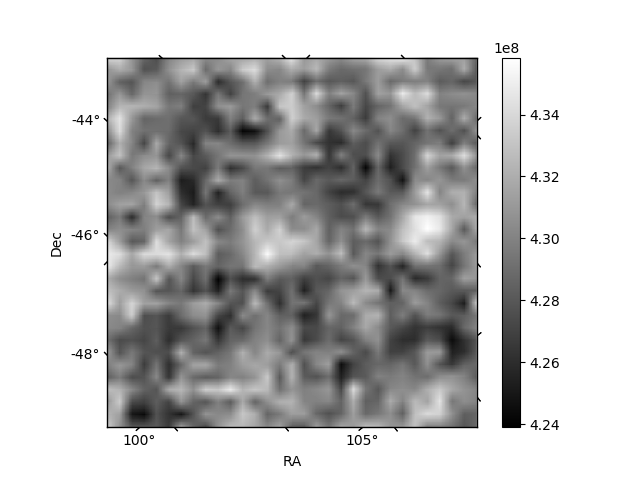
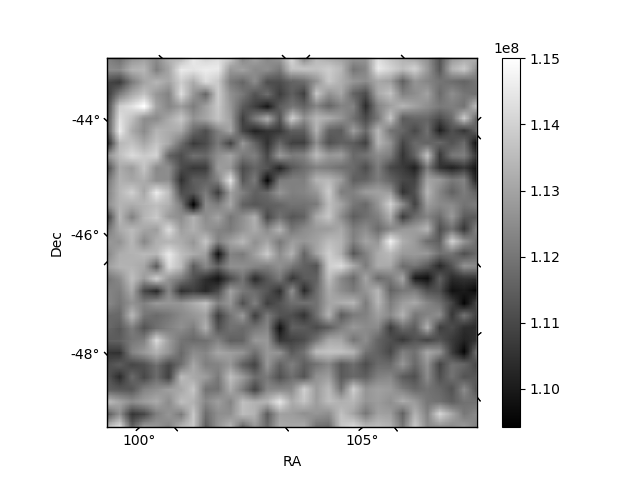
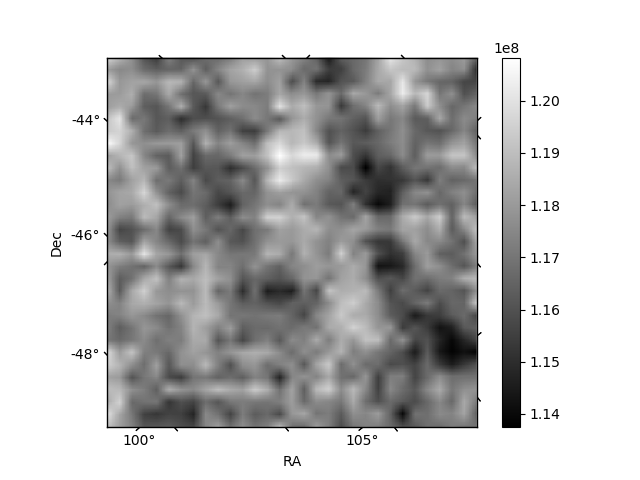
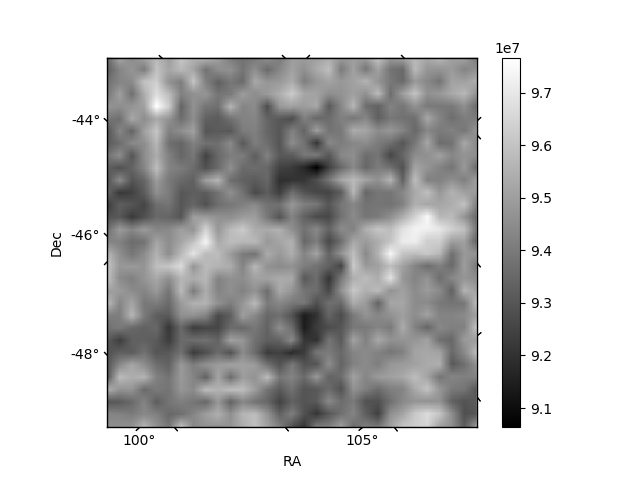
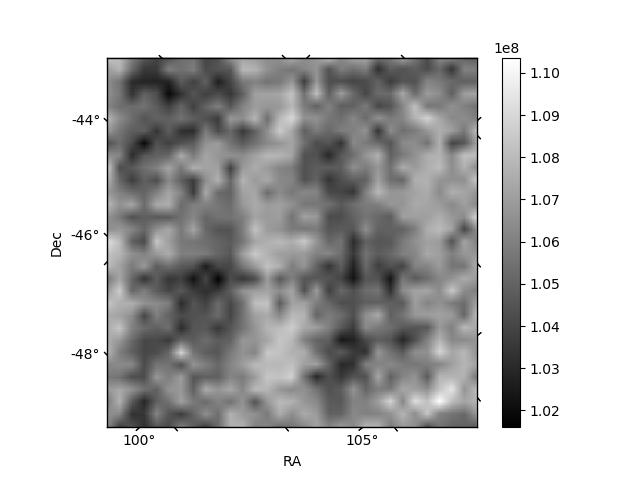
Histogram calculated using DETX and DETY for each event in the final _common_clean file
| Quadrant A | 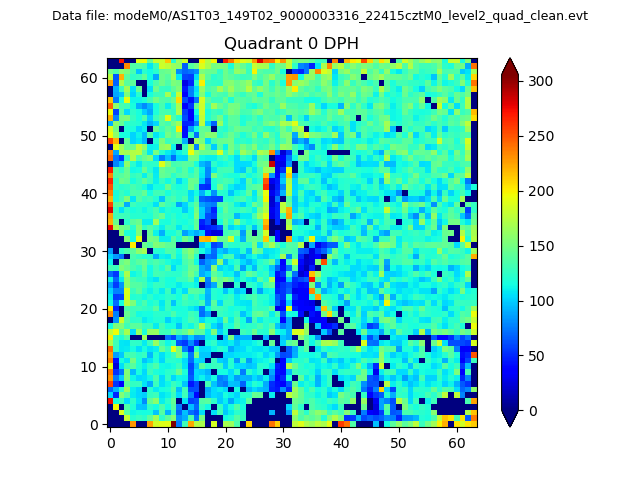 |
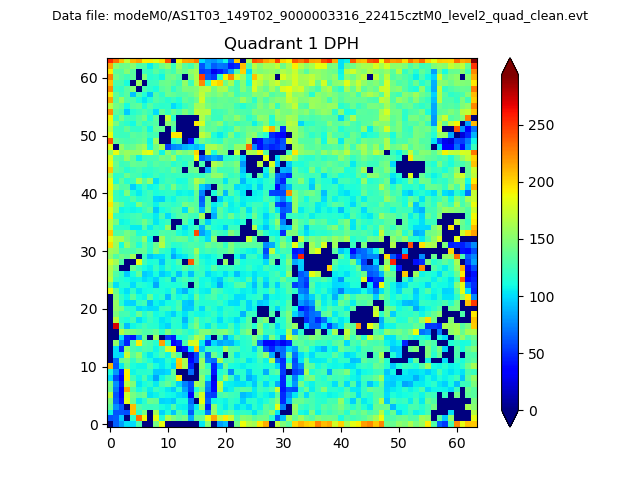 |
Quadrant B |
|---|---|---|---|
| Quadrant D | 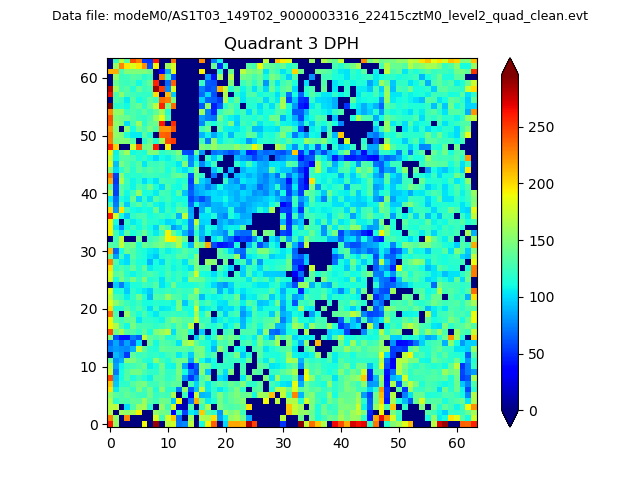 |
 |
Quadrant C |
| Plot type | Count rate plots | Images |
|---|---|---|
| Comparison with Poisson distribution Blue bars denote a histogram of data divided into 1 sec bins. Red curve is a Poisson curve with rate = median count rate of data. |
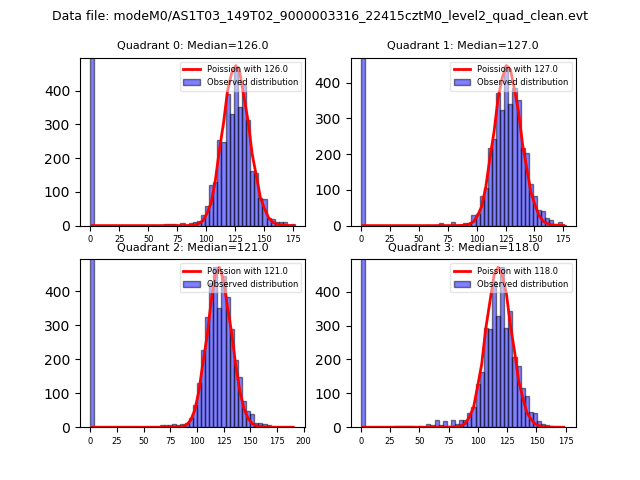 |
 |
| Quadrant-wise count rates Data is divided into 100 sec bins |
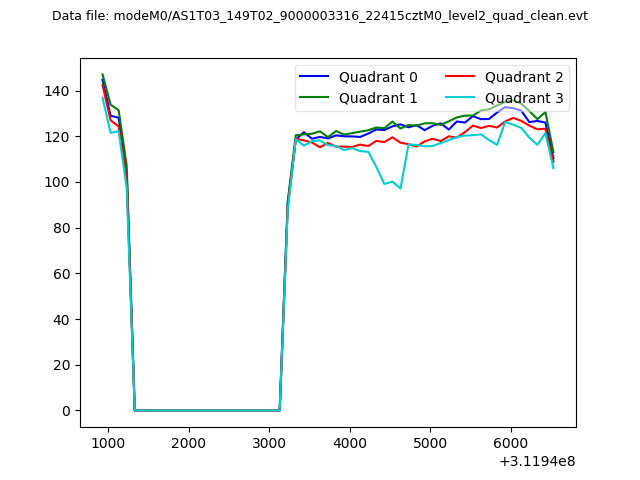 |
|
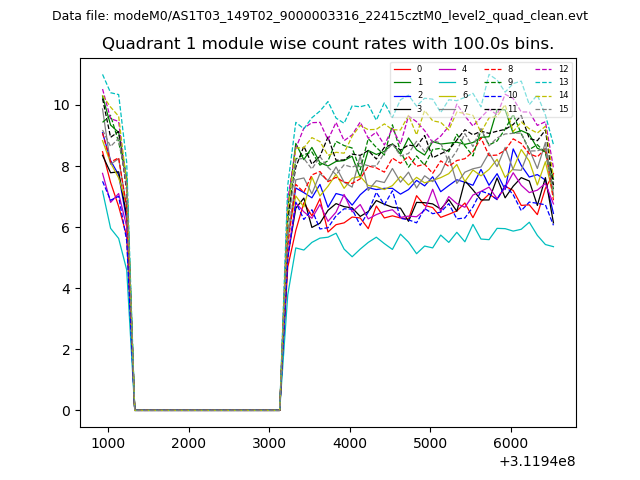
| Module-wise count rates for Quadrant A Data is divided into 100 sec bins |
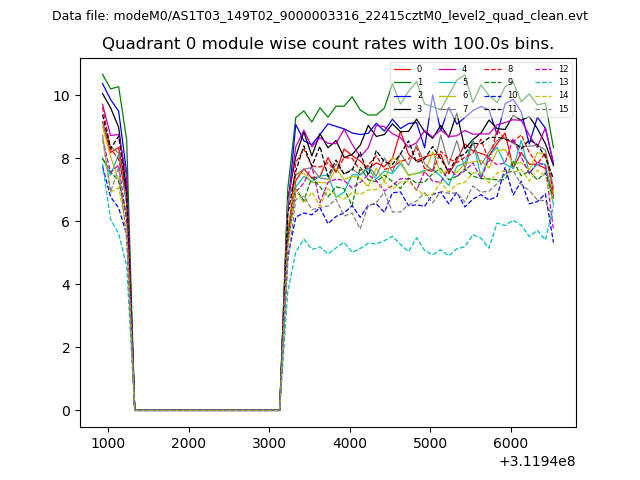 |
 |
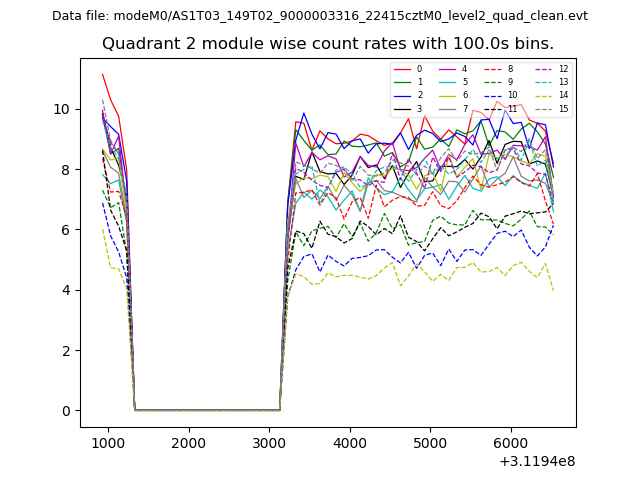
| Module-wise count rates for Quadrant B Data is divided into 100 sec bins |
 |
 |
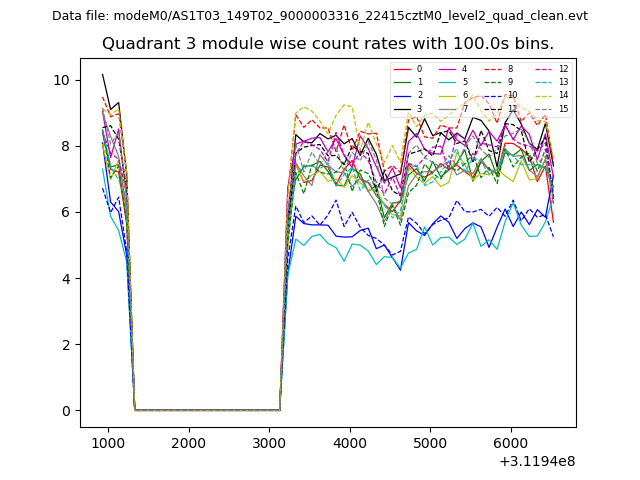
| Module-wise count rates for Quadrant C Data is divided into 100 sec bins |
 |
 |
| Module-wise count rates for Quadrant D Data is divided into 100 sec bins |
 |
 |
| Parameter | Plot |
|---|---|
| CZT HV Monitor | 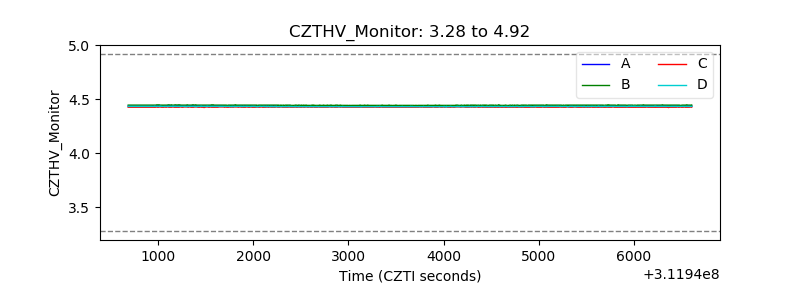 |
| D_VDD | 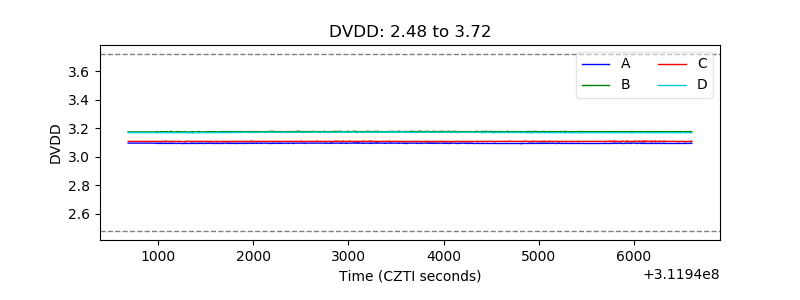 |
| Temperature 1 | 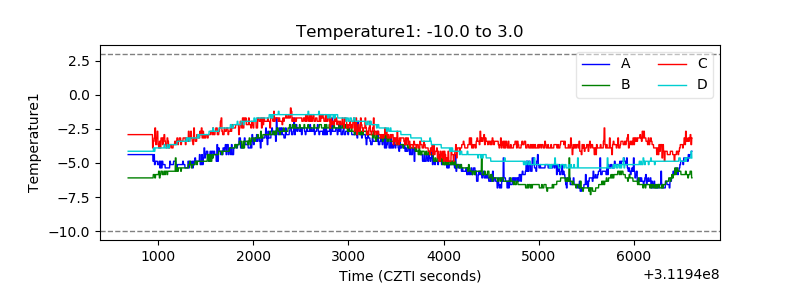 |
| Veto HV Monitor | 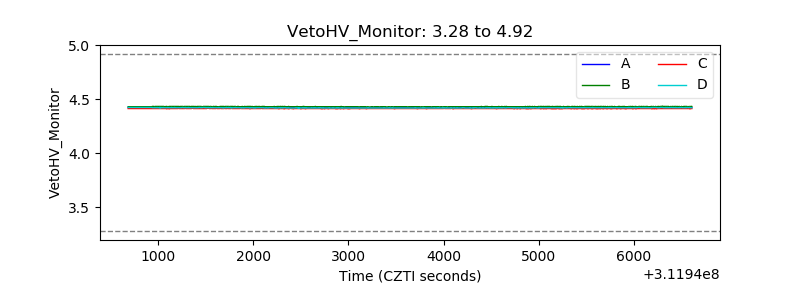 |
| Veto LLD |  |
| Alpha Counter | 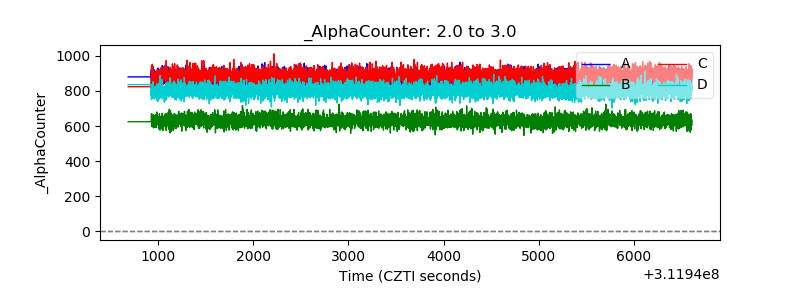 |
| _CPM_Rate | 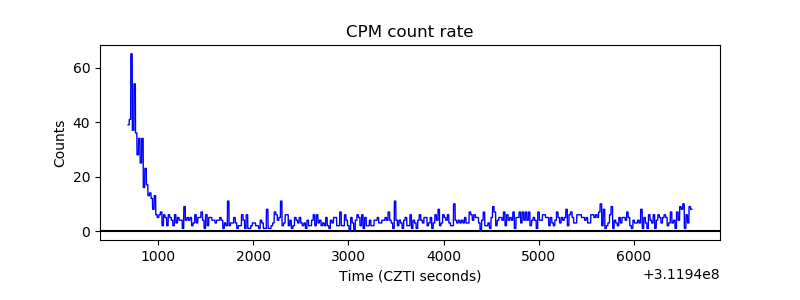 |
| CZT Counter | 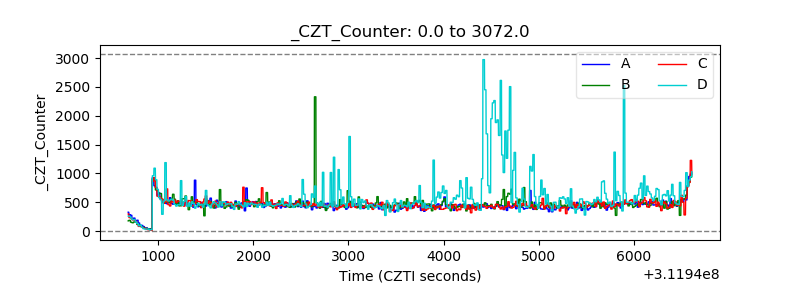 |
| +2.5 Volts monitor |  |
| +5 Volts monitor |  |
| _ROLL_ROT | 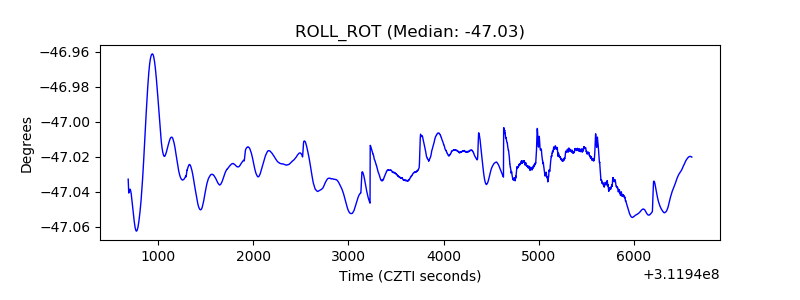 |
| _Roll_DEC | 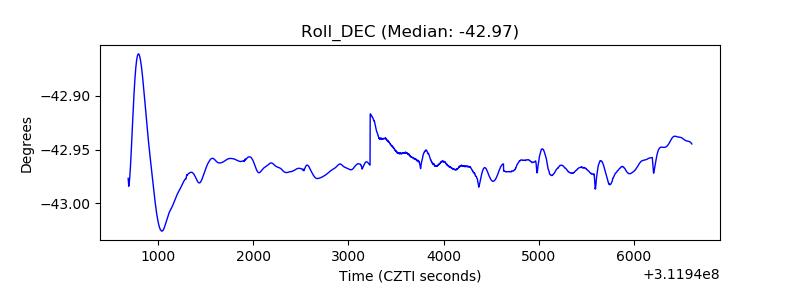 |
| _Roll_RA | 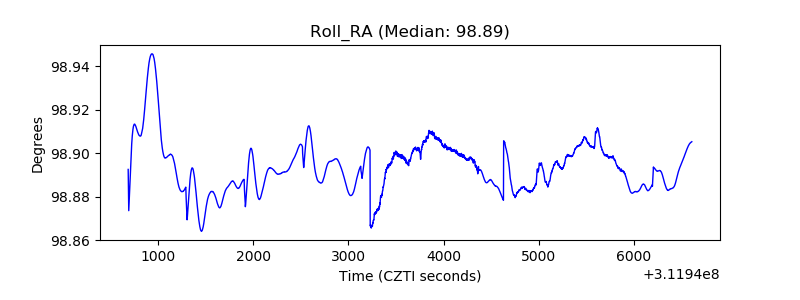 |
| Veto Counter | 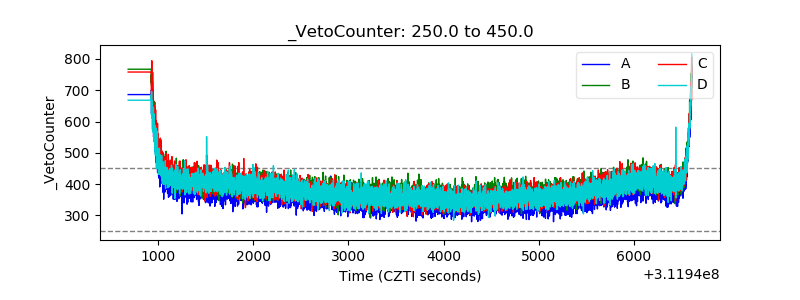 |