| Param | Original file | Final file |
|---|---|---|
| Filename | modeM0/AS1T03_149T03_9000003318cztM0_level2.fits | modeM0/AS1T03_149T03_9000003318cztM0_level2_quad_clean.evt |
| Size (bytes) | 51,909,120 | 52,827,840 |
| Size | 49.5 MB | 50.4 MB |
| Events in quadrant A | 312,464 | 317,524 |
| Events in quadrant B | 302,202 | 317,541 |
| Events in quadrant C | 304,208 | 297,820 |
| Events in quadrant D | 266,954 | 279,576 |
| Mode SS | |||
|---|---|---|---|
| Quadrant | BADHDUFLAG | Total packets | Discarded packets |
| A | 0 | 112 | 0 |
| B | 0 | 112 | 0 |
| C | 0 | 112 | 0 |
| D | 0 | 112 | 0 |
| Mode M9 | |||
|---|---|---|---|
| Quadrant | BADHDUFLAG | Total packets | Discarded packets |
| A | 0 | 5 | 0 |
| B | 0 | 5 | 0 |
| C | 0 | 5 | 0 |
| D | 0 | 5 | 0 |
| Mode M0 | |||
|---|---|---|---|
| Quadrant | BADHDUFLAG | Total packets | Discarded packets |
| A | 0 | 11267 | 0 |
| B | 0 | 11559 | 0 |
| C | 0 | 11273 | 0 |
| D | 0 | 12990 | 0 |
| Quadrant | Total seconds | Saturated seconds | Saturation percentage |
|---|---|---|---|
| A | 5525 | 68 | 1.230769% |
| B | 5525 | 67 | 1.212670% |
| C | 5525 | 81 | 1.466063% |
| D | 5525 | 107 | 1.936652% |
Noise dominated data is calculated using 1-second bins in cleaned event files. If a bin has >2000 counts, and if more than 50% of those come from <1% of pixels, then it is considered to be noise-dominated and hence unusable.
| Quadrant | # 1 sec bins | Bins with >0 counts | Bins with >2000 counts | High rate bins dominated by noise | Noise dominated (total time) | Noise dominated (detector-on time) | Marked lightcurve |
|---|---|---|---|---|---|---|---|
| A | 5523 | 5523 | 0 | 0 | 0.00% | 0.00% |  |
| B | 5523 | 5523 | 0 | 0 | 0.00% | 0.00% |  |
| C | 5523 | 5523 | 0 | 0 | 0.00% | 0.00% |  |
| D | 5523 | 5523 | 0 | 0 | 0.00% | 0.00% |  |
Top three noisy pixels from each quadrant. If the there are fewer than three noisy pixels in the level2.evt file, extra rows are filled as -1
| Pixel properties | Quadrant properties | ||||||
|---|---|---|---|---|---|---|---|
| Quadrant | DetID | PixID | Counts | Sigma | Mean | Median | Sigma |
| A | 14 | 188 | 309 | 10.39 | 81 | 76 | 22.4 |
| A | 0 | 29 | 307 | 10.31 | 81 | 76 | 22.4 |
| A | 14 | 204 | 296 | 9.81 | 81 | 76 | 22.4 |
| B | 2 | 9 | 280 | 11.13 | 79 | 75 | 18.4 |
| B | 2 | 8 | 241 | 9.01 | 79 | 75 | 18.4 |
| B | 5 | 255 | 206 | 7.11 | 79 | 75 | 18.4 |
| C | 12 | 249 | 226 | 6.66 | 80 | 75 | 22.7 |
| C | 12 | 241 | 218 | 6.31 | 80 | 75 | 22.7 |
| C | 1 | 80 | 218 | 6.31 | 80 | 75 | 22.7 |
| D | 4 | 246 | 215 | 6.56 | 76 | 69 | 22.2 |
| D | 10 | 189 | 202 | 5.98 | 76 | 69 | 22.2 |
| D | 15 | 46 | 200 | 5.89 | 76 | 69 | 22.2 |
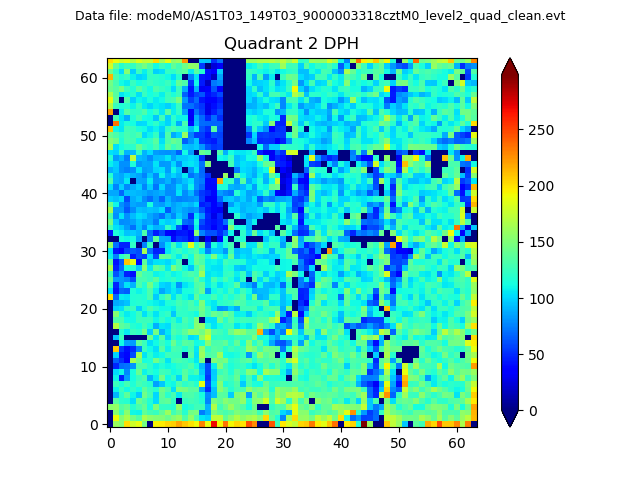
Histogram calculated using DETX and DETY for each event in the final _common_clean file
| Quadrant A |  |
 |
Quadrant B |
|---|---|---|---|
| Quadrant D |  |
 |
Quadrant C |
| Plot type | Count rate plots | Images |
|---|---|---|
| Comparison with Poisson distribution Blue bars denote a histogram of data divided into 1 sec bins. Red curve is a Poisson curve with rate = median count rate of data. |
 |
 |
| Quadrant-wise count rates Data is divided into 100 sec bins |
 |
|
| Module-wise count rates for Quadrant A Data is divided into 100 sec bins |
 |
 |
| Module-wise count rates for Quadrant B Data is divided into 100 sec bins |
 |
 |
| Module-wise count rates for Quadrant C Data is divided into 100 sec bins |
 |
 |
| Module-wise count rates for Quadrant D Data is divided into 100 sec bins |
 |
 |
| Parameter | Plot |
|---|---|
| CZT HV Monitor |  |
| D_VDD |  |
| Temperature 1 |  |
| Veto HV Monitor |  |
| Veto LLD |  |
| Alpha Counter |  |
| _CPM_Rate |  |
| CZT Counter |  |
| +2.5 Volts monitor |  |
| +5 Volts monitor |  |
| _ROLL_ROT |  |
| _Roll_DEC |  |
| _Roll_RA |  |
| Veto Counter |  |