| Param | Original file | Final file |
|---|---|---|
| Filename | modeM0/AS1T03_149T03_9000003318_22415cztM0_level2.evt | modeM0/AS1T03_149T03_9000003318_22415cztM0_level2_quad_clean.evt |
| Size (bytes) | 372,032,640 | 71,671,680 |
| Size | 354.8 MB | 68.4 MB |
| Events in quadrant A | 2,541,183 | 454,195 |
| Events in quadrant B | 2,680,061 | 458,858 |
| Events in quadrant C | 2,577,080 | 436,885 |
| Events in quadrant D | 3,092,430 | 433,761 |
| Mode SS | |||
|---|---|---|---|
| Quadrant | BADHDUFLAG | Total packets | Discarded packets |
| A | 0 | 112 | 0 |
| B | 0 | 112 | 0 |
| C | 0 | 112 | 0 |
| D | 0 | 112 | 0 |
| Mode M9 | |||
|---|---|---|---|
| Quadrant | BADHDUFLAG | Total packets | Discarded packets |
| A | 0 | 5 | 0 |
| B | 0 | 5 | 0 |
| C | 0 | 5 | 0 |
| D | 0 | 5 | 0 |
| Mode M0 | |||
|---|---|---|---|
| Quadrant | BADHDUFLAG | Total packets | Discarded packets |
| A | 0 | 11268 | 1 |
| B | 0 | 11560 | 1 |
| C | 0 | 11274 | 1 |
| D | 0 | 12991 | 1 |
| Quadrant | Total seconds | Saturated seconds | Saturation percentage |
|---|---|---|---|
| A | 5525 | 68 | 1.230769% |
| B | 5525 | 67 | 1.212670% |
| C | 5525 | 81 | 1.466063% |
| D | 5525 | 107 | 1.936652% |
Noise dominated data is calculated using 1-second bins in cleaned event files. If a bin has >2000 counts, and if more than 50% of those come from <1% of pixels, then it is considered to be noise-dominated and hence unusable.
| Quadrant | # 1 sec bins | Bins with >0 counts | Bins with >2000 counts | High rate bins dominated by noise | Noise dominated (total time) | Noise dominated (detector-on time) | Marked lightcurve |
|---|---|---|---|---|---|---|---|
| A | 5524 | 5524 | 0 | 0 | 0.00% | 0.00% | 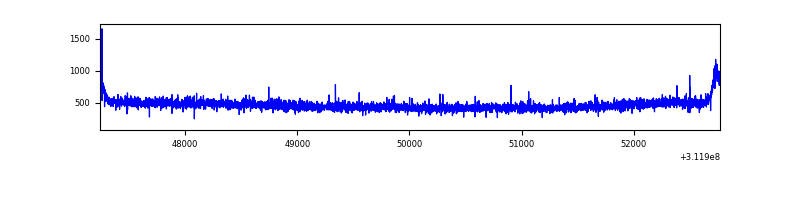 |
| B | 5524 | 5524 | 1 | 1 | 0.02% | 0.02% | 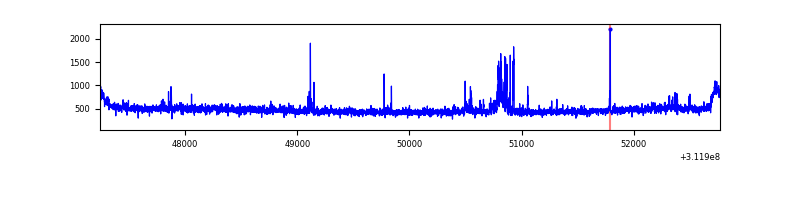 |
| C | 5524 | 5524 | 0 | 0 | 0.00% | 0.00% | 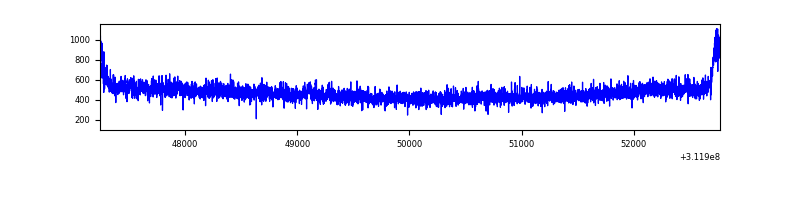 |
| D | 5524 | 5524 | 40 | 40 | 0.72% | 0.72% |  |
Top three noisy pixels from each quadrant. If the there are fewer than three noisy pixels in the level2.evt file, extra rows are filled as -1
| Pixel properties | Quadrant properties | ||||||
|---|---|---|---|---|---|---|---|
| Quadrant | DetID | PixID | Counts | Sigma | Mean | Median | Sigma |
| A | 13 | 254 | 6930 | 46.84 | 656 | 642 | 134.2 |
| A | 3 | 137 | 5843 | 38.75 | 656 | 642 | 134.2 |
| A | 0 | 226 | 5654 | 37.34 | 656 | 642 | 134.2 |
| B | 0 | 244 | 72005 | 566.32 | 653 | 634 | 126.0 |
| B | 12 | 111 | 15605 | 118.79 | 653 | 634 | 126.0 |
| B | 0 | 197 | 15120 | 114.94 | 653 | 634 | 126.0 |
| C | 14 | 238 | 98905 | 657.84 | 631 | 635 | 149.4 |
| C | 1 | 16 | 19247 | 124.59 | 631 | 635 | 149.4 |
| C | 13 | 61 | 4283 | 24.42 | 631 | 635 | 149.4 |
| D | 1 | 52 | 594178 | 3768.82 | 639 | 620 | 157.5 |
| D | 9 | 85 | 47062 | 294.89 | 639 | 620 | 157.5 |
| D | 2 | 234 | 24826 | 153.7 | 639 | 620 | 157.5 |
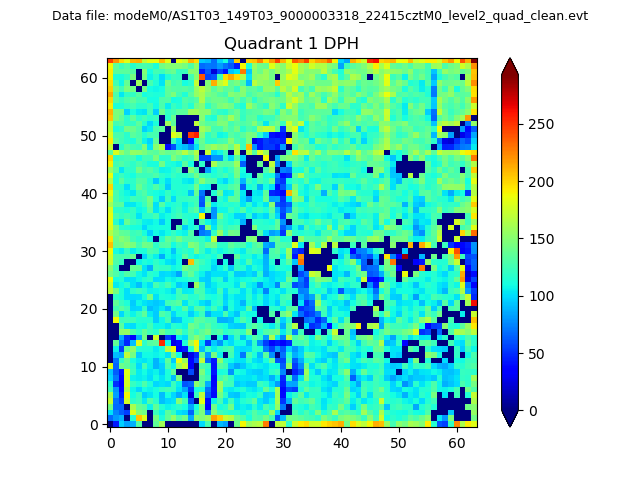
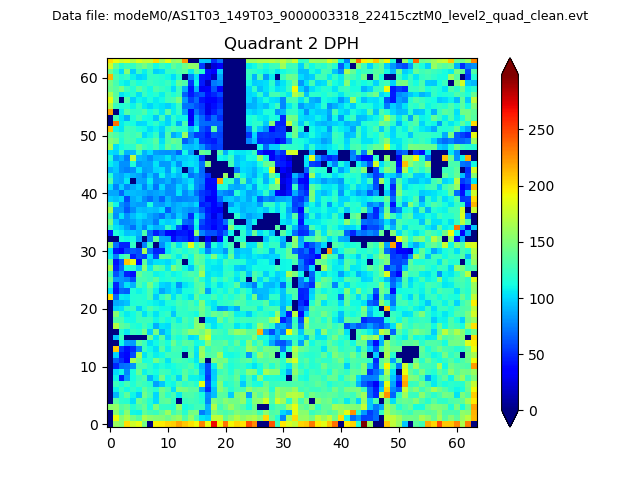
Histogram calculated using DETX and DETY for each event in the final _common_clean file
| Quadrant A | 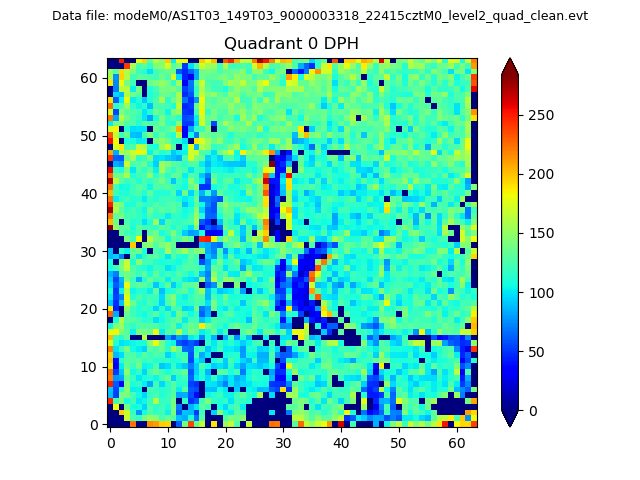 |
 |
Quadrant B |
|---|---|---|---|
| Quadrant D | 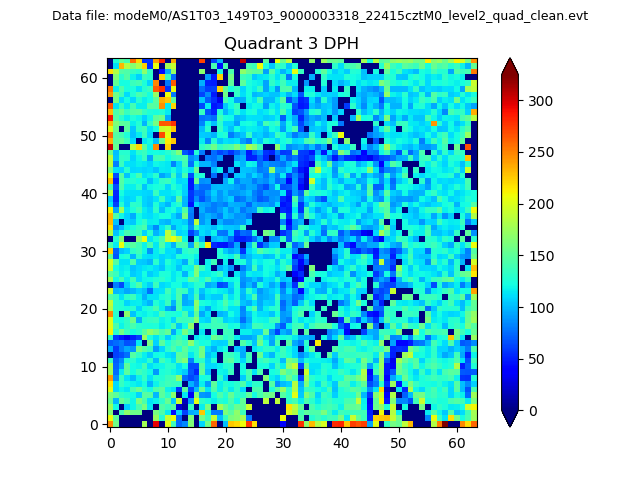 |
 |
Quadrant C |
| Plot type | Count rate plots | Images |
|---|---|---|
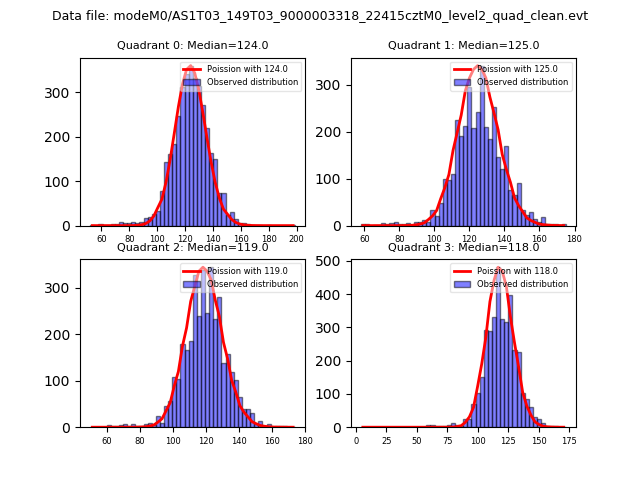
| Comparison with Poisson distribution Blue bars denote a histogram of data divided into 1 sec bins. Red curve is a Poisson curve with rate = median count rate of data. |
 |
 |
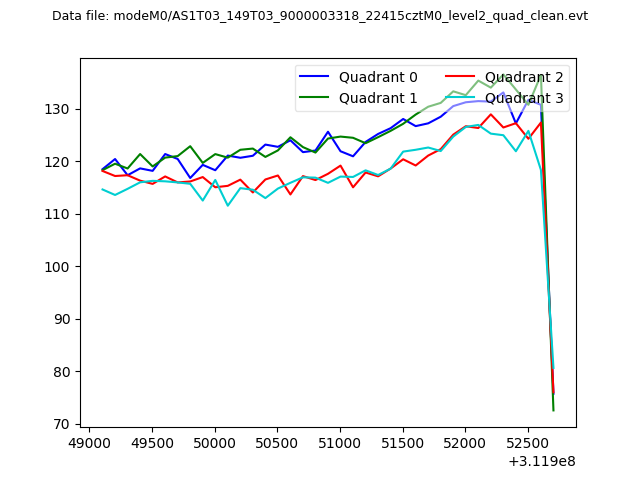
| Quadrant-wise count rates Data is divided into 100 sec bins |
 |
|
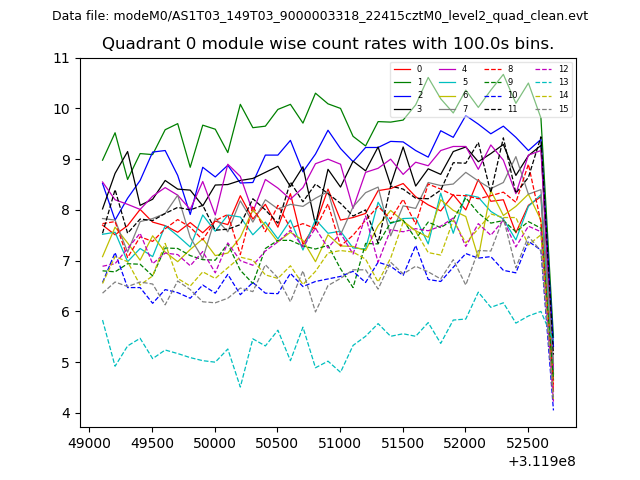
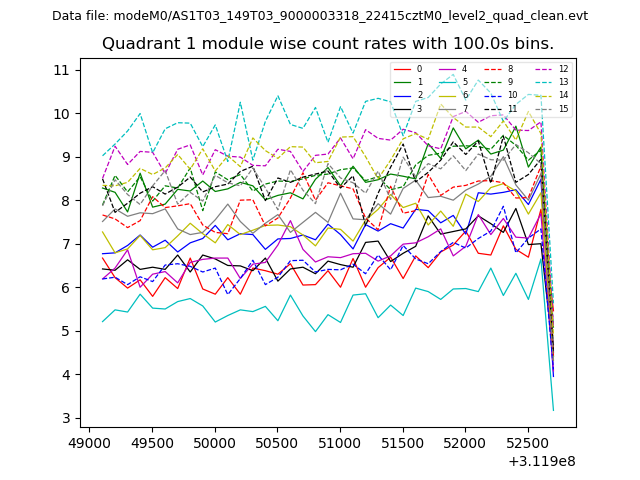
| Module-wise count rates for Quadrant A Data is divided into 100 sec bins |
 |
 |
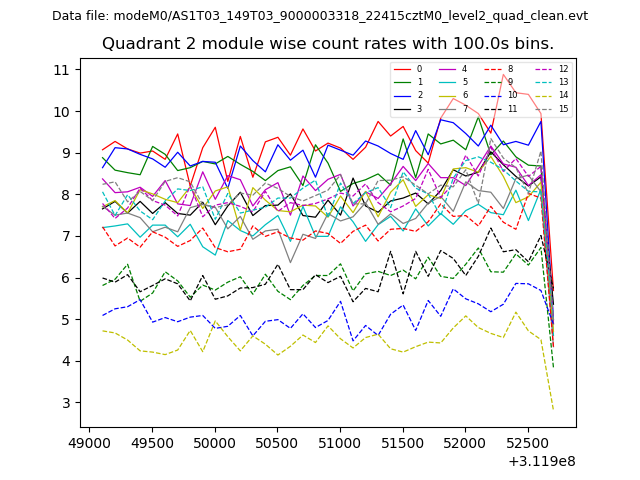
| Module-wise count rates for Quadrant B Data is divided into 100 sec bins |
 |
 |
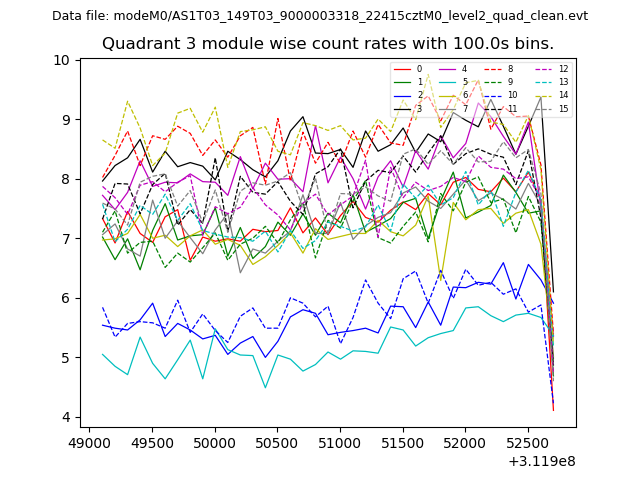
| Module-wise count rates for Quadrant C Data is divided into 100 sec bins |
 |
 |
| Module-wise count rates for Quadrant D Data is divided into 100 sec bins |
 |
 |
| Parameter | Plot |
|---|---|
| CZT HV Monitor | 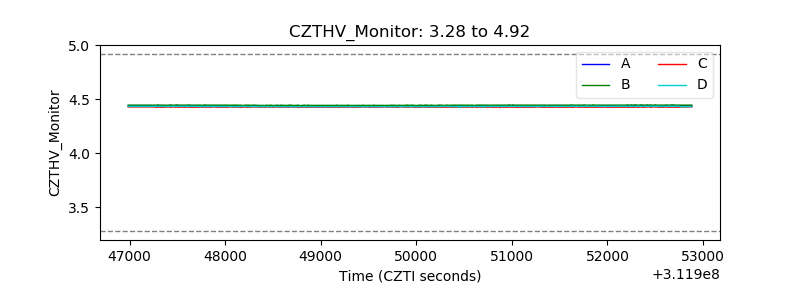 |
| D_VDD |  |
| Temperature 1 | 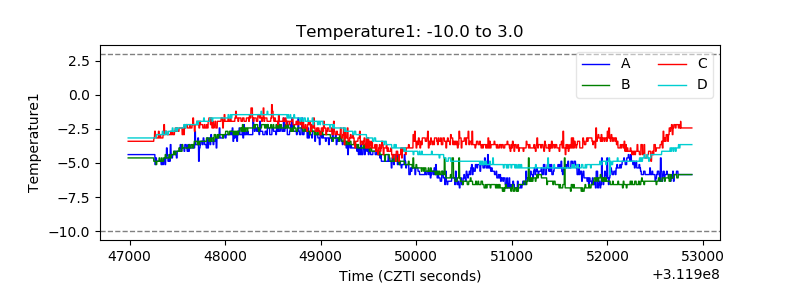 |
| Veto HV Monitor | 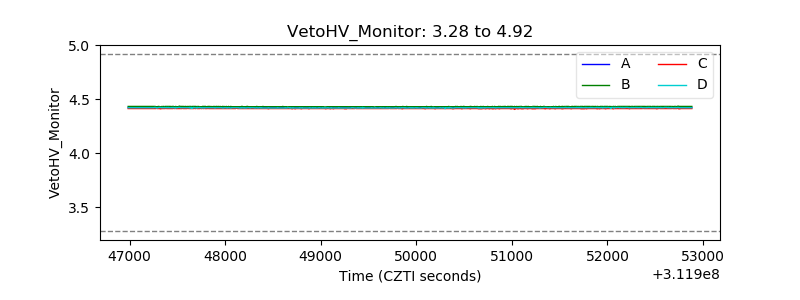 |
| Veto LLD | 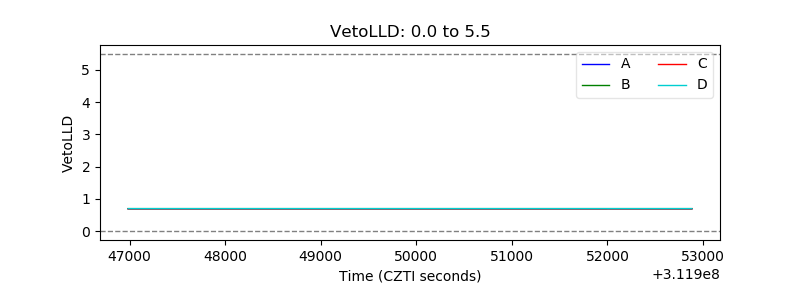 |
| Alpha Counter | 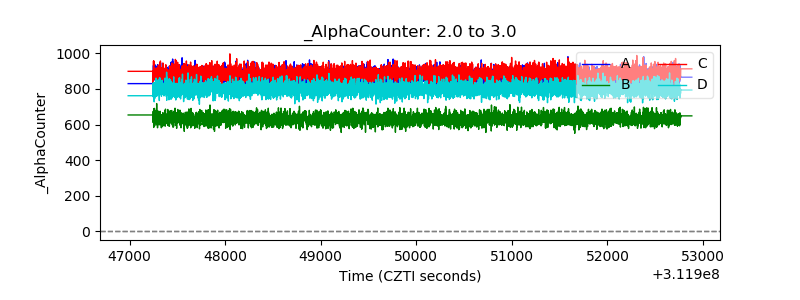 |
| _CPM_Rate | 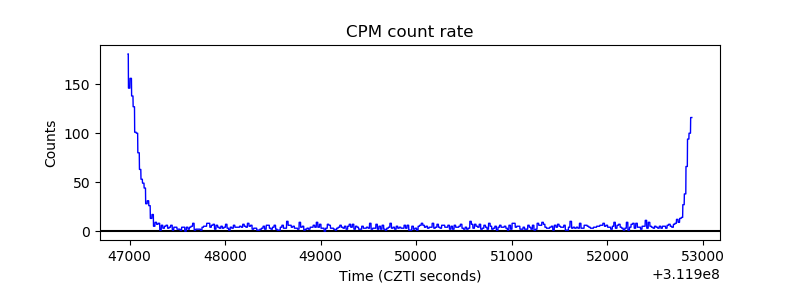 |
| CZT Counter | 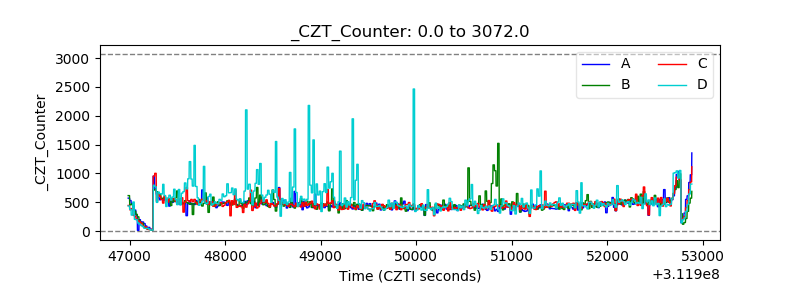 |
| +2.5 Volts monitor |  |
| +5 Volts monitor |  |
| _ROLL_ROT | 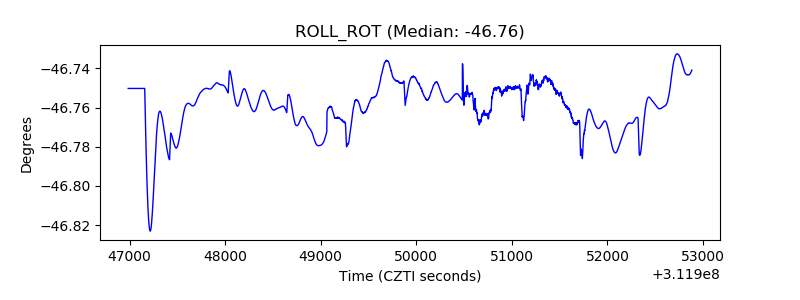 |
| _Roll_DEC | 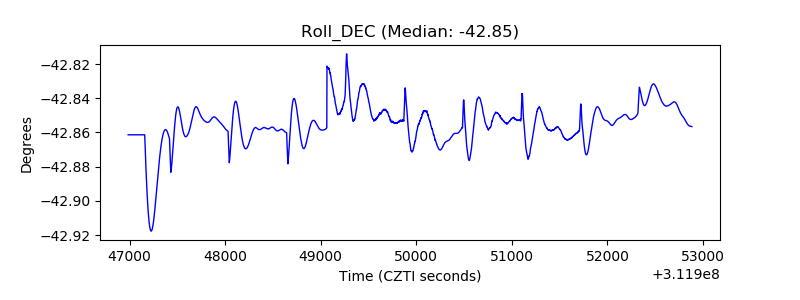 |
| _Roll_RA | 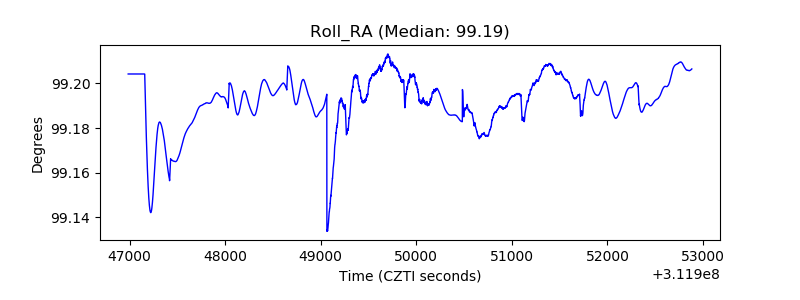 |
| Veto Counter | 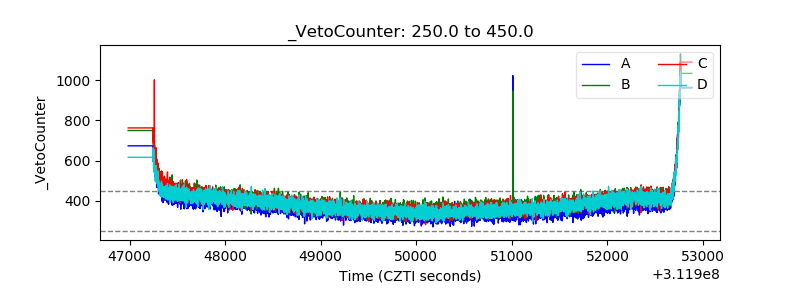 |