| Param | Original file | Final file |
|---|---|---|
| Filename | modeM0/AS1T03_149T04_9000003322cztM0_level2.fits | modeM0/AS1T03_149T04_9000003322cztM0_level2_quad_clean.evt |
| Size (bytes) | 48,614,400 | 26,222,400 |
| Size | 46.4 MB | 25.0 MB |
| Events in quadrant A | 301,864 | 120,953 |
| Events in quadrant B | 293,720 | 124,549 |
| Events in quadrant C | 299,216 | 115,146 |
| Events in quadrant D | 250,358 | 104,919 |
| Mode M0 | |||
|---|---|---|---|
| Quadrant | BADHDUFLAG | Total packets | Discarded packets |
| A | 0 | 9652 | 0 |
| B | 0 | 9959 | 0 |
| C | 0 | 9792 | 0 |
| D | 0 | 11673 | 0 |
| Mode M9 | |||
|---|---|---|---|
| Quadrant | BADHDUFLAG | Total packets | Discarded packets |
| A | 0 | 14 | 0 |
| B | 0 | 14 | 0 |
| C | 0 | 14 | 0 |
| D | 0 | 14 | 0 |
| Mode SS | |||
|---|---|---|---|
| Quadrant | BADHDUFLAG | Total packets | Discarded packets |
| A | 0 | 96 | 0 |
| B | 0 | 96 | 0 |
| C | 0 | 96 | 0 |
| D | 0 | 96 | 0 |
| Quadrant | Total seconds | Saturated seconds | Saturation percentage |
|---|---|---|---|
| A | 4656 | 11 | 0.236254% |
| B | 4656 | 32 | 0.687285% |
| C | 4656 | 48 | 1.030928% |
| D | 4656 | 323 | 6.937285% |
Noise dominated data is calculated using 1-second bins in cleaned event files. If a bin has >2000 counts, and if more than 50% of those come from <1% of pixels, then it is considered to be noise-dominated and hence unusable.
| Quadrant | # 1 sec bins | Bins with >0 counts | Bins with >2000 counts | High rate bins dominated by noise | Noise dominated (total time) | Noise dominated (detector-on time) | Marked lightcurve |
|---|---|---|---|---|---|---|---|
| A | 6041 | 4656 | 0 | 0 | 0.00% | 0.00% |  |
| B | 6041 | 4656 | 0 | 0 | 0.00% | 0.00% |  |
| C | 6041 | 4656 | 0 | 0 | 0.00% | 0.00% |  |
| D | 6041 | 4656 | 0 | 0 | 0.00% | 0.00% |  |
Top three noisy pixels from each quadrant. If the there are fewer than three noisy pixels in the level2.evt file, extra rows are filled as -1
| Pixel properties | Quadrant properties | ||||||
|---|---|---|---|---|---|---|---|
| Quadrant | DetID | PixID | Counts | Sigma | Mean | Median | Sigma |
| A | 0 | 29 | 275 | 9.3 | 78 | 74 | 21.6 |
| A | 14 | 79 | 240 | 7.68 | 78 | 74 | 21.6 |
| A | 7 | 110 | 239 | 7.63 | 78 | 74 | 21.6 |
| B | 5 | 255 | 202 | 7.41 | 77 | 74 | 17.3 |
| B | 2 | 9 | 200 | 7.3 | 77 | 74 | 17.3 |
| B | 3 | 17 | 193 | 6.89 | 77 | 74 | 17.3 |
| C | 1 | 81 | 243 | 7.72 | 79 | 75 | 21.8 |
| C | 1 | 80 | 238 | 7.49 | 79 | 75 | 21.8 |
| C | 3 | 158 | 203 | 5.88 | 79 | 75 | 21.8 |
| D | 13 | 238 | 177 | 5.48 | 71 | 65 | 20.4 |
| D | 12 | 235 | 177 | 5.48 | 71 | 65 | 20.4 |
| D | 6 | 231 | 173 | 5.29 | 71 | 65 | 20.4 |
Histogram calculated using DETX and DETY for each event in the final _common_clean file
| Quadrant A |  |
 |
Quadrant B |
|---|---|---|---|
| Quadrant D |  |
 |
Quadrant C |
| Plot type | Count rate plots | Images |
|---|---|---|
| Comparison with Poisson distribution Blue bars denote a histogram of data divided into 1 sec bins. Red curve is a Poisson curve with rate = median count rate of data. |
 |
 |
| Quadrant-wise count rates Data is divided into 100 sec bins |
 |
|
| Module-wise count rates for Quadrant A Data is divided into 100 sec bins |
 |
 |
| Module-wise count rates for Quadrant B Data is divided into 100 sec bins |
 |
 |
| Module-wise count rates for Quadrant C Data is divided into 100 sec bins |
 |
 |
| Module-wise count rates for Quadrant D Data is divided into 100 sec bins |
 |
 |
| Parameter | Plot |
|---|---|
| CZT HV Monitor |  |
| D_VDD | 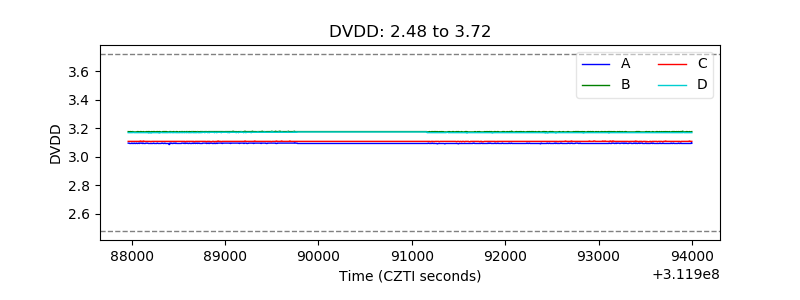 |
| Temperature 1 |  |
| Veto HV Monitor |  |
| Veto LLD |  |
| Alpha Counter |  |
| _CPM_Rate |  |
| CZT Counter |  |
| +2.5 Volts monitor |  |
| +5 Volts monitor |  |
| _ROLL_ROT |  |
| _Roll_DEC |  |
| _Roll_RA |  |
| Veto Counter |  |