| Param | Original file | Final file |
|---|---|---|
| Filename | modeM0/AS1T03_149T04_9000003322_22422cztM0_level2.evt | modeM0/AS1T03_149T04_9000003322_22422cztM0_level2_quad_clean.evt |
| Size (bytes) | 257,446,080 | 39,902,400 |
| Size | 245.5 MB | 38.1 MB |
| Events in quadrant A | 1,692,204 | 243,649 |
| Events in quadrant B | 1,797,307 | 253,779 |
| Events in quadrant C | 1,771,309 | 239,032 |
| Events in quadrant D | 2,305,642 | 232,713 |
| Mode M0 | |||
|---|---|---|---|
| Quadrant | BADHDUFLAG | Total packets | Discarded packets |
| A | 0 | 7063 | 1 |
| B | 0 | 7343 | 1 |
| C | 0 | 7193 | 1 |
| D | 0 | 9083 | 1 |
| Mode M9 | |||
|---|---|---|---|
| Quadrant | BADHDUFLAG | Total packets | Discarded packets |
| A | 0 | 14 | 0 |
| B | 0 | 14 | 0 |
| C | 0 | 14 | 0 |
| D | 0 | 14 | 0 |
| Mode SS | |||
|---|---|---|---|
| Quadrant | BADHDUFLAG | Total packets | Discarded packets |
| A | 0 | 70 | 0 |
| B | 0 | 70 | 0 |
| C | 0 | 70 | 0 |
| D | 0 | 70 | 0 |
| Quadrant | Total seconds | Saturated seconds | Saturation percentage |
|---|---|---|---|
| A | 3362 | 11 | 0.327186% |
| B | 3362 | 32 | 0.951814% |
| C | 3362 | 46 | 1.368233% |
| D | 3362 | 323 | 9.607377% |
Noise dominated data is calculated using 1-second bins in cleaned event files. If a bin has >2000 counts, and if more than 50% of those come from <1% of pixels, then it is considered to be noise-dominated and hence unusable.
| Quadrant | # 1 sec bins | Bins with >0 counts | Bins with >2000 counts | High rate bins dominated by noise | Noise dominated (total time) | Noise dominated (detector-on time) | Marked lightcurve |
|---|---|---|---|---|---|---|---|
| A | 4747 | 3363 | 0 | 0 | 0.00% | 0.00% | 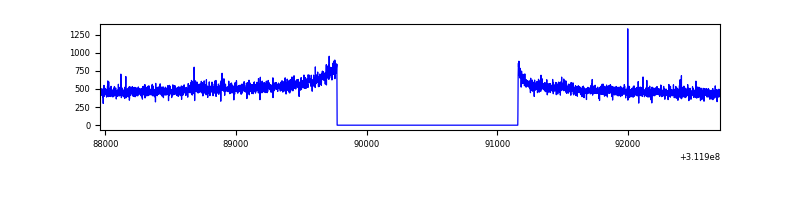 |
| B | 4747 | 3363 | 5 | 5 | 0.11% | 0.15% | 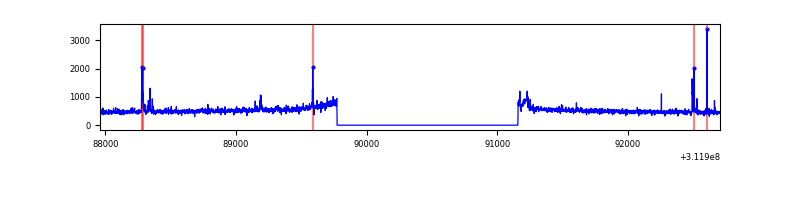 |
| C | 4747 | 3363 | 8 | 8 | 0.17% | 0.24% | 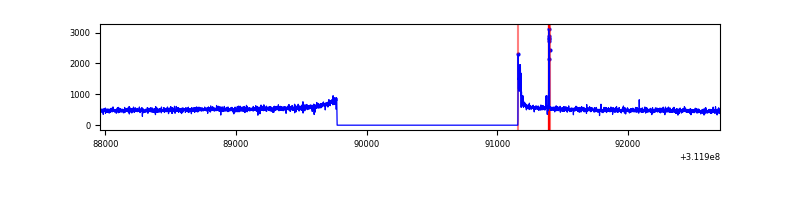 |
| D | 4747 | 3363 | 289 | 289 | 6.09% | 8.59% | 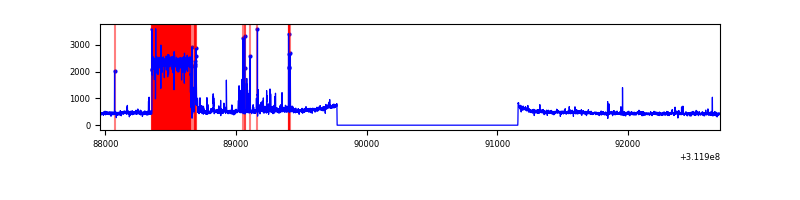 |
Top three noisy pixels from each quadrant. If the there are fewer than three noisy pixels in the level2.evt file, extra rows are filled as -1
| Pixel properties | Quadrant properties | ||||||
|---|---|---|---|---|---|---|---|
| Quadrant | DetID | PixID | Counts | Sigma | Mean | Median | Sigma |
| A | 2 | 79 | 8674 | 93.53 | 436 | 426 | 88.2 |
| A | 13 | 254 | 4476 | 45.92 | 436 | 426 | 88.2 |
| A | 0 | 226 | 3747 | 37.66 | 436 | 426 | 88.2 |
| B | 3 | 64 | 40055 | 476.72 | 438 | 428 | 83.1 |
| B | 4 | 173 | 37099 | 441.16 | 438 | 428 | 83.1 |
| B | 12 | 111 | 9754 | 112.19 | 438 | 428 | 83.1 |
| C | 14 | 238 | 67926 | 676.59 | 424 | 427 | 99.8 |
| C | 0 | 10 | 23990 | 236.19 | 424 | 427 | 99.8 |
| C | 10 | 22 | 20467 | 200.87 | 424 | 427 | 99.8 |
| D | 1 | 52 | 748887 | 7645.18 | 405 | 392 | 97.9 |
| D | 13 | 172 | 15159 | 150.83 | 405 | 392 | 97.9 |
| D | 2 | 234 | 13156 | 130.37 | 405 | 392 | 97.9 |
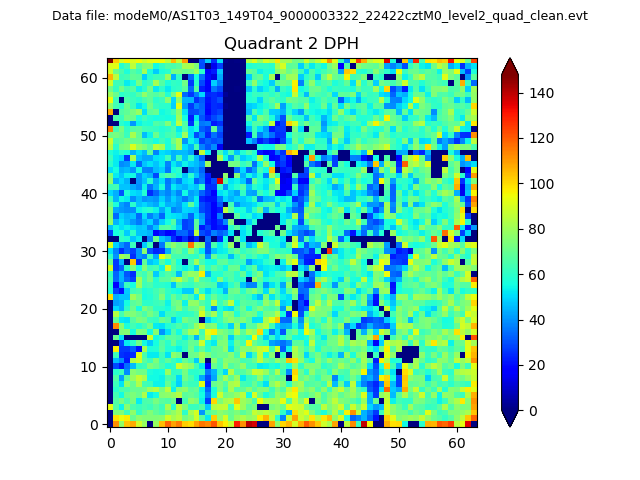
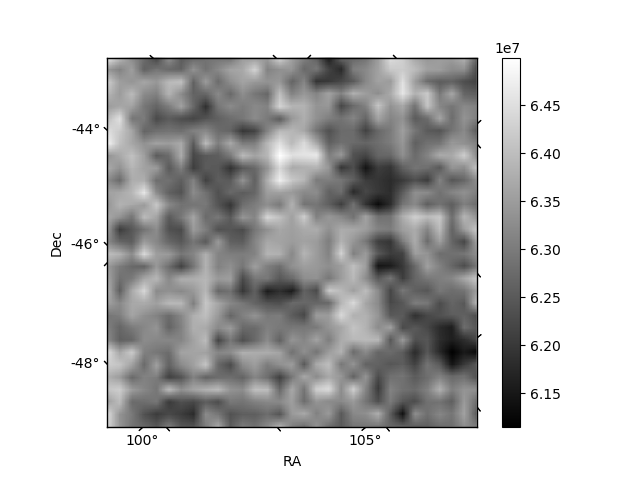
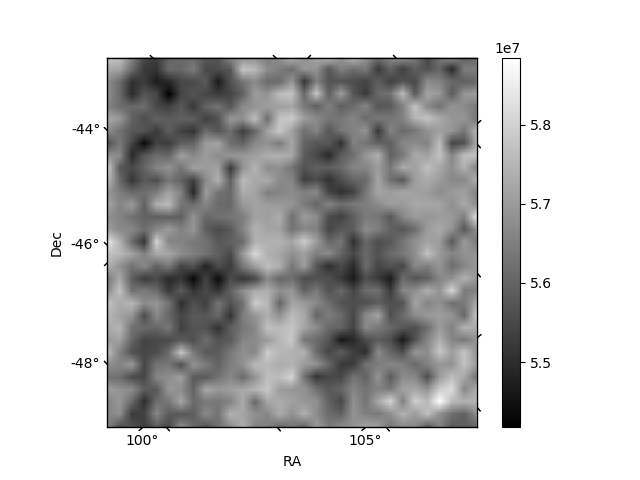
Histogram calculated using DETX and DETY for each event in the final _common_clean file
| Quadrant A | 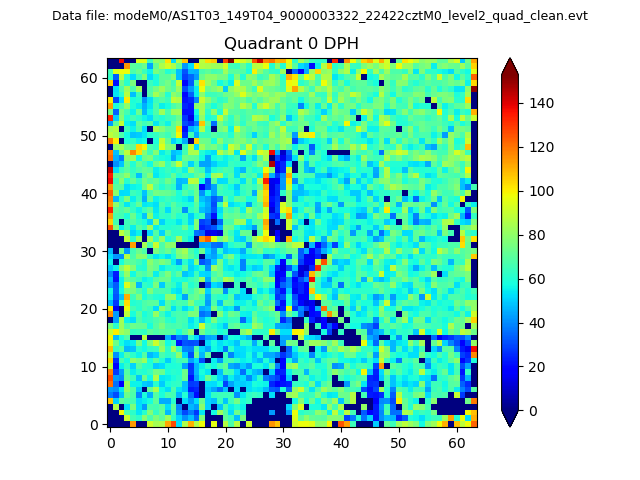 |
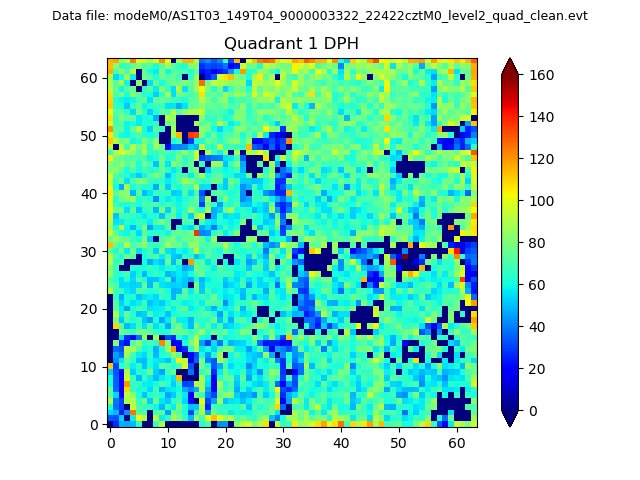 |
Quadrant B |
|---|---|---|---|
| Quadrant D | 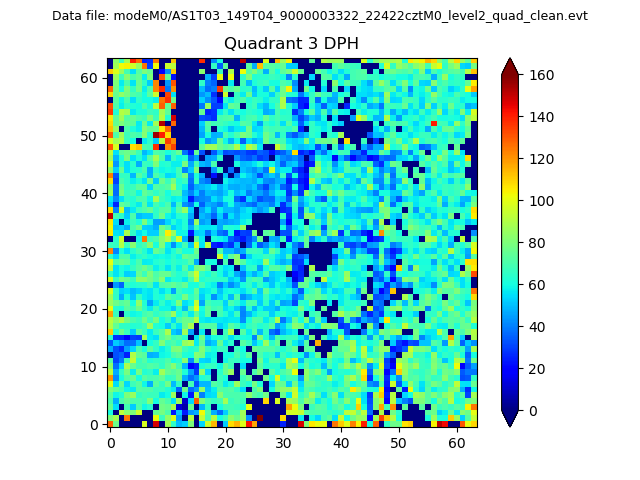 |
 |
Quadrant C |
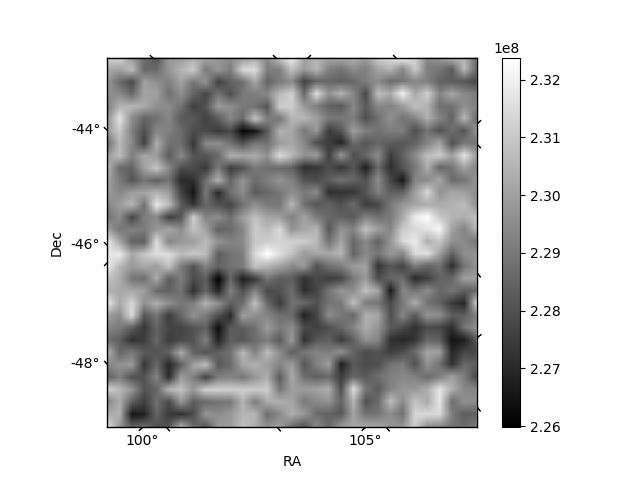
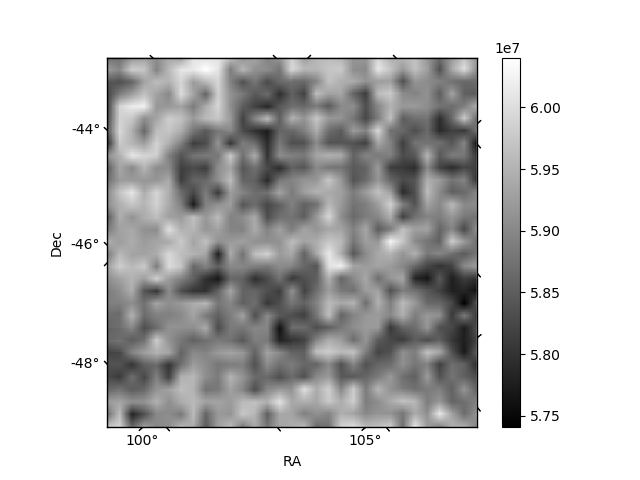
| Plot type | Count rate plots | Images |
|---|---|---|
| Comparison with Poisson distribution Blue bars denote a histogram of data divided into 1 sec bins. Red curve is a Poisson curve with rate = median count rate of data. |
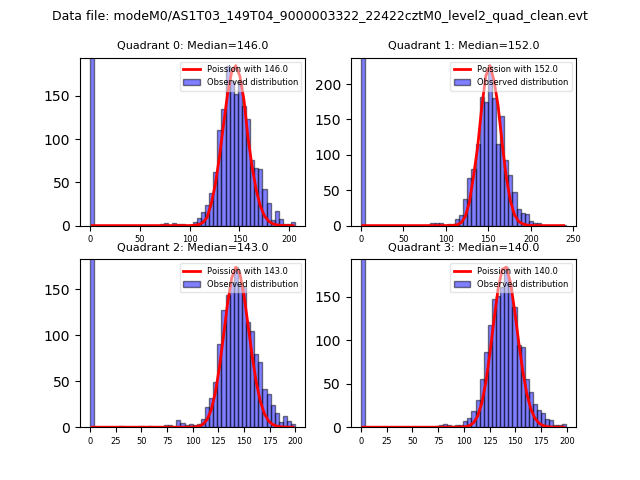 |
 |
| Quadrant-wise count rates Data is divided into 100 sec bins |
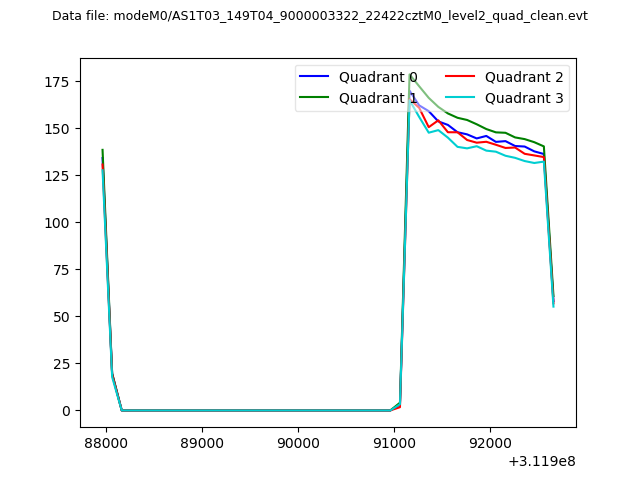 |
|
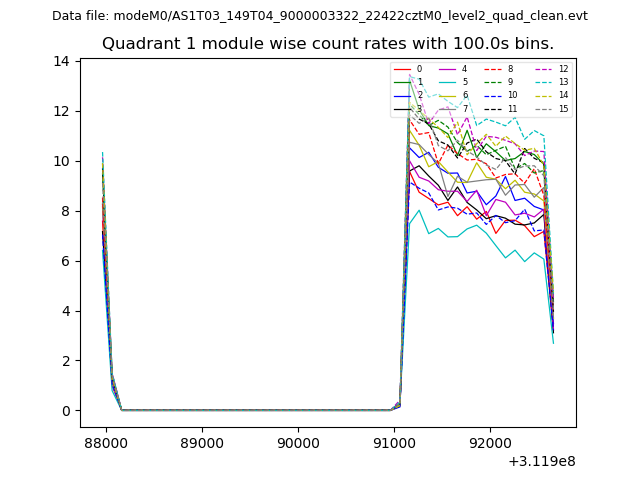
| Module-wise count rates for Quadrant A Data is divided into 100 sec bins |
 |
 |
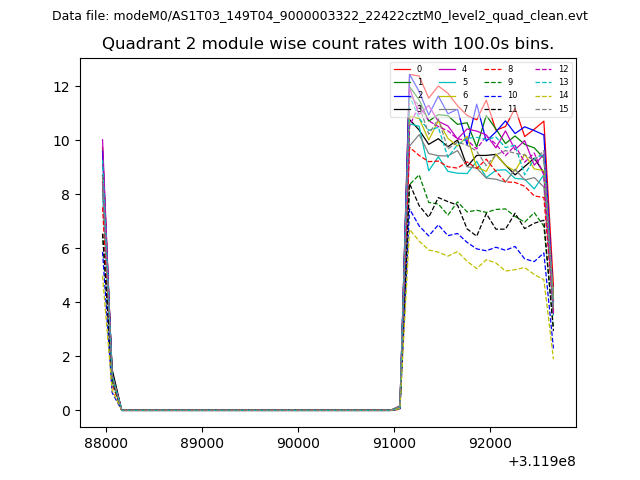
| Module-wise count rates for Quadrant B Data is divided into 100 sec bins |
 |
 |
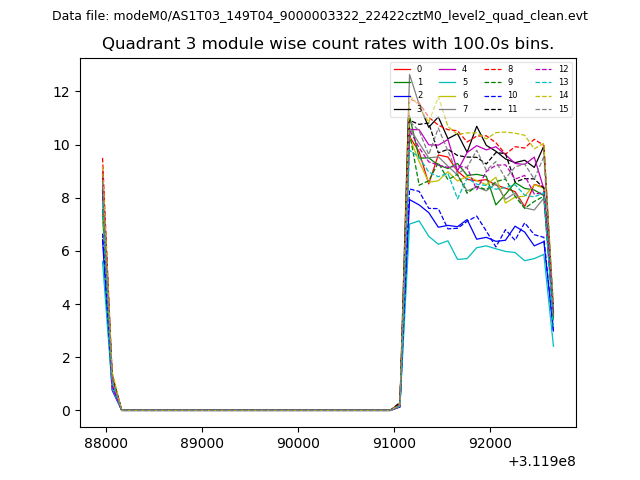
| Module-wise count rates for Quadrant C Data is divided into 100 sec bins |
 |
 |
| Module-wise count rates for Quadrant D Data is divided into 100 sec bins |
 |
 |
| Parameter | Plot |
|---|---|
| CZT HV Monitor | 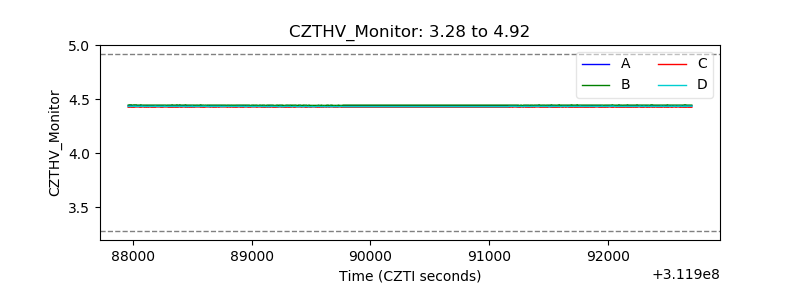 |
| D_VDD | 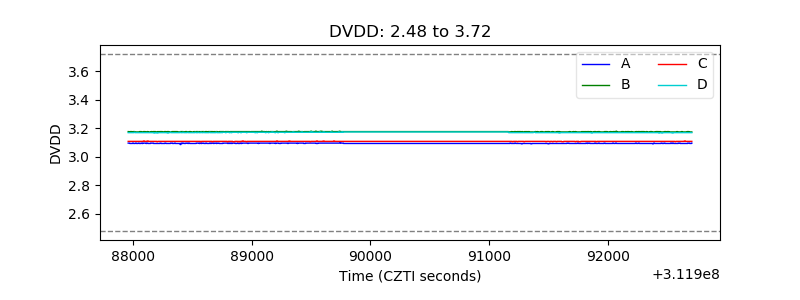 |
| Temperature 1 |  |
| Veto HV Monitor | 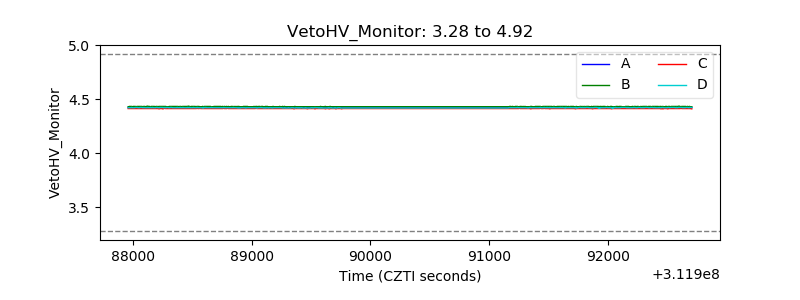 |
| Veto LLD | 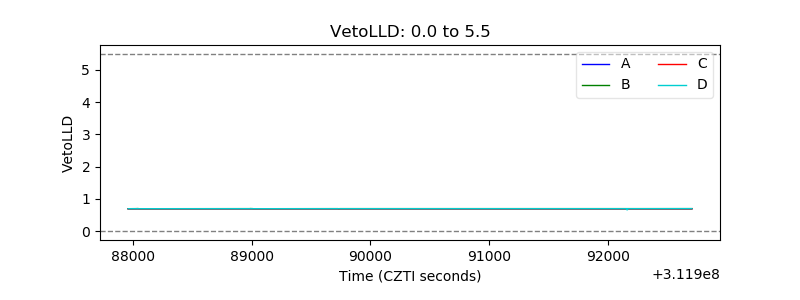 |
| Alpha Counter | 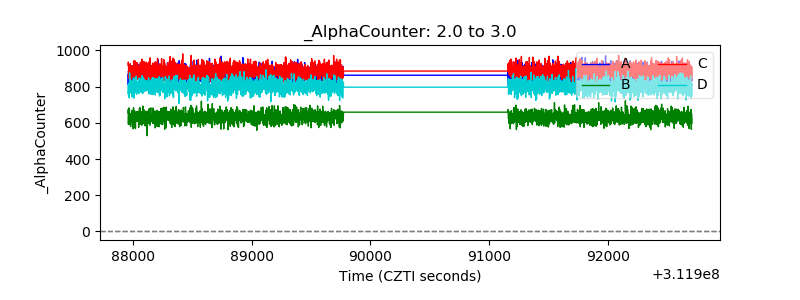 |
| _CPM_Rate | 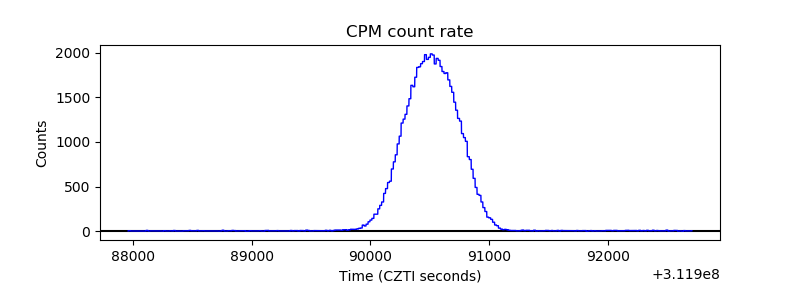 |
| CZT Counter | 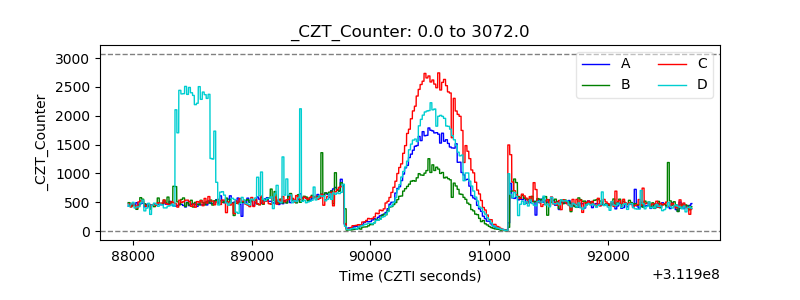 |
| +2.5 Volts monitor |  |
| +5 Volts monitor |  |
| _ROLL_ROT |  |
| _Roll_DEC |  |
| _Roll_RA | 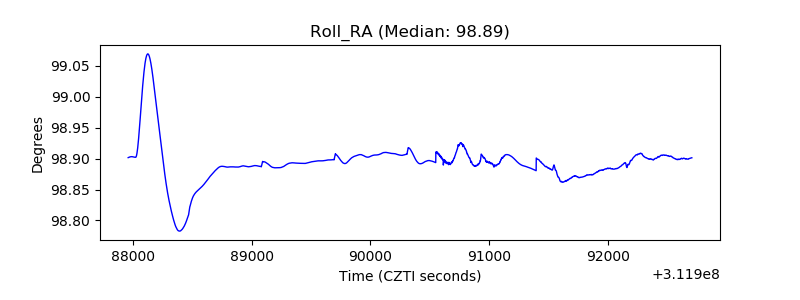 |
| Veto Counter | 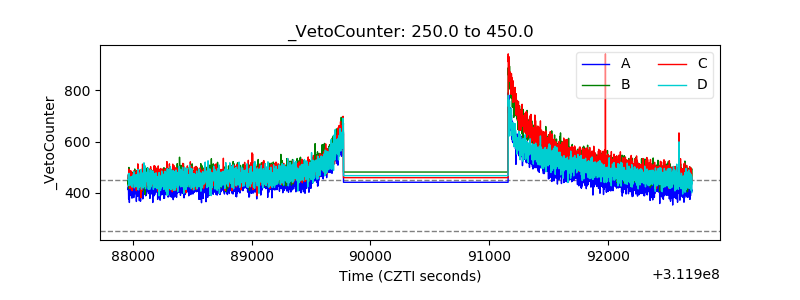 |