| Param | Original file | Final file |
|---|---|---|
| Filename | modeM0/AS1T03_149T04_9000003322_22423cztM0_level2.evt | modeM0/AS1T03_149T04_9000003322_22423cztM0_level2_quad_clean.evt |
| Size (bytes) | 183,317,760 | 57,741,120 |
| Size | 174.8 MB | 55.1 MB |
| Events in quadrant A | 1,307,855 | 389,605 |
| Events in quadrant B | 1,388,730 | 405,014 |
| Events in quadrant C | 1,399,916 | 380,714 |
| Events in quadrant D | 1,259,523 | 369,904 |
| Mode M0 | |||
|---|---|---|---|
| Quadrant | BADHDUFLAG | Total packets | Discarded packets |
| A | 0 | 5773 | 1 |
| B | 0 | 5930 | 1 |
| C | 0 | 5923 | 1 |
| D | 0 | 5763 | 1 |
| Mode M9 | |||
|---|---|---|---|
| Quadrant | BADHDUFLAG | Total packets | Discarded packets |
| A | 0 | 2 | 0 |
| B | 0 | 3 | 0 |
| C | 0 | 3 | 0 |
| D | 0 | 3 | 0 |
| Mode SS | |||
|---|---|---|---|
| Quadrant | BADHDUFLAG | Total packets | Discarded packets |
| A | 0 | 58 | 0 |
| B | 0 | 58 | 0 |
| C | 0 | 58 | 0 |
| D | 0 | 58 | 0 |
| Quadrant | Total seconds | Saturated seconds | Saturation percentage |
|---|---|---|---|
| A | 2841 | 2 | 0.070398% |
| B | 2841 | 7 | 0.246392% |
| C | 2841 | 28 | 0.985568% |
| D | 2841 | 3 | 0.105597% |
Noise dominated data is calculated using 1-second bins in cleaned event files. If a bin has >2000 counts, and if more than 50% of those come from <1% of pixels, then it is considered to be noise-dominated and hence unusable.
| Quadrant | # 1 sec bins | Bins with >0 counts | Bins with >2000 counts | High rate bins dominated by noise | Noise dominated (total time) | Noise dominated (detector-on time) | Marked lightcurve |
|---|---|---|---|---|---|---|---|
| A | 2841 | 2841 | 0 | 0 | 0.00% | 0.00% | 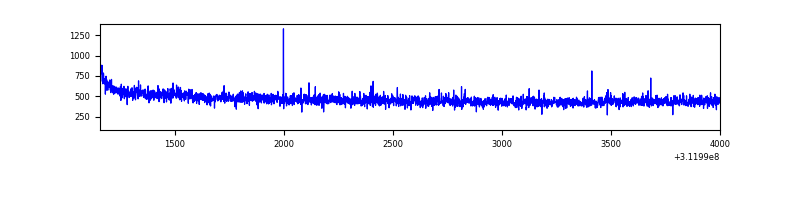 |
| B | 2841 | 2841 | 2 | 2 | 0.07% | 0.07% | 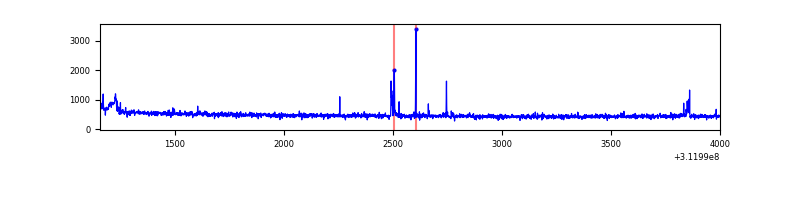 |
| C | 2841 | 2841 | 8 | 8 | 0.28% | 0.28% | 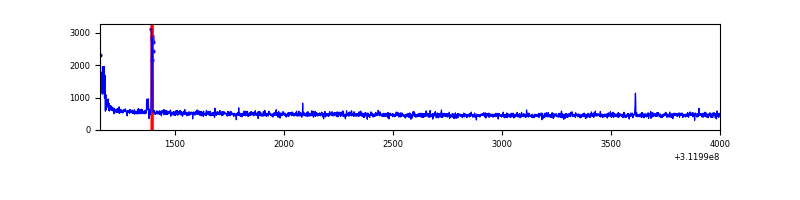 |
| D | 2841 | 2841 | 0 | 0 | 0.00% | 0.00% | 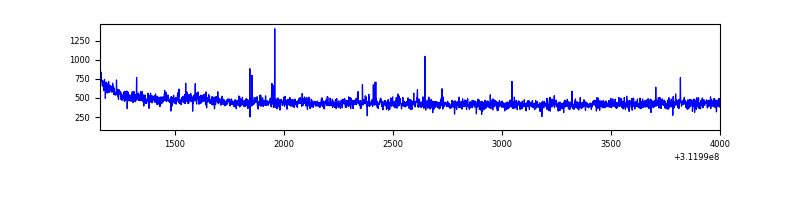 |
Top three noisy pixels from each quadrant. If the there are fewer than three noisy pixels in the level2.evt file, extra rows are filled as -1
| Pixel properties | Quadrant properties | ||||||
|---|---|---|---|---|---|---|---|
| Quadrant | DetID | PixID | Counts | Sigma | Mean | Median | Sigma |
| A | 2 | 79 | 5539 | 76.9 | 336 | 330 | 67.7 |
| A | 13 | 254 | 3830 | 51.67 | 336 | 330 | 67.7 |
| A | 3 | 1 | 3614 | 48.48 | 336 | 330 | 67.7 |
| B | 4 | 173 | 25415 | 382.3 | 343 | 334 | 65.6 |
| B | 3 | 64 | 23476 | 352.75 | 343 | 334 | 65.6 |
| B | 12 | 111 | 7504 | 109.29 | 343 | 334 | 65.6 |
| C | 14 | 238 | 52538 | 662.97 | 333 | 336 | 78.7 |
| C | 0 | 10 | 23899 | 299.25 | 333 | 336 | 78.7 |
| C | 10 | 22 | 22826 | 285.62 | 333 | 336 | 78.7 |
| D | 2 | 234 | 11033 | 134.22 | 329 | 322 | 79.8 |
| D | 13 | 104 | 8921 | 107.75 | 329 | 322 | 79.8 |
| D | 14 | 226 | 3259 | 36.8 | 329 | 322 | 79.8 |
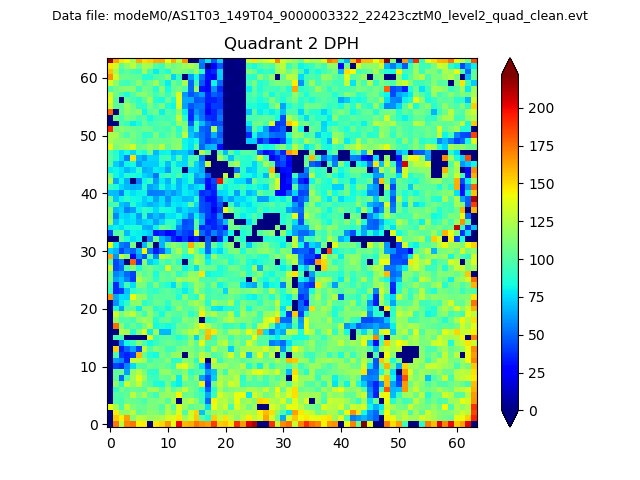
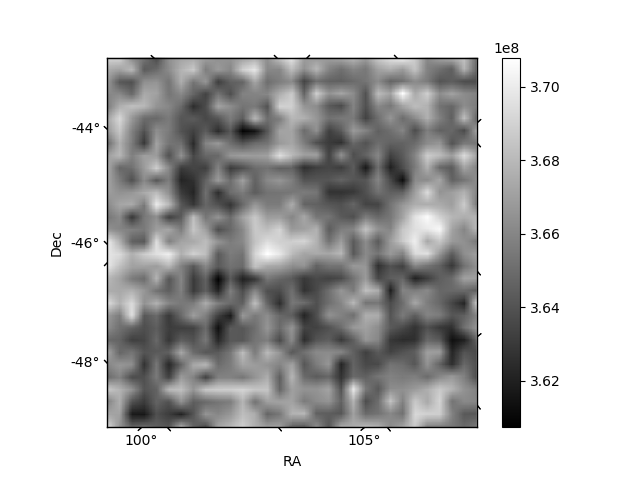
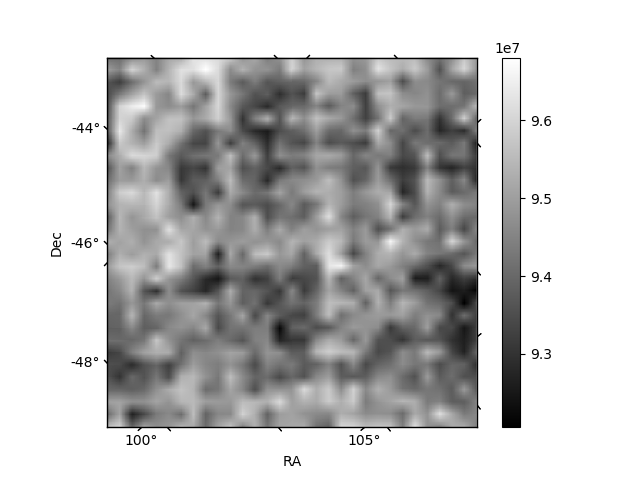
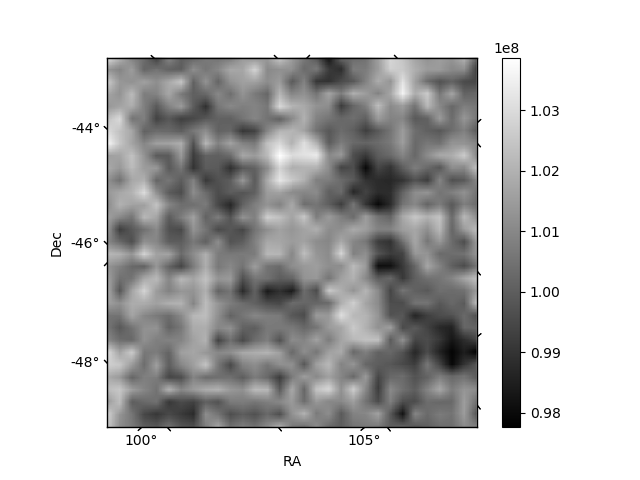
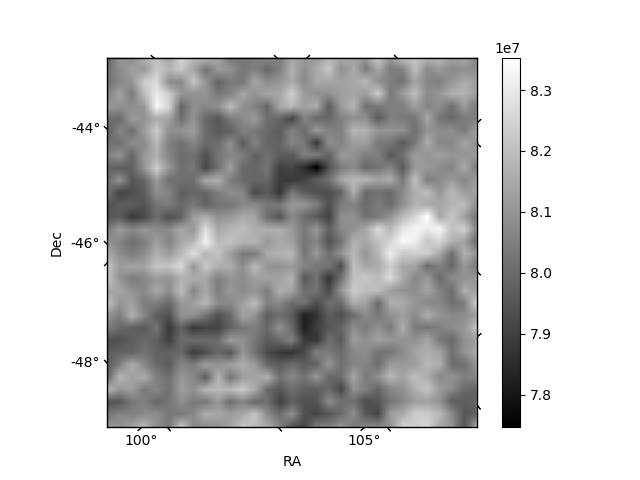
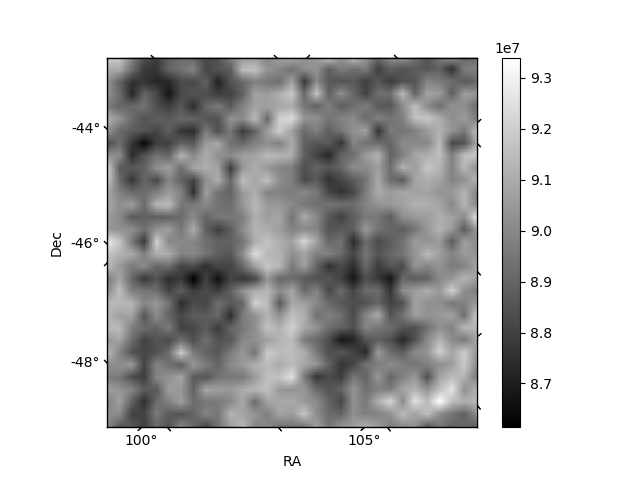
Histogram calculated using DETX and DETY for each event in the final _common_clean file
| Quadrant A | 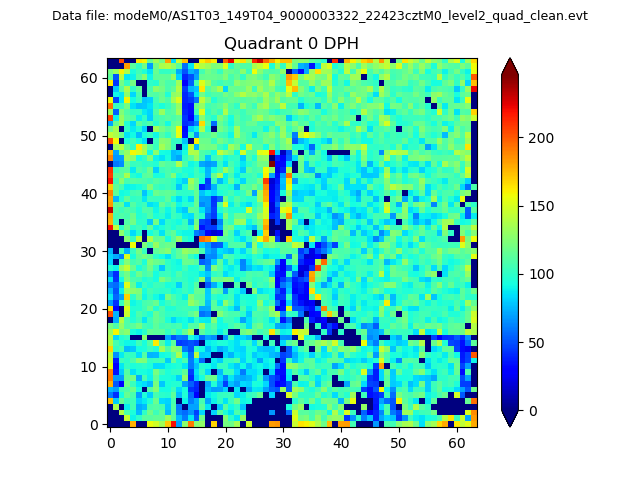 |
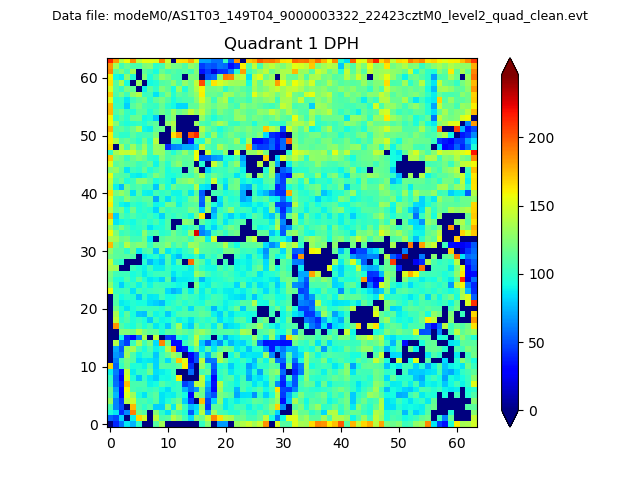 |
Quadrant B |
|---|---|---|---|
| Quadrant D | 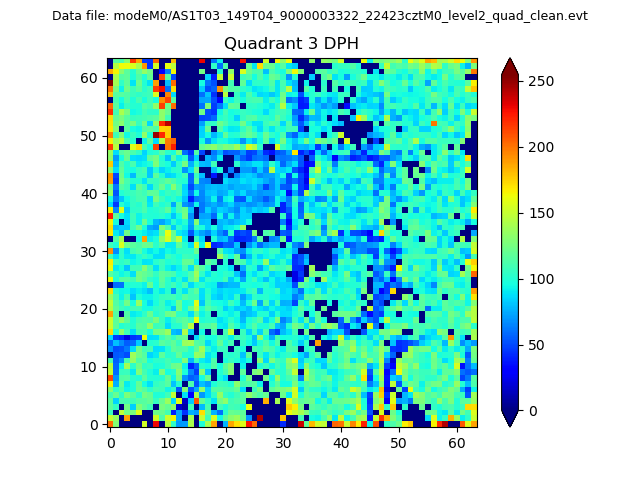 |
 |
Quadrant C |
| Plot type | Count rate plots | Images |
|---|---|---|
| Comparison with Poisson distribution Blue bars denote a histogram of data divided into 1 sec bins. Red curve is a Poisson curve with rate = median count rate of data. |
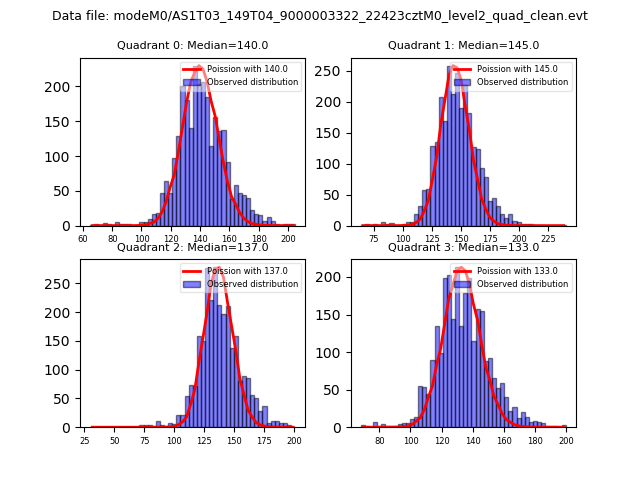 |
 |
| Quadrant-wise count rates Data is divided into 100 sec bins |
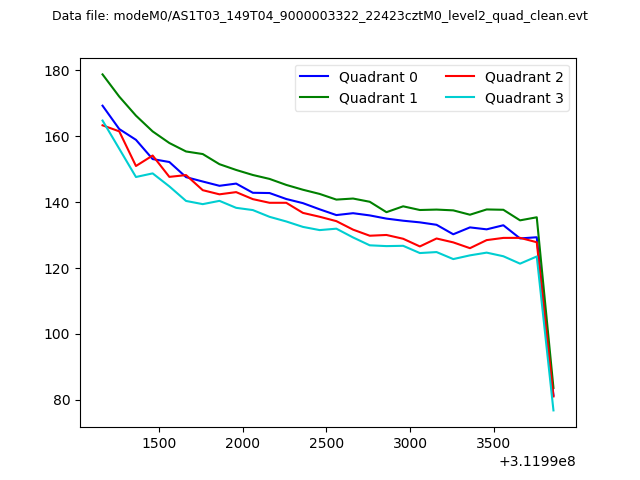 |
|
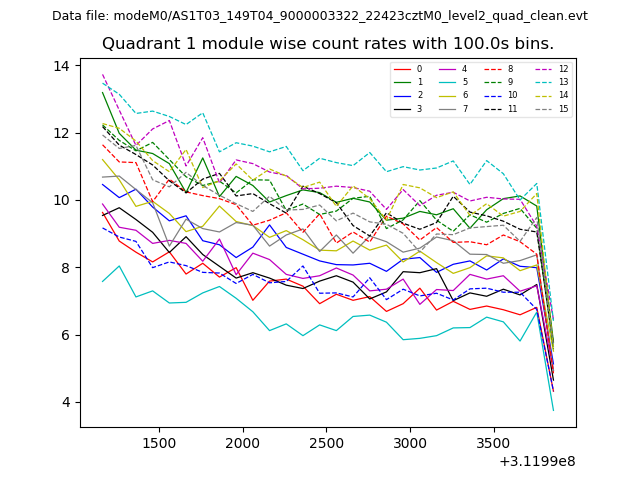
| Module-wise count rates for Quadrant A Data is divided into 100 sec bins |
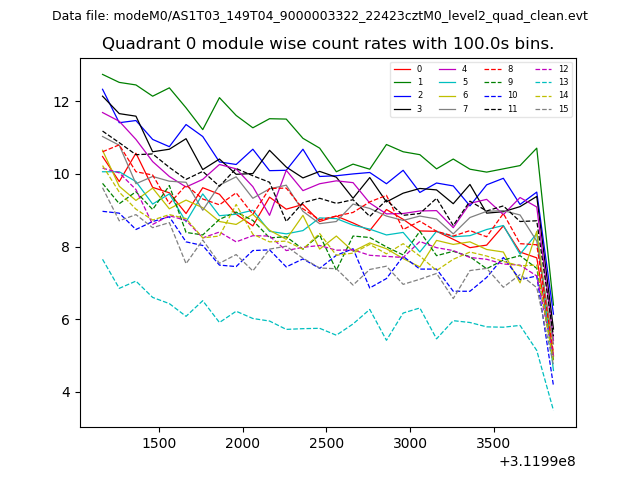 |
 |
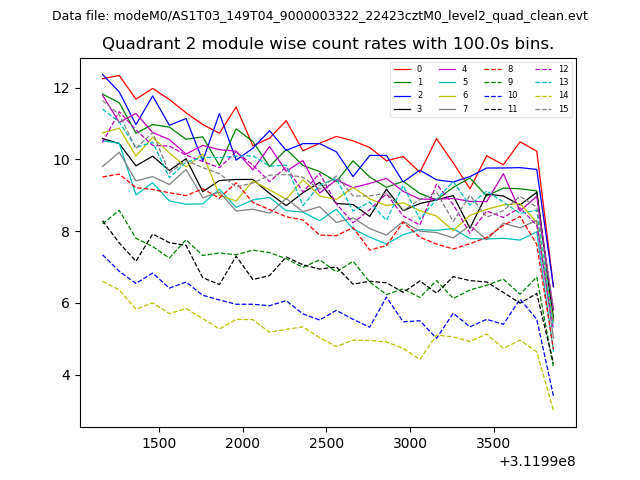
| Module-wise count rates for Quadrant B Data is divided into 100 sec bins |
 |
 |
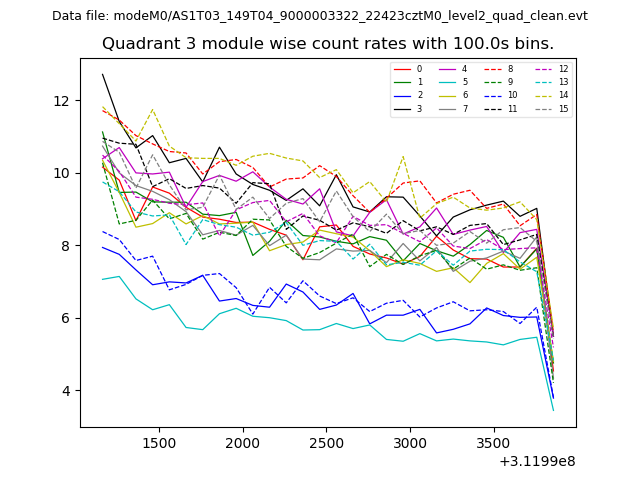
| Module-wise count rates for Quadrant C Data is divided into 100 sec bins |
 |
 |
| Module-wise count rates for Quadrant D Data is divided into 100 sec bins |
 |
 |
| Parameter | Plot |
|---|---|
| CZT HV Monitor | 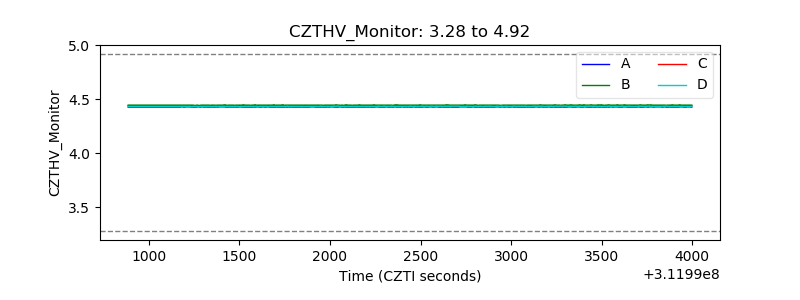 |
| D_VDD | 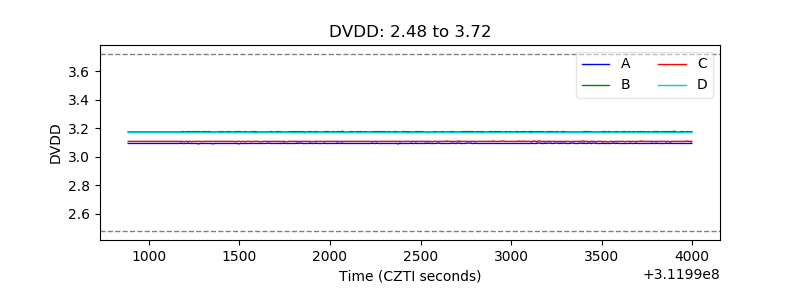 |
| Temperature 1 | 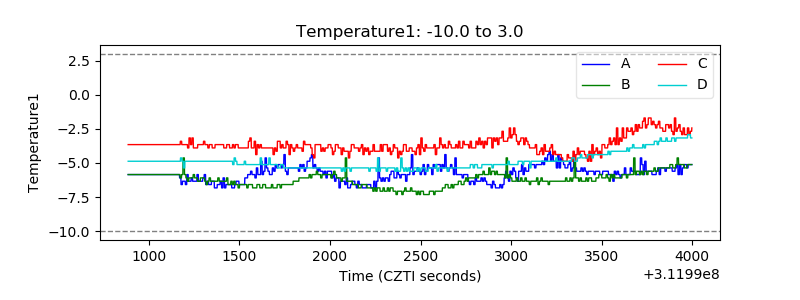 |
| Veto HV Monitor | 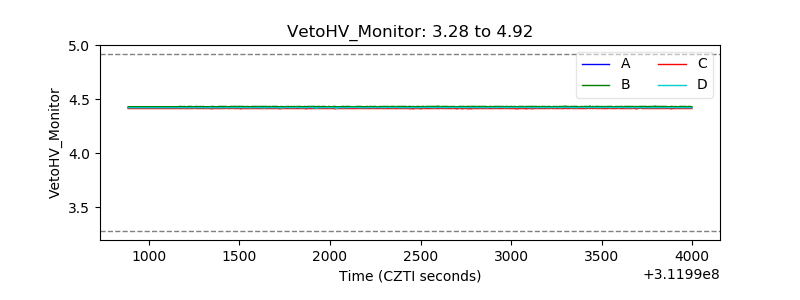 |
| Veto LLD | 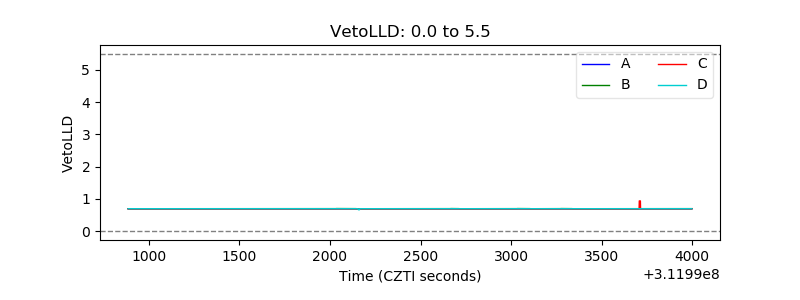 |
| Alpha Counter | 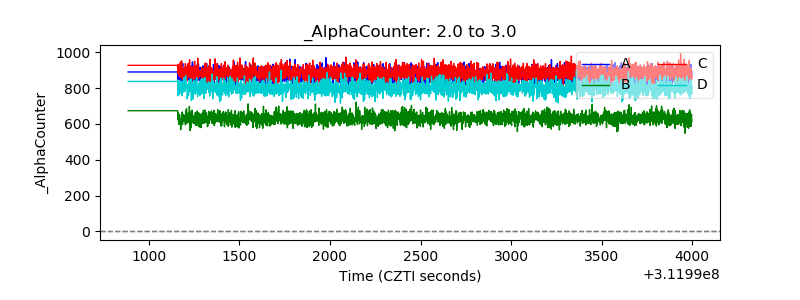 |
| _CPM_Rate | 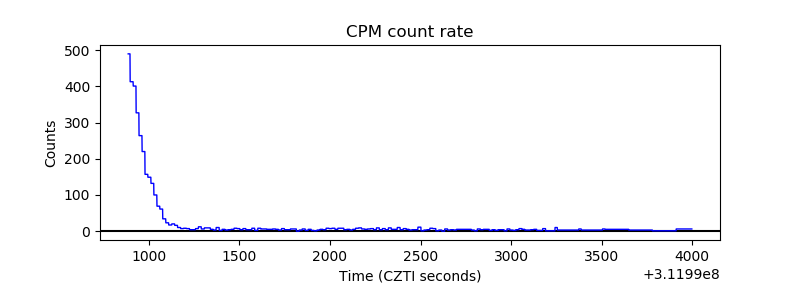 |
| CZT Counter | 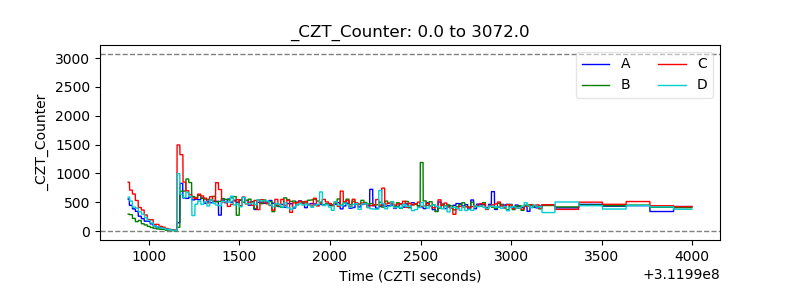 |
| +2.5 Volts monitor | 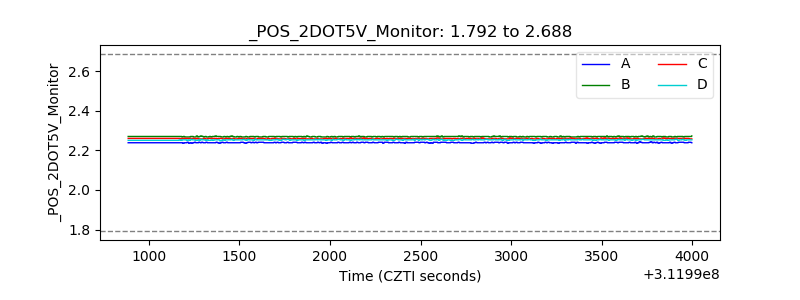 |
| +5 Volts monitor | 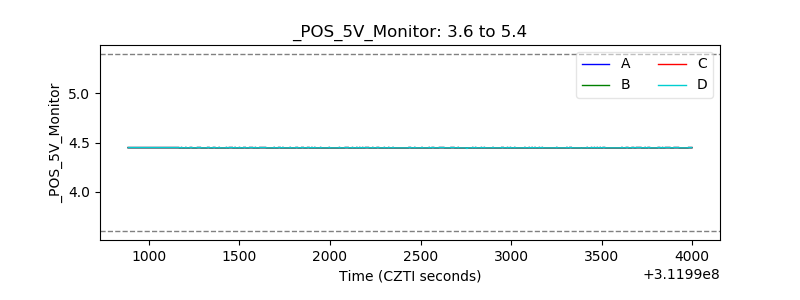 |
| _ROLL_ROT | 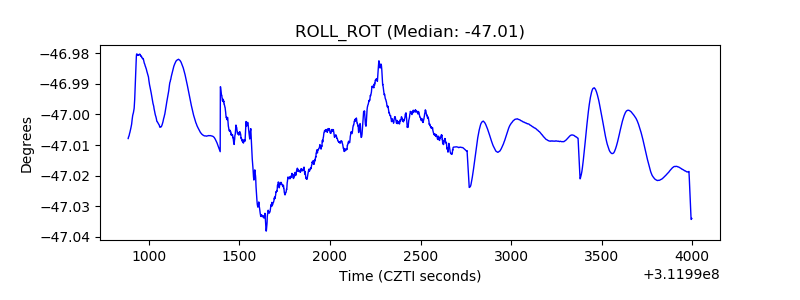 |
| _Roll_DEC | 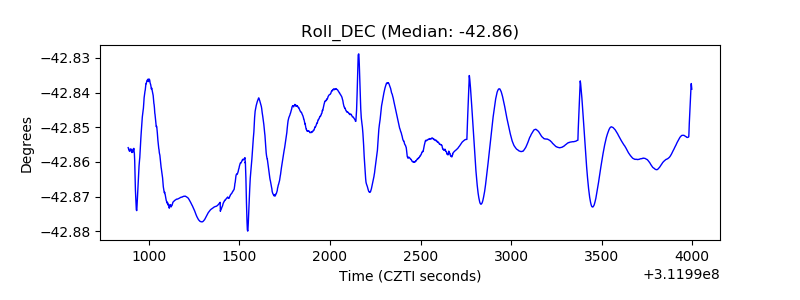 |
| _Roll_RA | 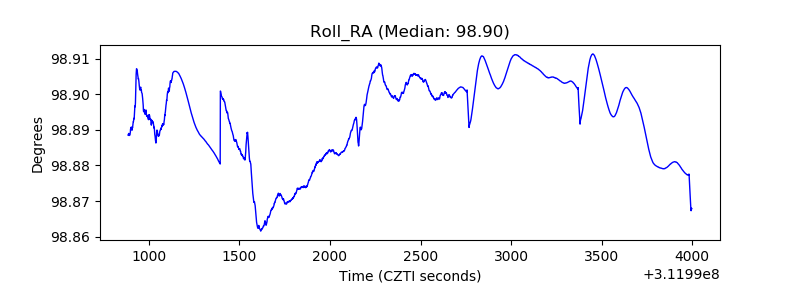 |
| Veto Counter | 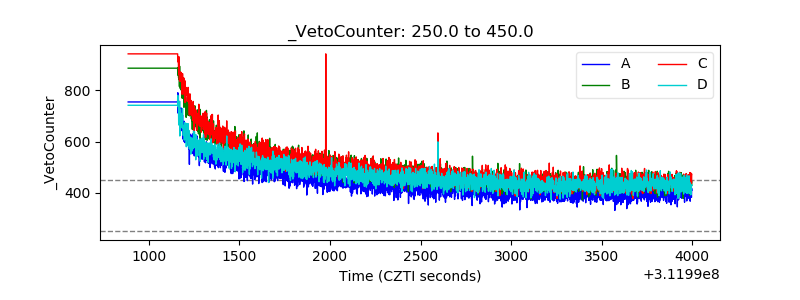 |