| Param | Original file | Final file |
|---|---|---|
| Filename | modeM0/AS1A07_056T01_9000003330_22437cztM0_level2.evt | modeM0/AS1A07_056T01_9000003330_22437cztM0_level2_quad_clean.evt |
| Size (bytes) | 264,156,480 | 80,907,840 |
| Size | 251.9 MB | 77.2 MB |
| Events in quadrant A | 1,905,274 | 545,913 |
| Events in quadrant B | 1,991,014 | 565,781 |
| Events in quadrant C | 1,937,978 | 536,395 |
| Events in quadrant D | 1,891,982 | 519,648 |
| Mode SS | |||
|---|---|---|---|
| Quadrant | BADHDUFLAG | Total packets | Discarded packets |
| A | 0 | 82 | 0 |
| B | 0 | 82 | 0 |
| C | 0 | 82 | 0 |
| D | 0 | 82 | 0 |
| Mode M9 | |||
|---|---|---|---|
| Quadrant | BADHDUFLAG | Total packets | Discarded packets |
| A | 0 | 13 | 0 |
| B | 0 | 13 | 0 |
| C | 0 | 13 | 0 |
| D | 0 | 13 | 0 |
| Mode M0 | |||
|---|---|---|---|
| Quadrant | BADHDUFLAG | Total packets | Discarded packets |
| A | 0 | 8322 | 1 |
| B | 0 | 8547 | 1 |
| C | 0 | 8389 | 1 |
| D | 0 | 8457 | 1 |
| Quadrant | Total seconds | Saturated seconds | Saturation percentage |
|---|---|---|---|
| A | 4005 | 31 | 0.774032% |
| B | 4005 | 38 | 0.948814% |
| C | 4005 | 62 | 1.548065% |
| D | 4005 | 18 | 0.449438% |
Noise dominated data is calculated using 1-second bins in cleaned event files. If a bin has >2000 counts, and if more than 50% of those come from <1% of pixels, then it is considered to be noise-dominated and hence unusable.
| Quadrant | # 1 sec bins | Bins with >0 counts | Bins with >2000 counts | High rate bins dominated by noise | Noise dominated (total time) | Noise dominated (detector-on time) | Marked lightcurve |
|---|---|---|---|---|---|---|---|
| A | 5285 | 4006 | 0 | 0 | 0.00% | 0.00% | 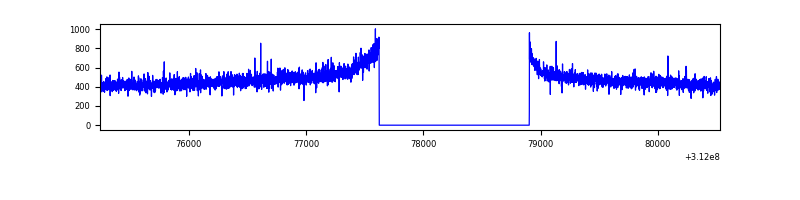 |
| B | 5285 | 4006 | 1 | 1 | 0.02% | 0.02% | 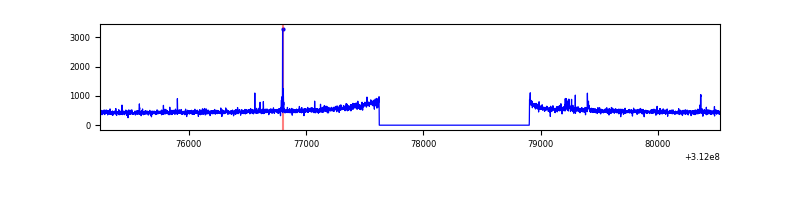 |
| C | 5285 | 4006 | 0 | 0 | 0.00% | 0.00% | 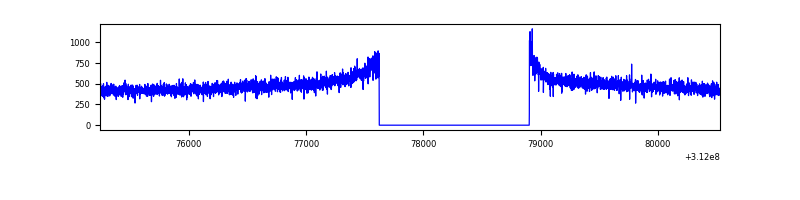 |
| D | 5285 | 4006 | 2 | 2 | 0.04% | 0.05% | 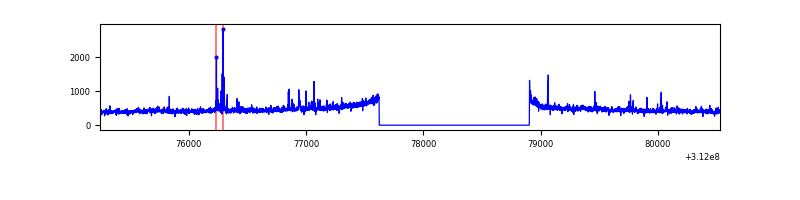 |
Top three noisy pixels from each quadrant. If the there are fewer than three noisy pixels in the level2.evt file, extra rows are filled as -1
| Pixel properties | Quadrant properties | ||||||
|---|---|---|---|---|---|---|---|
| Quadrant | DetID | PixID | Counts | Sigma | Mean | Median | Sigma |
| A | 3 | 1 | 6474 | 60.58 | 492 | 482 | 98.9 |
| A | 13 | 254 | 4503 | 40.65 | 492 | 482 | 98.9 |
| A | 3 | 137 | 4161 | 37.19 | 492 | 482 | 98.9 |
| B | 0 | 229 | 16219 | 169.22 | 495 | 484 | 93.0 |
| B | 4 | 216 | 12340 | 127.5 | 495 | 484 | 93.0 |
| B | 0 | 197 | 12164 | 125.61 | 495 | 484 | 93.0 |
| C | 14 | 238 | 75782 | 691.99 | 474 | 477 | 108.8 |
| C | 1 | 16 | 9632 | 84.13 | 474 | 477 | 108.8 |
| C | 0 | 10 | 3658 | 29.23 | 474 | 477 | 108.8 |
| D | 1 | 52 | 41918 | 355.63 | 476 | 461 | 116.6 |
| D | 2 | 136 | 20483 | 171.75 | 476 | 461 | 116.6 |
| D | 2 | 234 | 16591 | 138.37 | 476 | 461 | 116.6 |
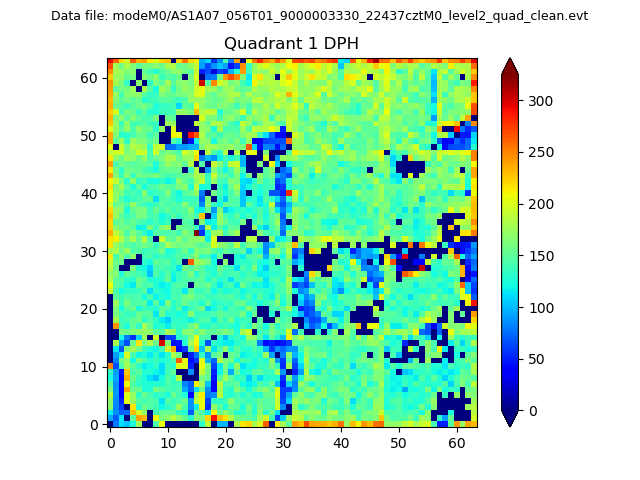
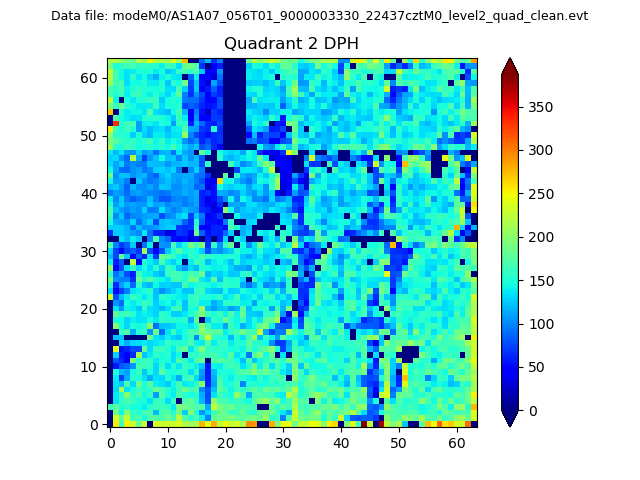
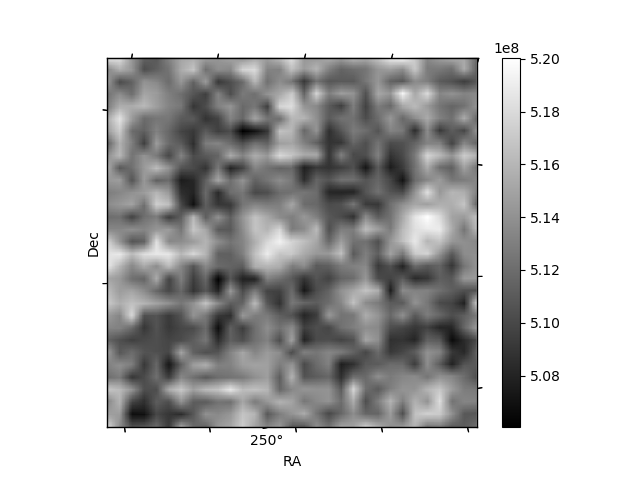
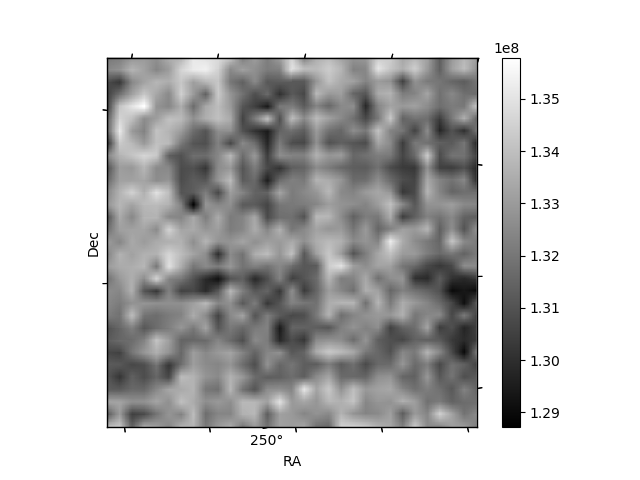
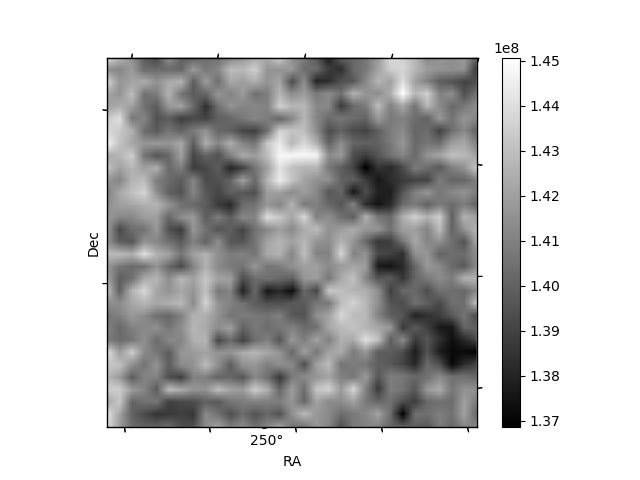
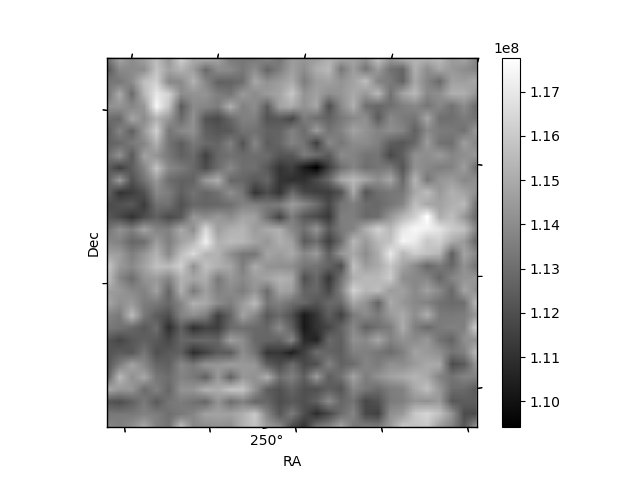
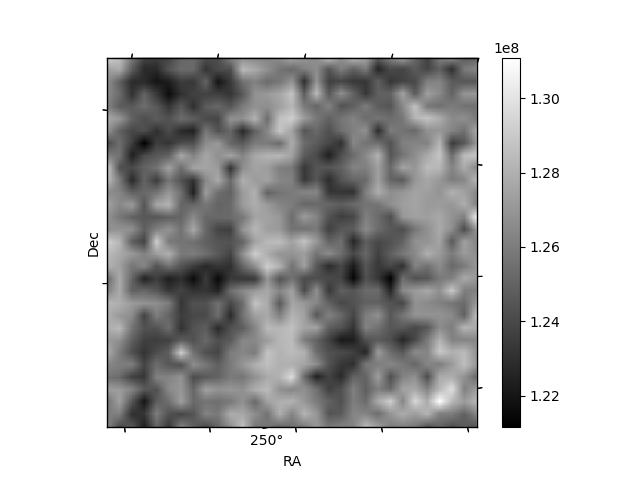
Histogram calculated using DETX and DETY for each event in the final _common_clean file
| Quadrant A |  |
 |
Quadrant B |
|---|---|---|---|
| Quadrant D | 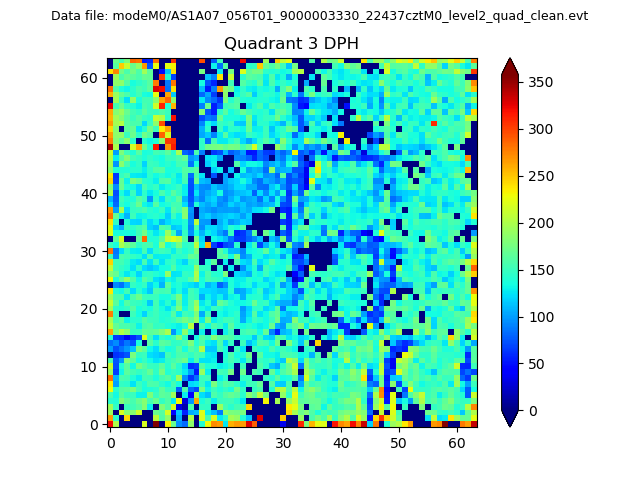 |
 |
Quadrant C |
| Plot type | Count rate plots | Images |
|---|---|---|
| Comparison with Poisson distribution Blue bars denote a histogram of data divided into 1 sec bins. Red curve is a Poisson curve with rate = median count rate of data. |
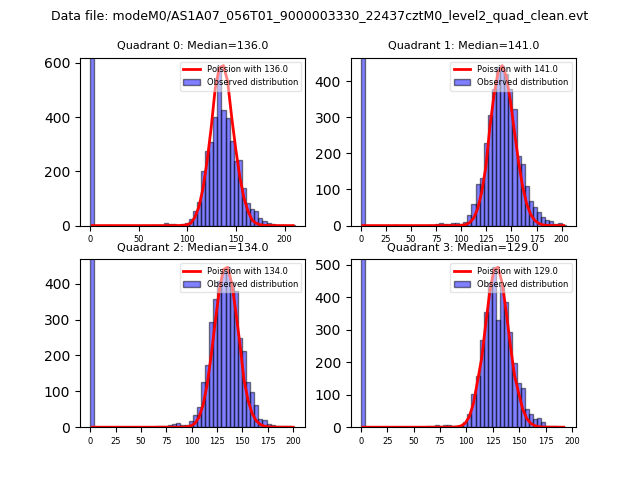 |
 |
| Quadrant-wise count rates Data is divided into 100 sec bins |
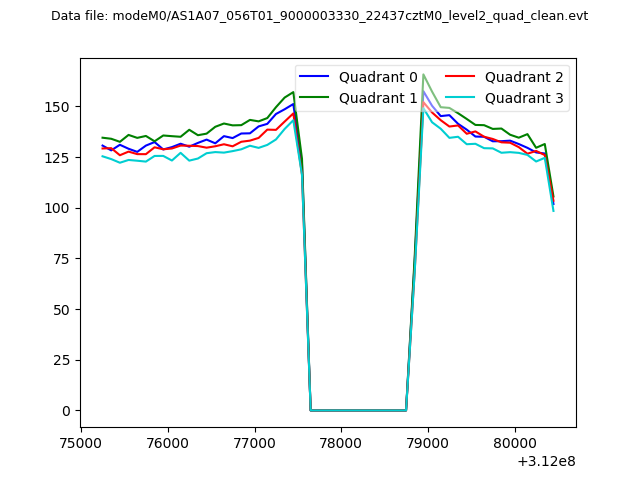 |
|
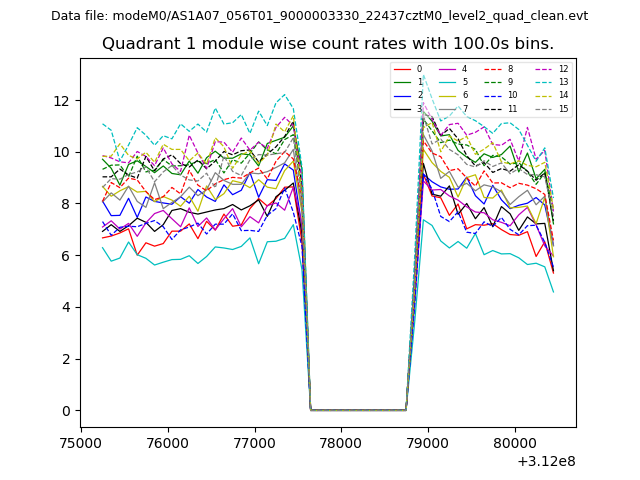
| Module-wise count rates for Quadrant A Data is divided into 100 sec bins |
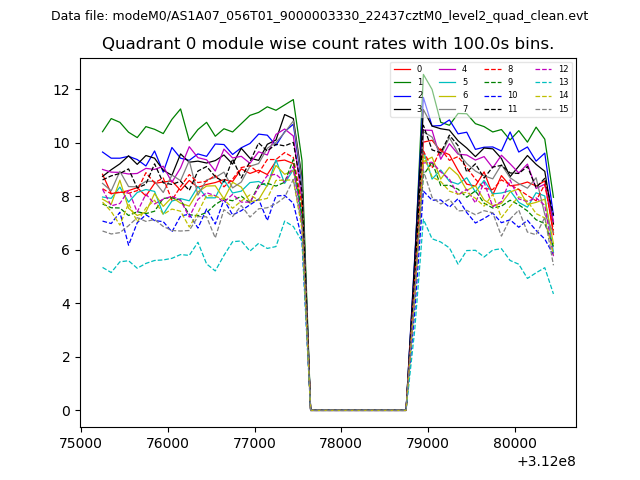 |
 |
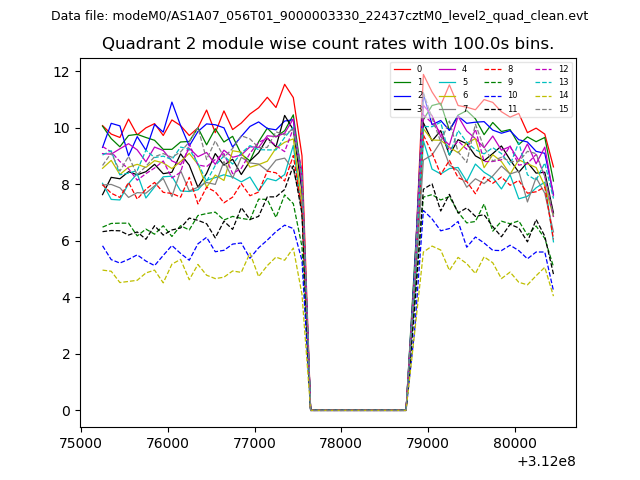
| Module-wise count rates for Quadrant B Data is divided into 100 sec bins |
 |
 |
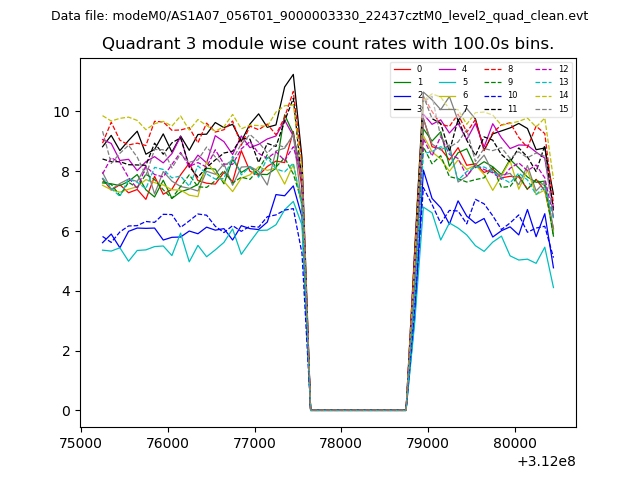
| Module-wise count rates for Quadrant C Data is divided into 100 sec bins |
 |
 |
| Module-wise count rates for Quadrant D Data is divided into 100 sec bins |
 |
 |
| Parameter | Plot |
|---|---|
| CZT HV Monitor | 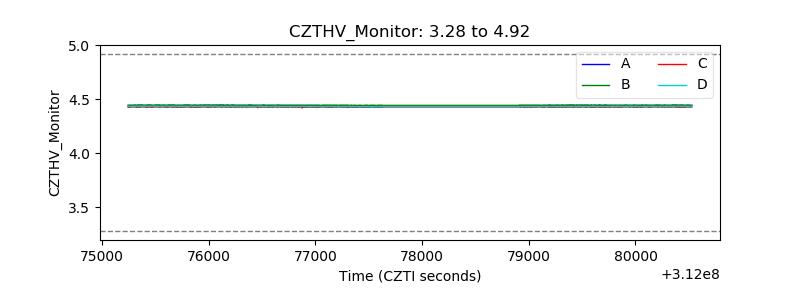 |
| D_VDD | 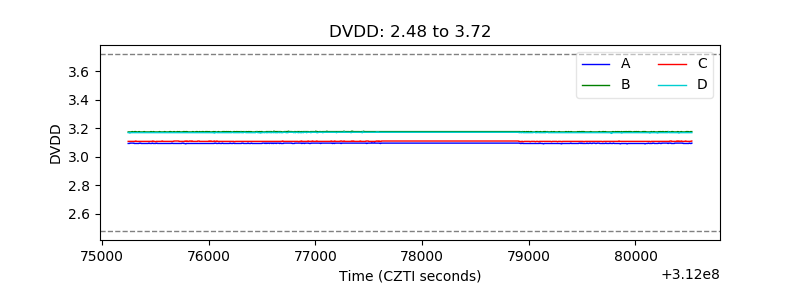 |
| Temperature 1 | 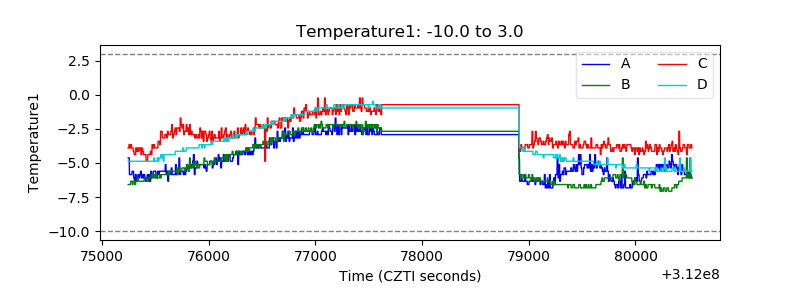 |
| Veto HV Monitor | 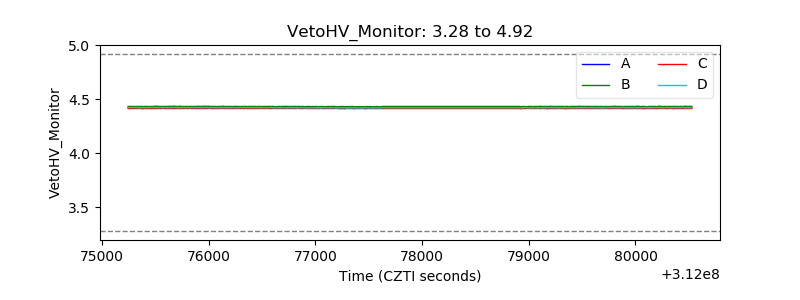 |
| Veto LLD | 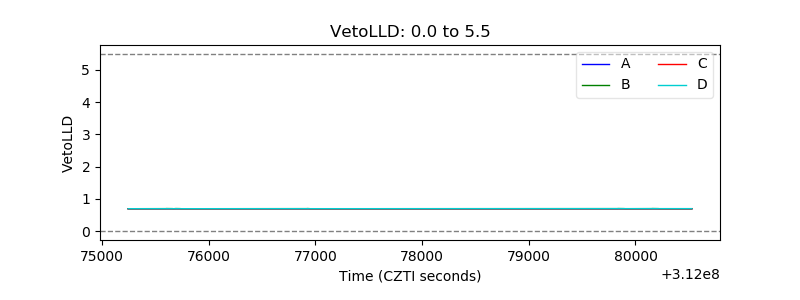 |
| Alpha Counter | 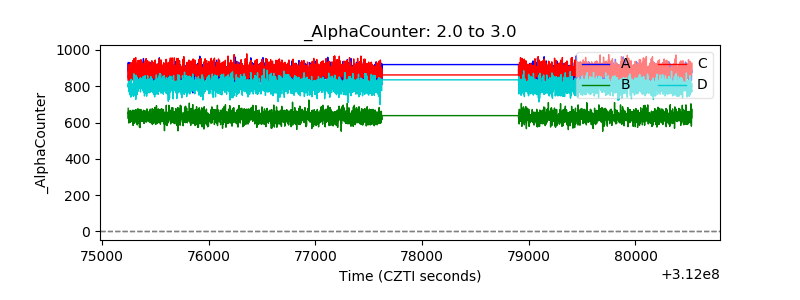 |
| _CPM_Rate | 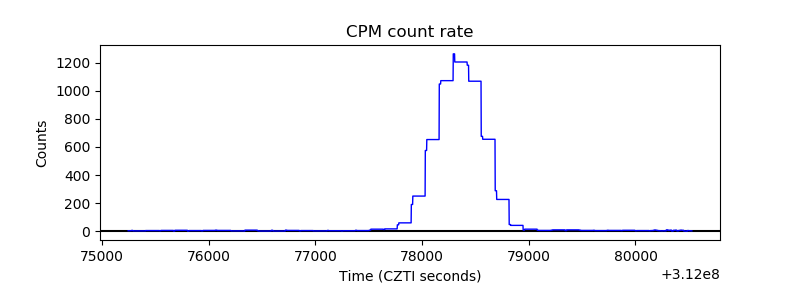 |
| CZT Counter | 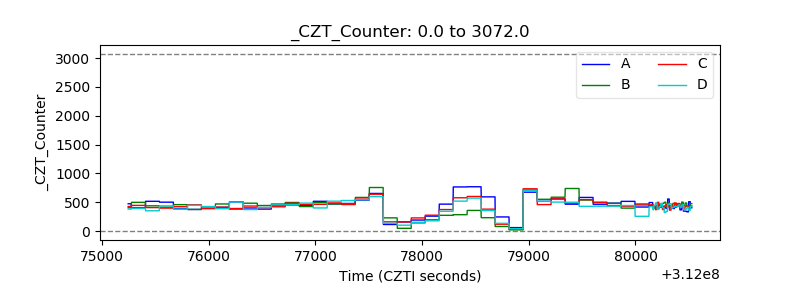 |
| +2.5 Volts monitor | 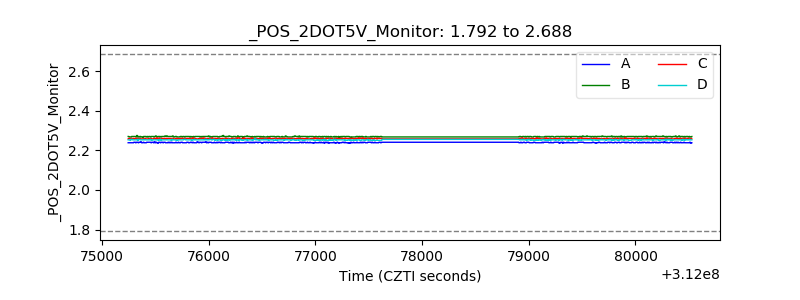 |
| +5 Volts monitor | 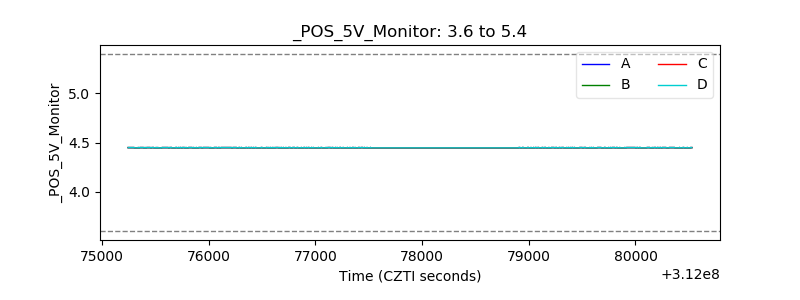 |
| _ROLL_ROT | 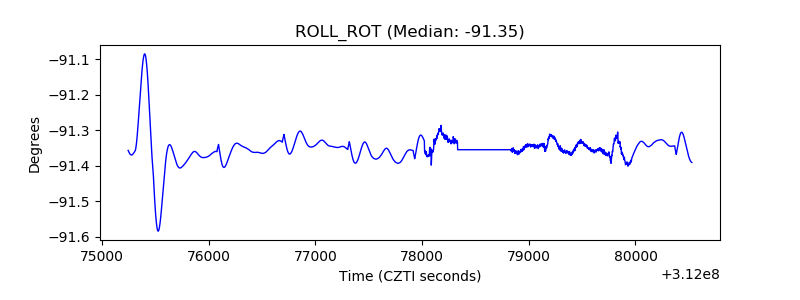 |
| _Roll_DEC | 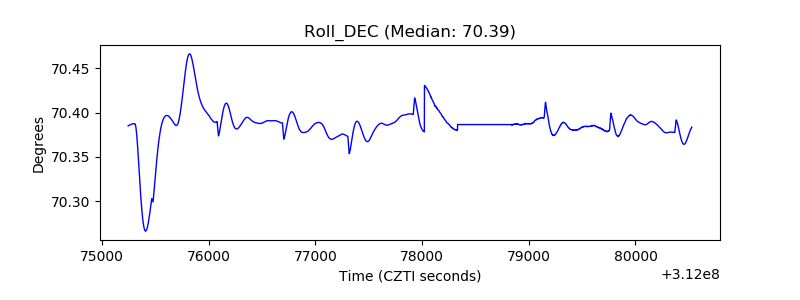 |
| _Roll_RA | 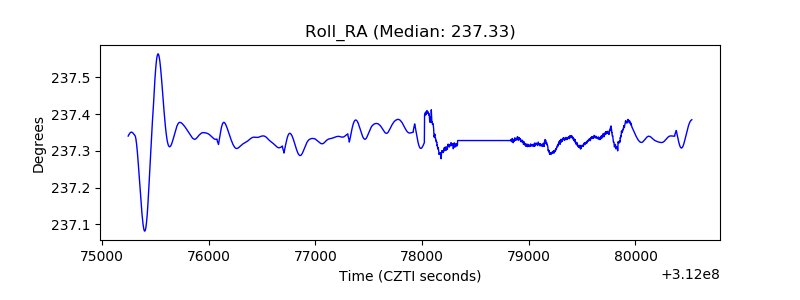 |
| Veto Counter | 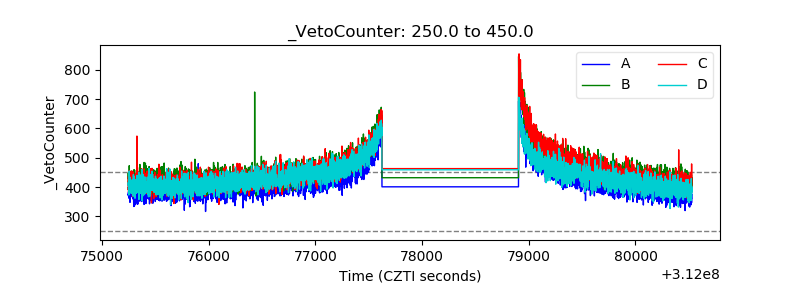 |