| Param | Original file | Final file |
|---|---|---|
| Filename | modeM0/AS1A07_056T01_9000003330_22438cztM0_level2.evt | modeM0/AS1A07_056T01_9000003330_22438cztM0_level2_quad_clean.evt |
| Size (bytes) | 441,829,440 | 133,554,240 |
| Size | 421.4 MB | 127.4 MB |
| Events in quadrant A | 3,177,651 | 900,094 |
| Events in quadrant B | 3,334,880 | 925,183 |
| Events in quadrant C | 3,205,213 | 883,751 |
| Events in quadrant D | 3,197,233 | 858,934 |
| Mode SS | |||
|---|---|---|---|
| Quadrant | BADHDUFLAG | Total packets | Discarded packets |
| A | 0 | 138 | 0 |
| B | 0 | 138 | 0 |
| C | 0 | 138 | 0 |
| D | 0 | 138 | 0 |
| Mode M9 | |||
|---|---|---|---|
| Quadrant | BADHDUFLAG | Total packets | Discarded packets |
| A | 0 | 21 | 0 |
| B | 0 | 22 | 0 |
| C | 0 | 22 | 0 |
| D | 0 | 22 | 0 |
| Mode M0 | |||
|---|---|---|---|
| Quadrant | BADHDUFLAG | Total packets | Discarded packets |
| A | 0 | 14146 | 2 |
| B | 0 | 14492 | 2 |
| C | 0 | 14127 | 2 |
| D | 0 | 14481 | 2 |
| Quadrant | Total seconds | Saturated seconds | Saturation percentage |
|---|---|---|---|
| A | 6854 | 33 | 0.481471% |
| B | 6854 | 81 | 1.181792% |
| C | 6854 | 96 | 1.400642% |
| D | 6854 | 22 | 0.320980% |
Noise dominated data is calculated using 1-second bins in cleaned event files. If a bin has >2000 counts, and if more than 50% of those come from <1% of pixels, then it is considered to be noise-dominated and hence unusable.
| Quadrant | # 1 sec bins | Bins with >0 counts | Bins with >2000 counts | High rate bins dominated by noise | Noise dominated (total time) | Noise dominated (detector-on time) | Marked lightcurve |
|---|---|---|---|---|---|---|---|
| A | 7809 | 6855 | 0 | 0 | 0.00% | 0.00% | 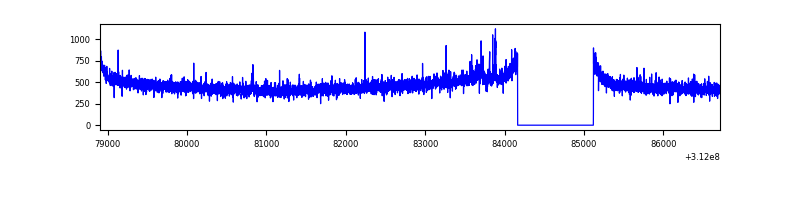 |
| B | 7809 | 6855 | 18 | 18 | 0.23% | 0.26% | 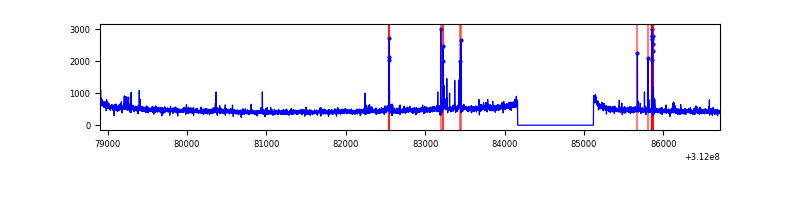 |
| C | 7809 | 6855 | 0 | 0 | 0.00% | 0.00% | 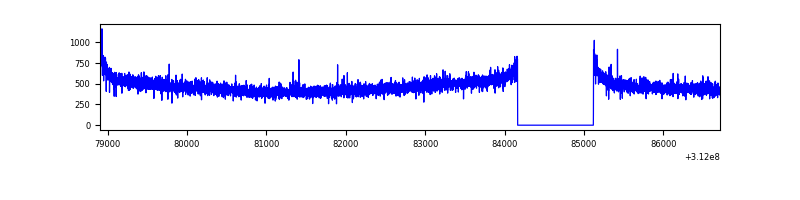 |
| D | 7809 | 6855 | 4 | 4 | 0.05% | 0.06% | 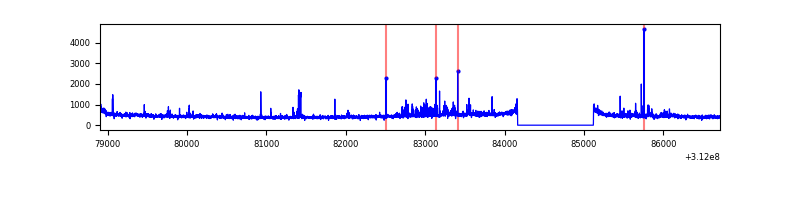 |
Top three noisy pixels from each quadrant. If the there are fewer than three noisy pixels in the level2.evt file, extra rows are filled as -1
| Pixel properties | Quadrant properties | ||||||
|---|---|---|---|---|---|---|---|
| Quadrant | DetID | PixID | Counts | Sigma | Mean | Median | Sigma |
| A | 3 | 1 | 32925 | 197.78 | 813 | 797 | 162.4 |
| A | 15 | 174 | 10597 | 60.33 | 813 | 797 | 162.4 |
| A | 13 | 254 | 8897 | 49.86 | 813 | 797 | 162.4 |
| B | 5 | 172 | 37335 | 238.92 | 817 | 797 | 152.9 |
| B | 10 | 245 | 33795 | 215.77 | 817 | 797 | 152.9 |
| B | 0 | 190 | 25705 | 162.87 | 817 | 797 | 152.9 |
| C | 14 | 238 | 125991 | 698.19 | 784 | 790 | 179.3 |
| C | 1 | 16 | 14171 | 74.62 | 784 | 790 | 179.3 |
| C | 0 | 10 | 5904 | 28.52 | 784 | 790 | 179.3 |
| D | 1 | 52 | 104100 | 539.36 | 787 | 763 | 191.6 |
| D | 2 | 136 | 49725 | 255.55 | 787 | 763 | 191.6 |
| D | 7 | 223 | 40950 | 209.75 | 787 | 763 | 191.6 |
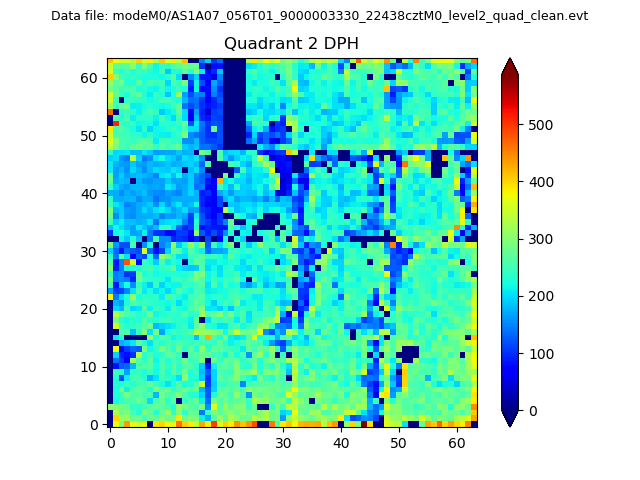
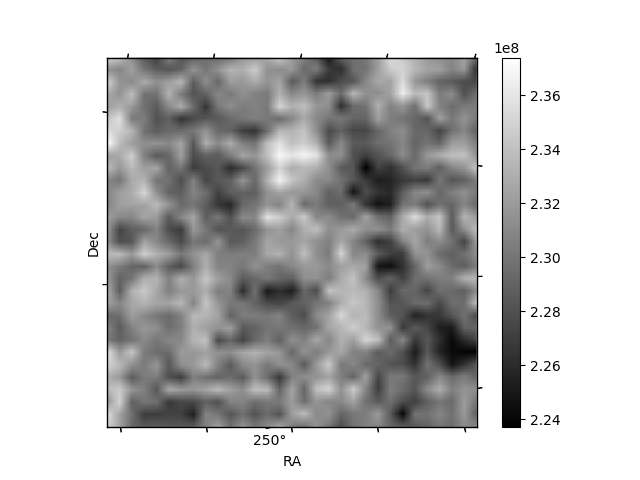
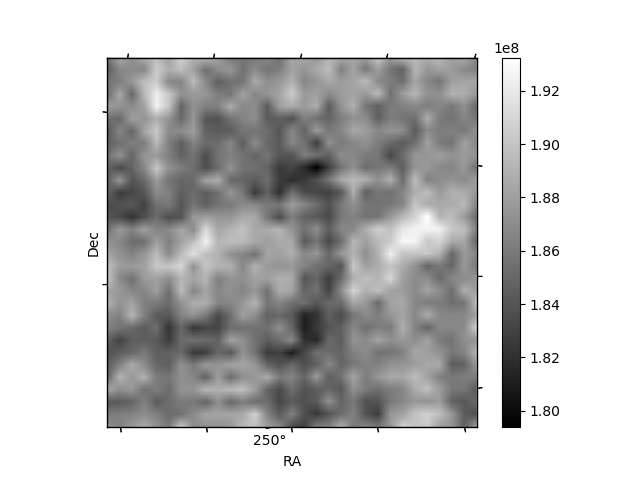
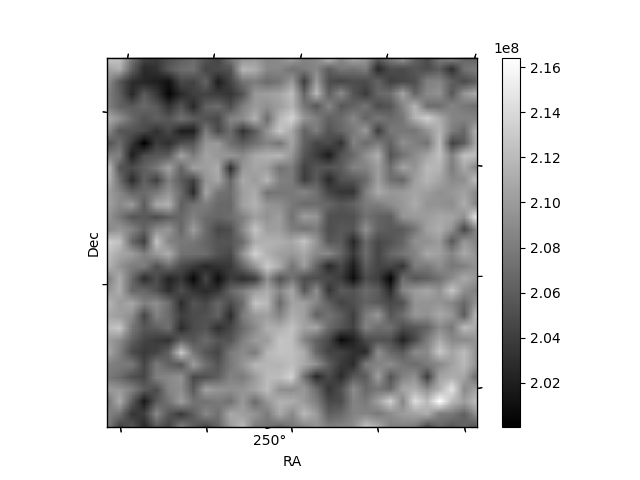
Histogram calculated using DETX and DETY for each event in the final _common_clean file
| Quadrant A | 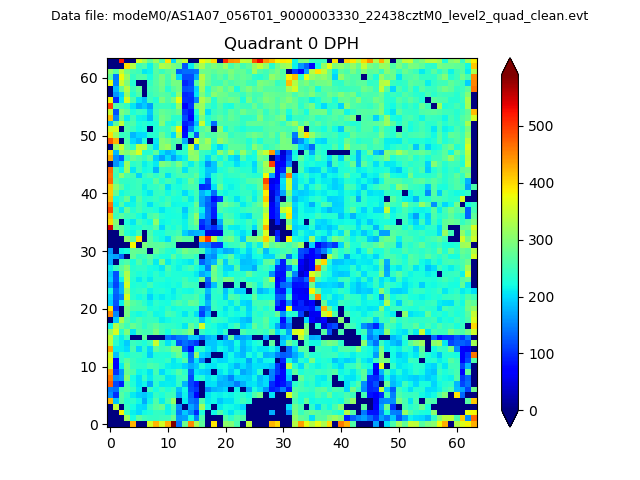 |
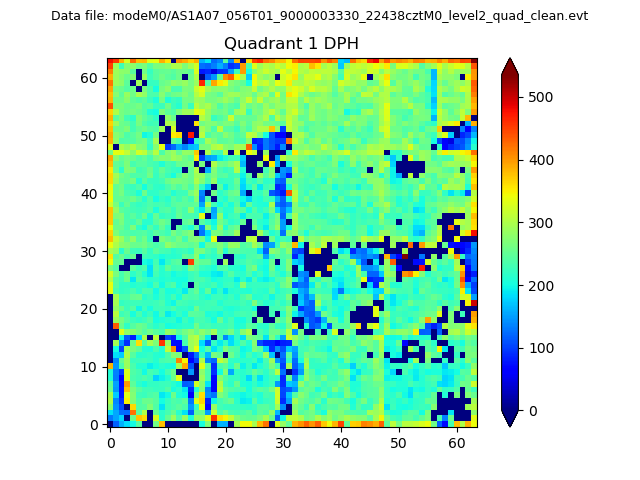 |
Quadrant B |
|---|---|---|---|
| Quadrant D | 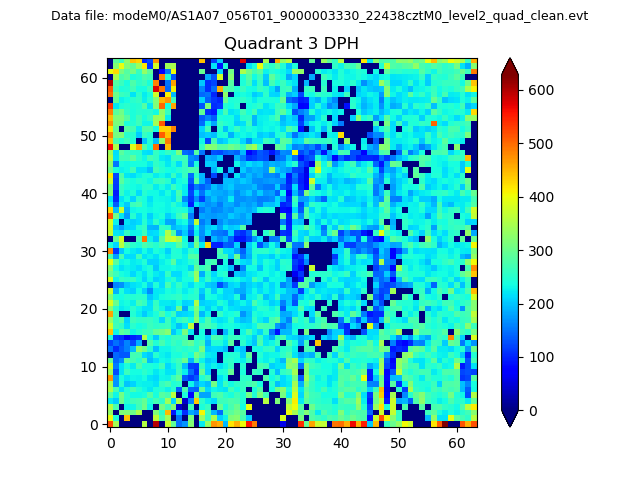 |
 |
Quadrant C |
| Plot type | Count rate plots | Images |
|---|---|---|
| Comparison with Poisson distribution Blue bars denote a histogram of data divided into 1 sec bins. Red curve is a Poisson curve with rate = median count rate of data. |
 |
 |
| Quadrant-wise count rates Data is divided into 100 sec bins |
 |
|
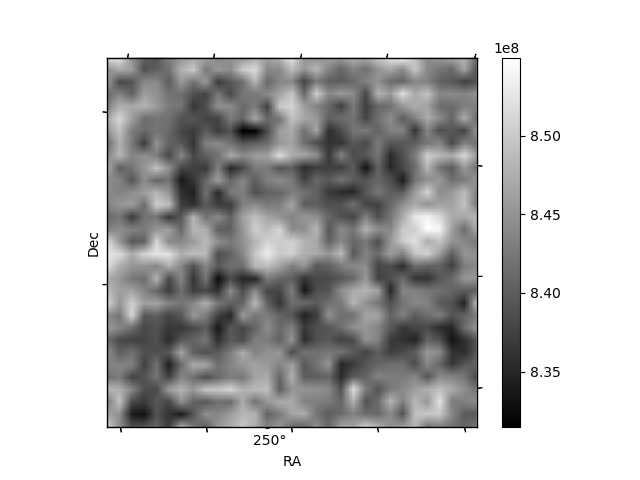
| Module-wise count rates for Quadrant A Data is divided into 100 sec bins |
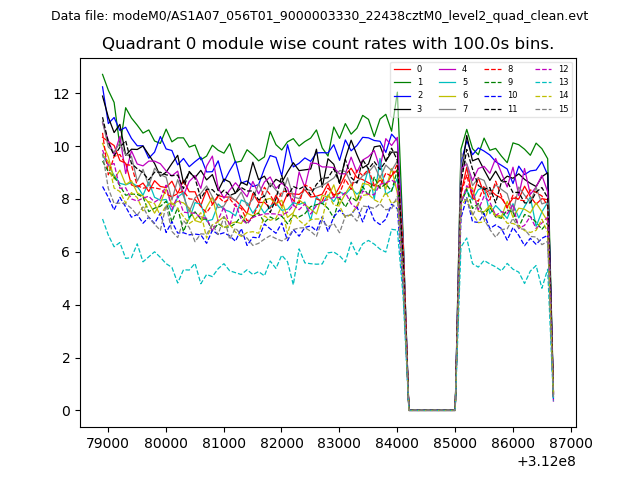 |
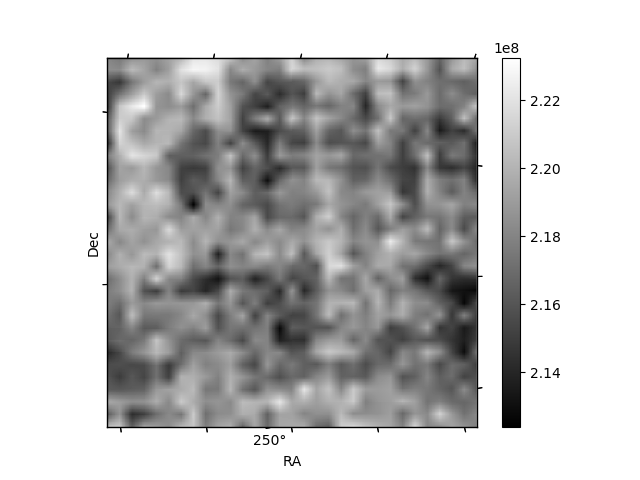 |
| Module-wise count rates for Quadrant B Data is divided into 100 sec bins |
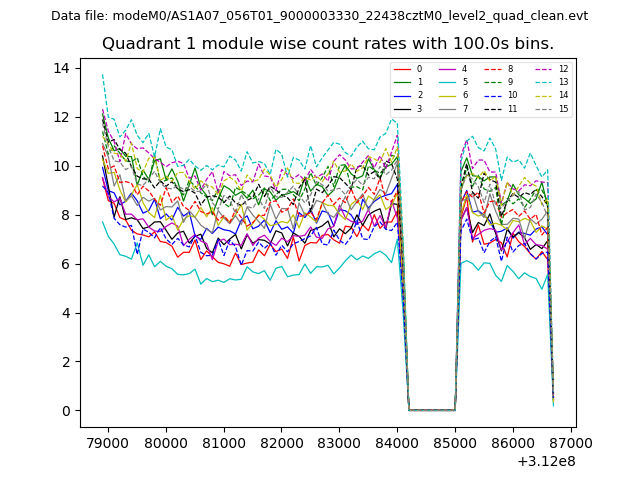 |
 |
| Module-wise count rates for Quadrant C Data is divided into 100 sec bins |
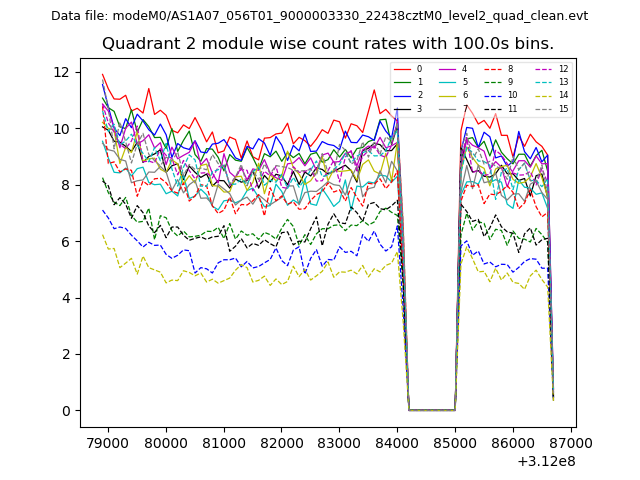 |
 |
| Module-wise count rates for Quadrant D Data is divided into 100 sec bins |
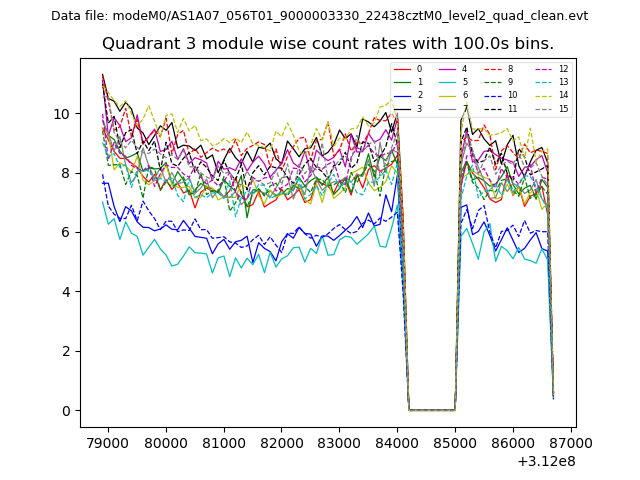 |
 |
| Parameter | Plot |
|---|---|
| CZT HV Monitor | 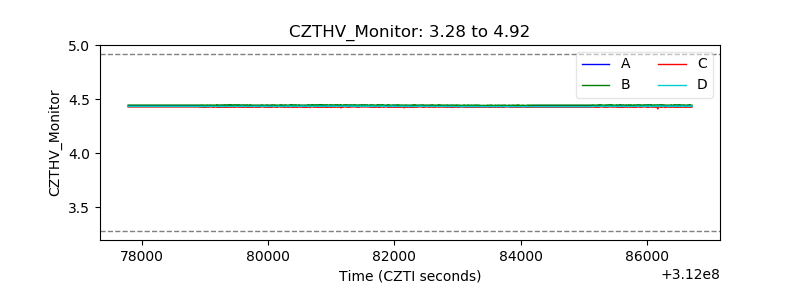 |
| D_VDD | 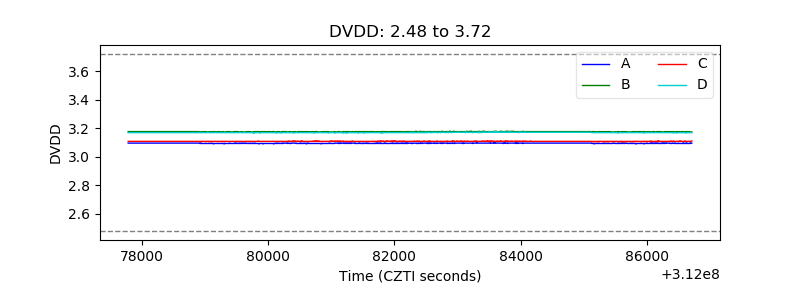 |
| Temperature 1 | 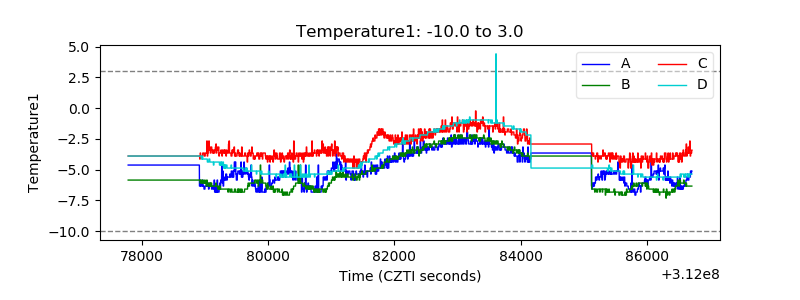 |
| Veto HV Monitor | 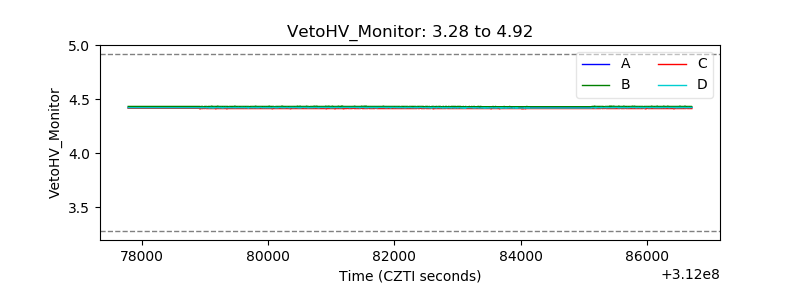 |
| Veto LLD | 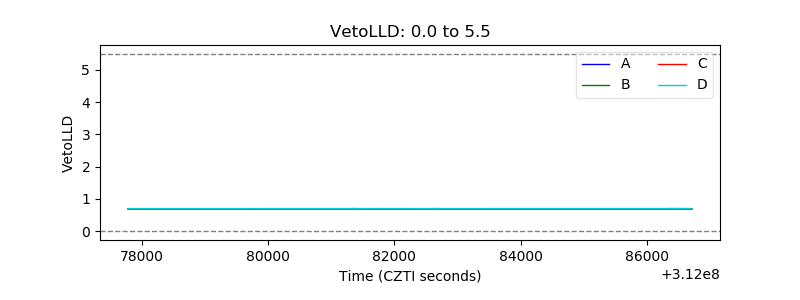 |
| Alpha Counter |  |
| _CPM_Rate |  |
| CZT Counter | 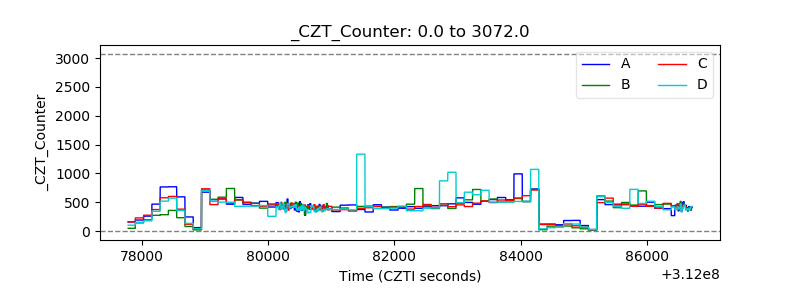 |
| +2.5 Volts monitor |  |
| +5 Volts monitor |  |
| _ROLL_ROT | 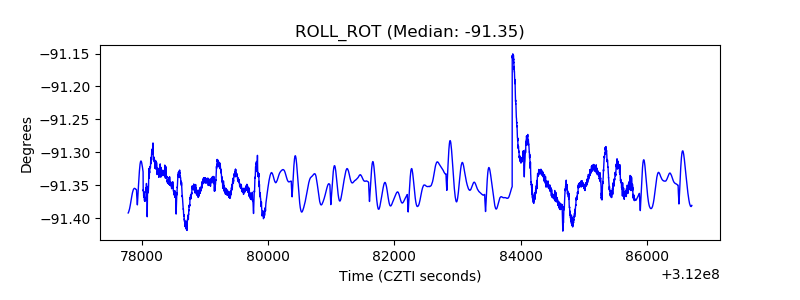 |
| _Roll_DEC | 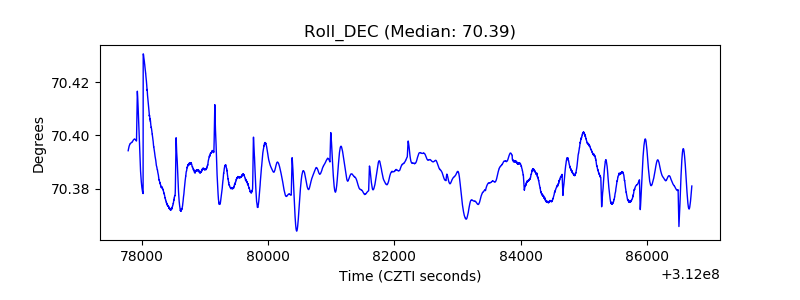 |
| _Roll_RA | 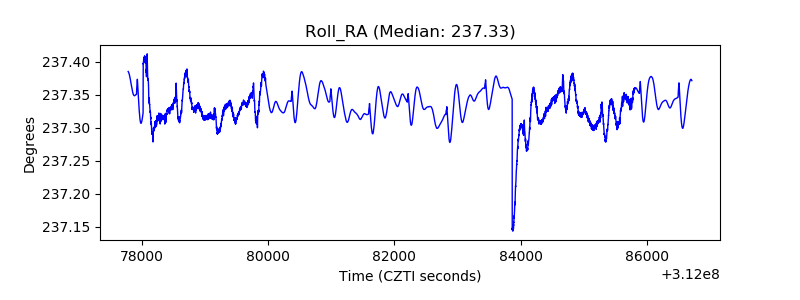 |
| Veto Counter | 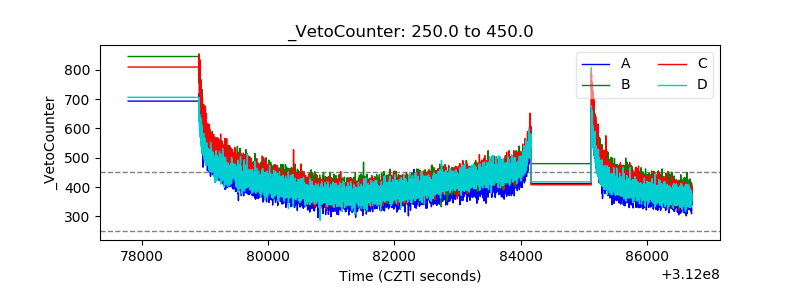 |