| Param | Original file | Final file |
|---|---|---|
| Filename | modeM0/AS1A07_056T01_9000003330_22439cztM0_level2.evt | modeM0/AS1A07_056T01_9000003330_22439cztM0_level2_quad_clean.evt |
| Size (bytes) | 411,874,560 | 122,512,320 |
| Size | 392.8 MB | 116.8 MB |
| Events in quadrant A | 2,955,801 | 821,727 |
| Events in quadrant B | 3,066,147 | 843,219 |
| Events in quadrant C | 3,004,739 | 804,945 |
| Events in quadrant D | 3,002,343 | 785,269 |
| Mode SS | |||
|---|---|---|---|
| Quadrant | BADHDUFLAG | Total packets | Discarded packets |
| A | 0 | 132 | 0 |
| B | 0 | 132 | 0 |
| C | 0 | 132 | 0 |
| D | 0 | 132 | 0 |
| Mode M9 | |||
|---|---|---|---|
| Quadrant | BADHDUFLAG | Total packets | Discarded packets |
| A | 0 | 5 | 0 |
| B | 0 | 5 | 0 |
| C | 0 | 5 | 0 |
| D | 0 | 5 | 0 |
| Mode M0 | |||
|---|---|---|---|
| Quadrant | BADHDUFLAG | Total packets | Discarded packets |
| A | 0 | 13309 | 1 |
| B | 0 | 13544 | 1 |
| C | 0 | 13461 | 1 |
| D | 0 | 13818 | 1 |
| Quadrant | Total seconds | Saturated seconds | Saturation percentage |
|---|---|---|---|
| A | 6535 | 19 | 0.290742% |
| B | 6536 | 60 | 0.917993% |
| C | 6536 | 71 | 1.086291% |
| D | 6536 | 8 | 0.122399% |
Noise dominated data is calculated using 1-second bins in cleaned event files. If a bin has >2000 counts, and if more than 50% of those come from <1% of pixels, then it is considered to be noise-dominated and hence unusable.
| Quadrant | # 1 sec bins | Bins with >0 counts | Bins with >2000 counts | High rate bins dominated by noise | Noise dominated (total time) | Noise dominated (detector-on time) | Marked lightcurve |
|---|---|---|---|---|---|---|---|
| A | 7070 | 6536 | 0 | 0 | 0.00% | 0.00% | 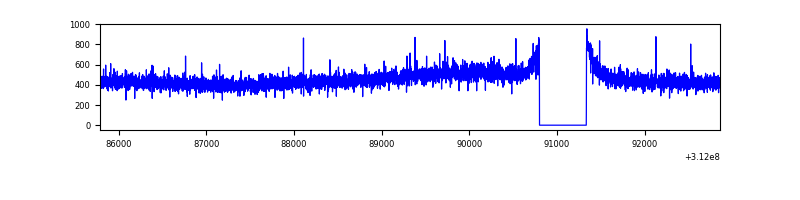 |
| B | 7071 | 6537 | 11 | 11 | 0.16% | 0.17% | 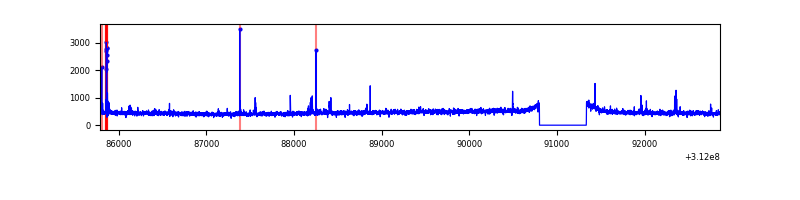 |
| C | 7071 | 6537 | 0 | 0 | 0.00% | 0.00% | 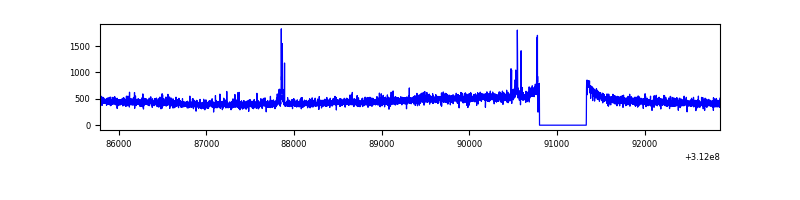 |
| D | 7071 | 6537 | 1 | 1 | 0.01% | 0.02% | 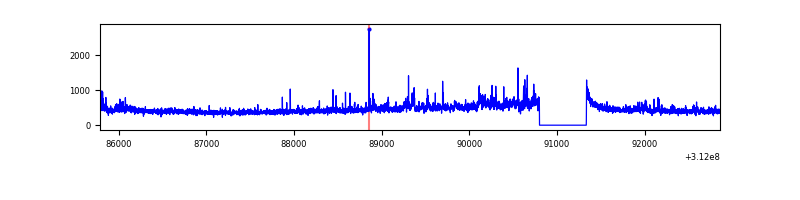 |
Top three noisy pixels from each quadrant. If the there are fewer than three noisy pixels in the level2.evt file, extra rows are filled as -1
| Pixel properties | Quadrant properties | ||||||
|---|---|---|---|---|---|---|---|
| Quadrant | DetID | PixID | Counts | Sigma | Mean | Median | Sigma |
| A | 15 | 174 | 17342 | 109.17 | 760 | 743 | 152.0 |
| A | 3 | 1 | 11058 | 67.84 | 760 | 743 | 152.0 |
| A | 13 | 254 | 9181 | 55.5 | 760 | 743 | 152.0 |
| B | 5 | 172 | 60241 | 411.17 | 760 | 740 | 144.7 |
| B | 12 | 111 | 17823 | 118.05 | 760 | 740 | 144.7 |
| B | 4 | 173 | 16749 | 110.63 | 760 | 740 | 144.7 |
| C | 14 | 238 | 118051 | 696.44 | 728 | 730 | 168.5 |
| C | 10 | 22 | 46949 | 274.36 | 728 | 730 | 168.5 |
| C | 13 | 61 | 5182 | 26.43 | 728 | 730 | 168.5 |
| D | 1 | 52 | 152439 | 857.9 | 734 | 710 | 176.9 |
| D | 2 | 136 | 32648 | 180.58 | 734 | 710 | 176.9 |
| D | 2 | 234 | 25630 | 140.9 | 734 | 710 | 176.9 |
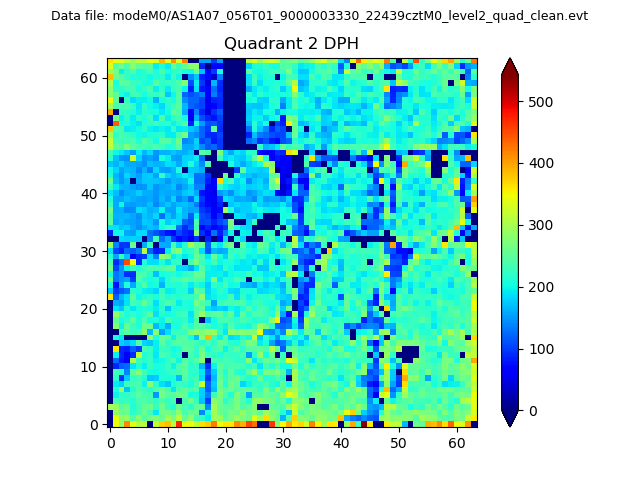
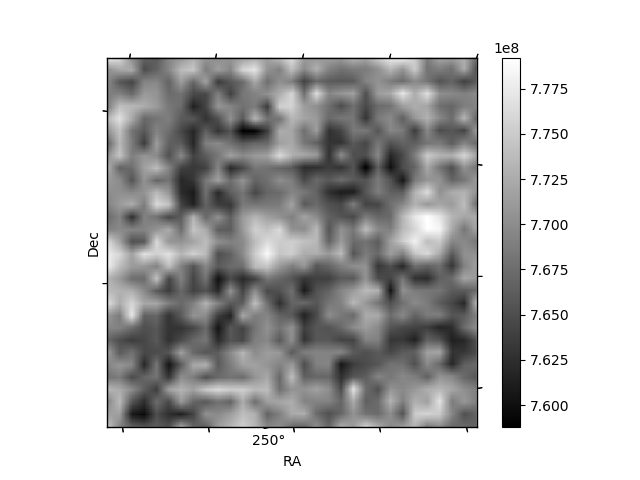
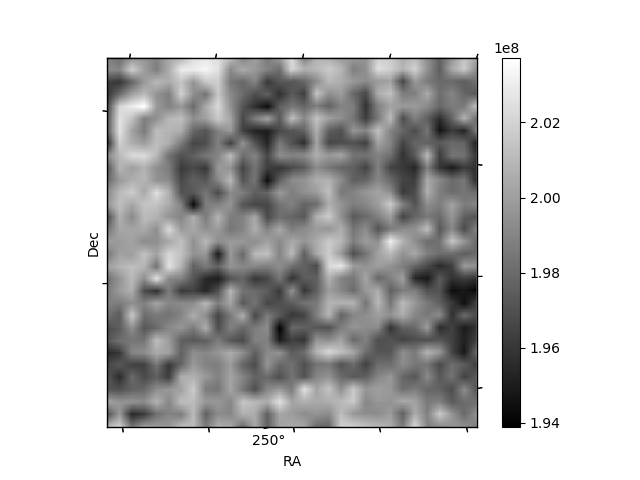
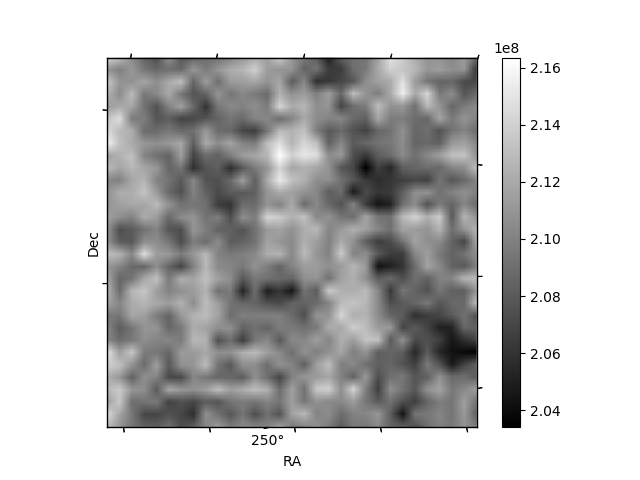
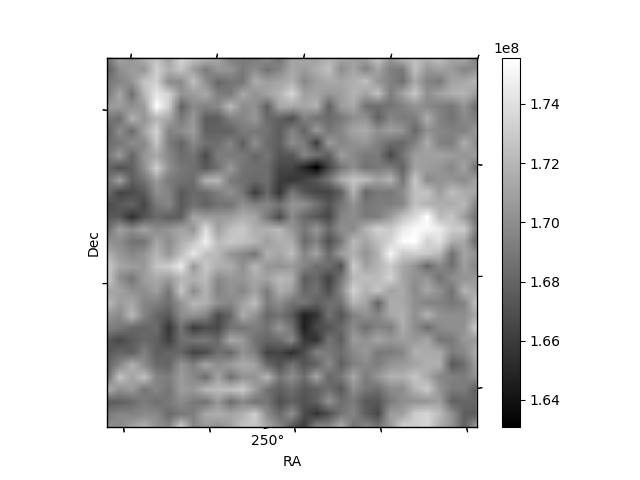
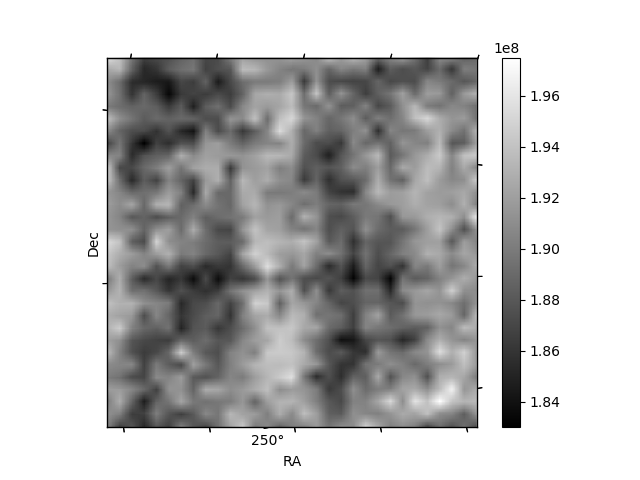
Histogram calculated using DETX and DETY for each event in the final _common_clean file
| Quadrant A | 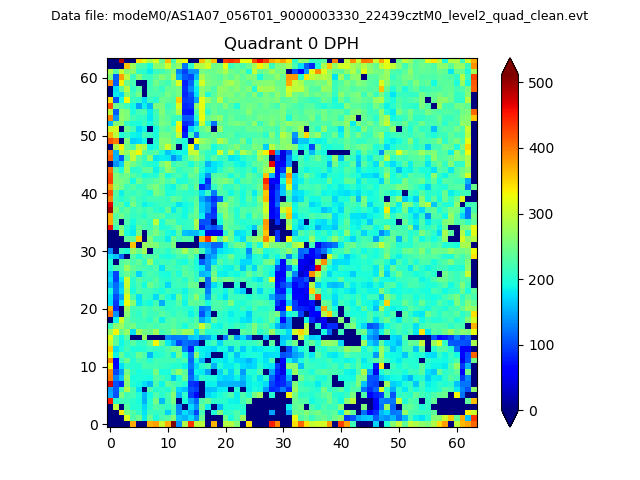 |
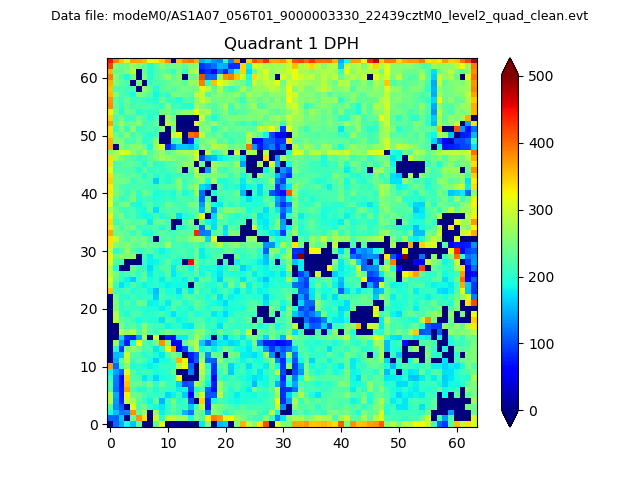 |
Quadrant B |
|---|---|---|---|
| Quadrant D | 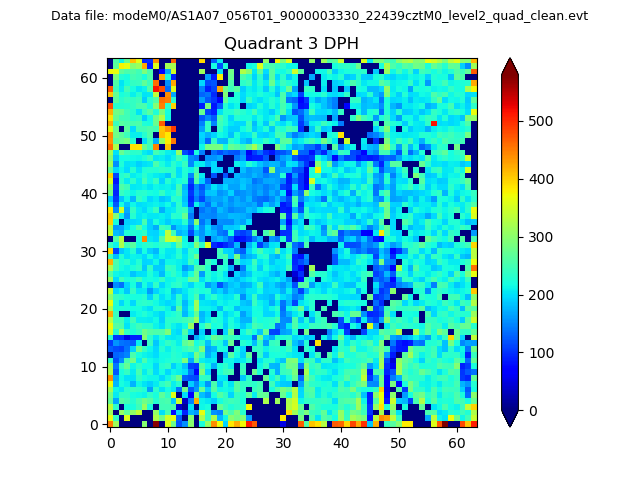 |
 |
Quadrant C |
| Plot type | Count rate plots | Images |
|---|---|---|
| Comparison with Poisson distribution Blue bars denote a histogram of data divided into 1 sec bins. Red curve is a Poisson curve with rate = median count rate of data. |
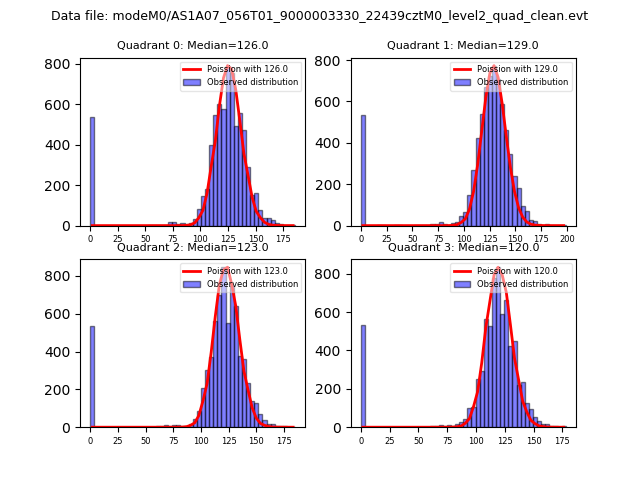 |
 |
| Quadrant-wise count rates Data is divided into 100 sec bins |
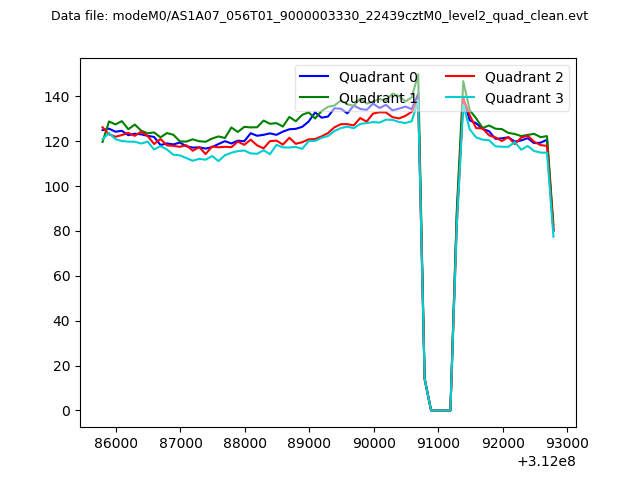 |
|
| Module-wise count rates for Quadrant A Data is divided into 100 sec bins |
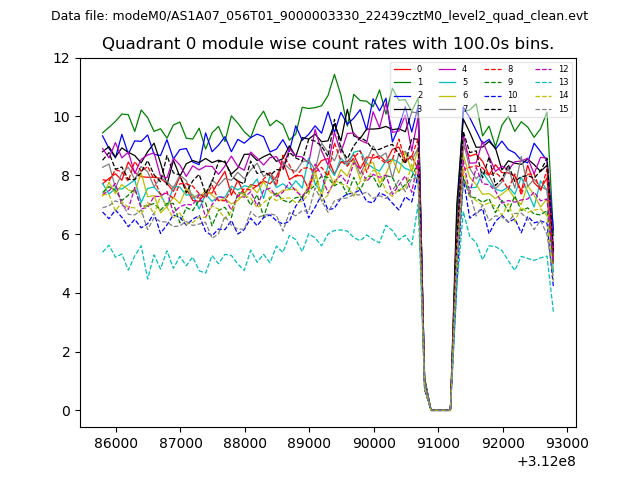 |
 |
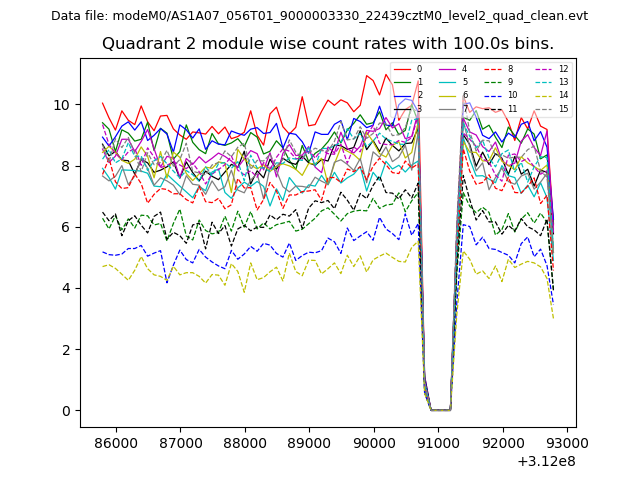
| Module-wise count rates for Quadrant B Data is divided into 100 sec bins |
 |
 |
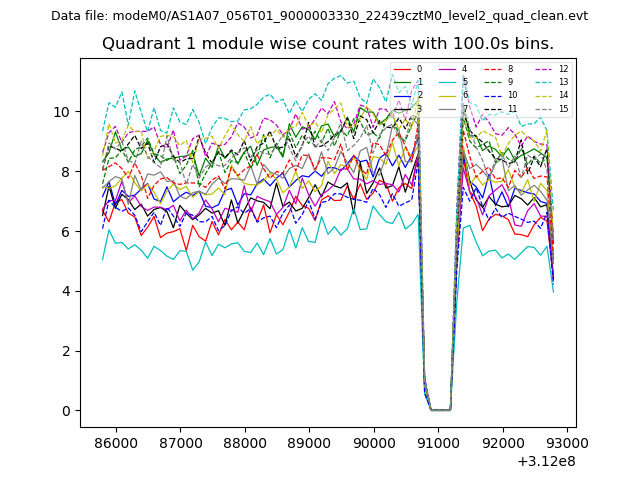
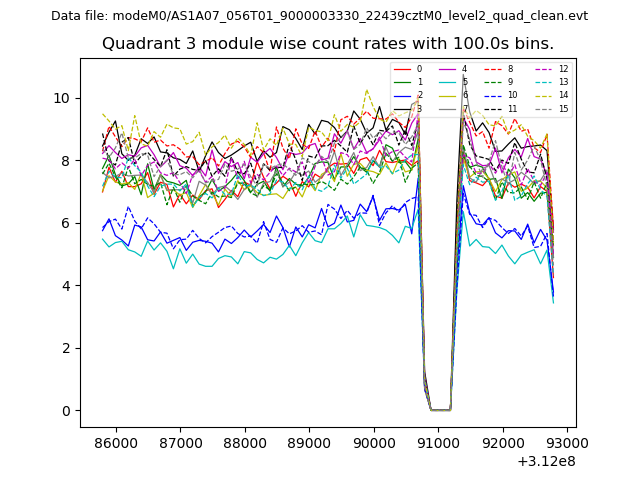
| Module-wise count rates for Quadrant C Data is divided into 100 sec bins |
 |
 |
| Module-wise count rates for Quadrant D Data is divided into 100 sec bins |
 |
 |
| Parameter | Plot |
|---|---|
| CZT HV Monitor | 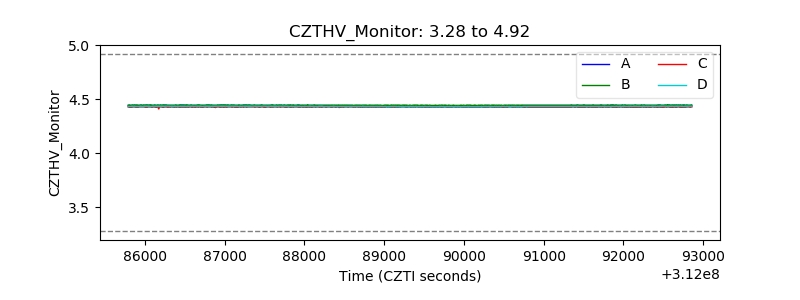 |
| D_VDD | 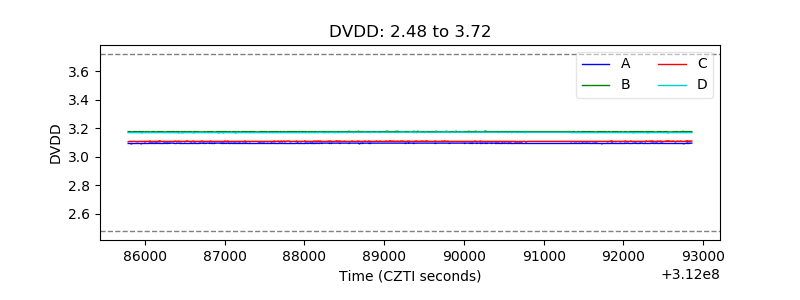 |
| Temperature 1 | 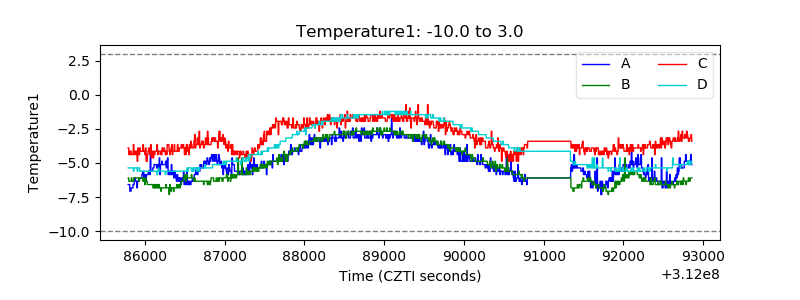 |
| Veto HV Monitor | 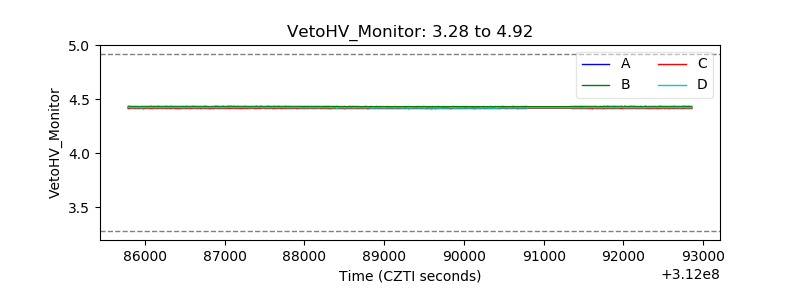 |
| Veto LLD | 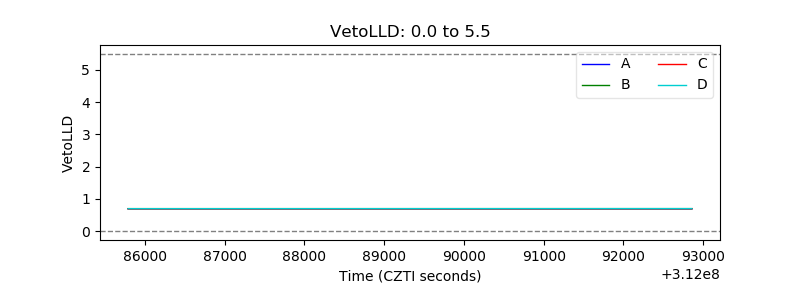 |
| Alpha Counter | 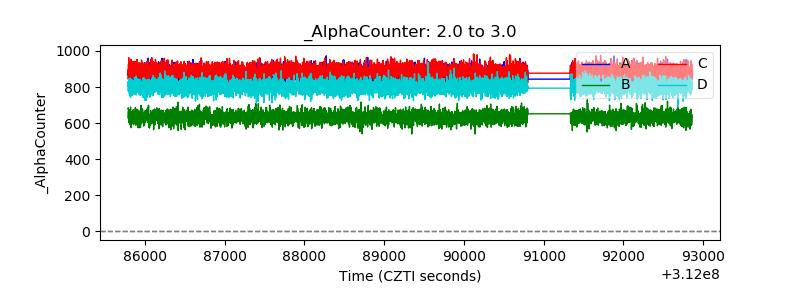 |
| _CPM_Rate | 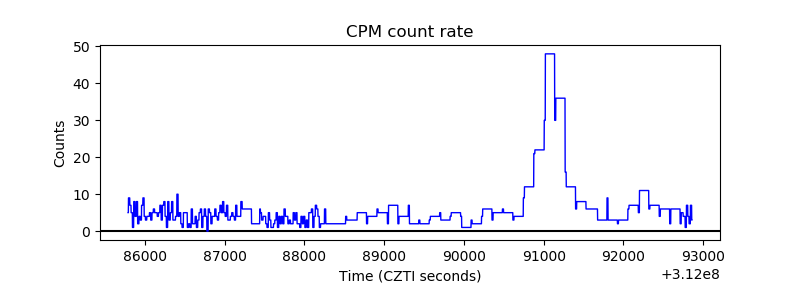 |
| CZT Counter | 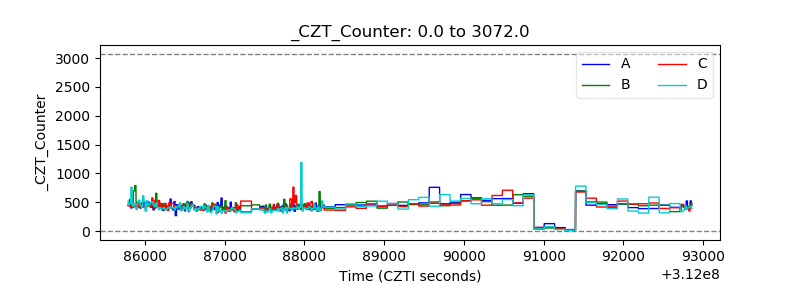 |
| +2.5 Volts monitor |  |
| +5 Volts monitor |  |
| _ROLL_ROT | 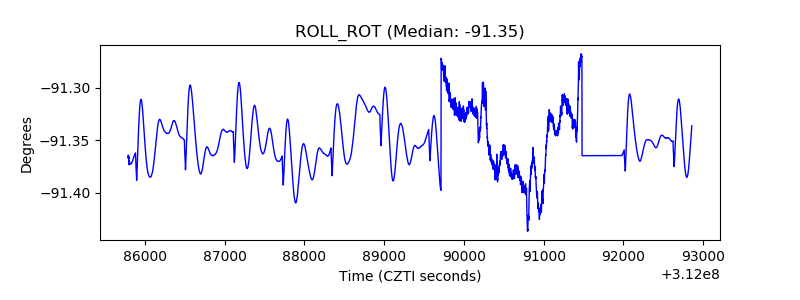 |
| _Roll_DEC | 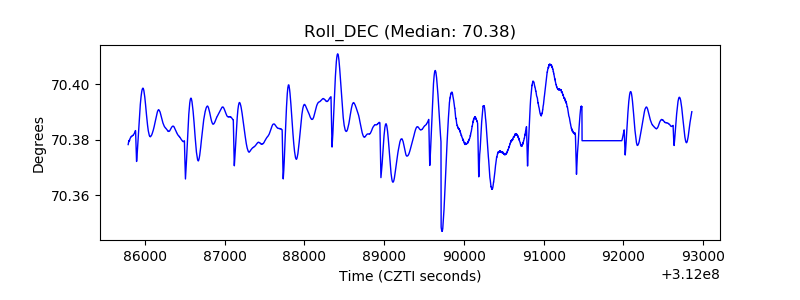 |
| _Roll_RA | 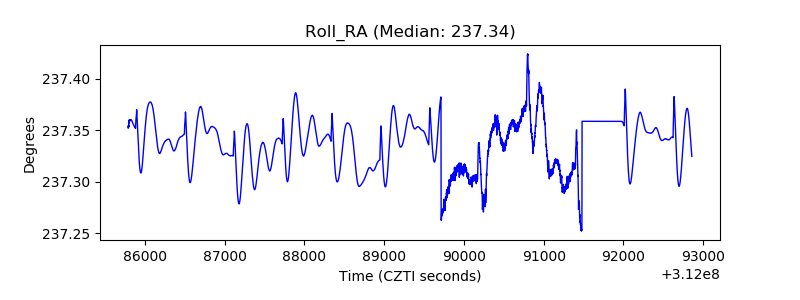 |
| Veto Counter | 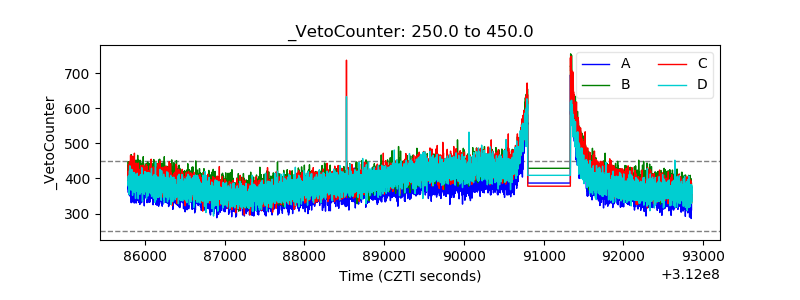 |