| Param | Original file | Final file |
|---|---|---|
| Filename | modeM0/AS1A07_056T01_9000003330_22440cztM0_level2.evt | modeM0/AS1A07_056T01_9000003330_22440cztM0_level2_quad_clean.evt |
| Size (bytes) | 459,907,200 | 130,677,120 |
| Size | 438.6 MB | 124.6 MB |
| Events in quadrant A | 3,241,767 | 875,384 |
| Events in quadrant B | 3,475,110 | 896,990 |
| Events in quadrant C | 3,258,940 | 855,587 |
| Events in quadrant D | 3,471,680 | 837,492 |
| Mode SS | |||
|---|---|---|---|
| Quadrant | BADHDUFLAG | Total packets | Discarded packets |
| A | 0 | 144 | 0 |
| B | 0 | 144 | 0 |
| C | 0 | 144 | 0 |
| D | 0 | 144 | 0 |
| Mode M9 | |||
|---|---|---|---|
| Quadrant | BADHDUFLAG | Total packets | Discarded packets |
| A | 0 | 2 | 0 |
| B | 0 | 2 | 0 |
| C | 0 | 2 | 0 |
| D | 0 | 2 | 0 |
| Mode M0 | |||
|---|---|---|---|
| Quadrant | BADHDUFLAG | Total packets | Discarded packets |
| A | 0 | 14543 | 1 |
| B | 0 | 15188 | 1 |
| C | 0 | 14565 | 1 |
| D | 0 | 15435 | 1 |
| Quadrant | Total seconds | Saturated seconds | Saturation percentage |
|---|---|---|---|
| A | 7067 | 131 | 1.853686% |
| B | 7068 | 189 | 2.674024% |
| C | 7068 | 131 | 1.853424% |
| D | 7068 | 90 | 1.273345% |
Noise dominated data is calculated using 1-second bins in cleaned event files. If a bin has >2000 counts, and if more than 50% of those come from <1% of pixels, then it is considered to be noise-dominated and hence unusable.
| Quadrant | # 1 sec bins | Bins with >0 counts | Bins with >2000 counts | High rate bins dominated by noise | Noise dominated (total time) | Noise dominated (detector-on time) | Marked lightcurve |
|---|---|---|---|---|---|---|---|
| A | 7207 | 7068 | 0 | 0 | 0.00% | 0.00% | 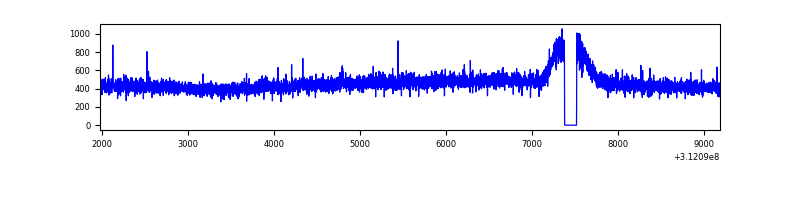 |
| B | 7208 | 7069 | 9 | 9 | 0.12% | 0.13% | 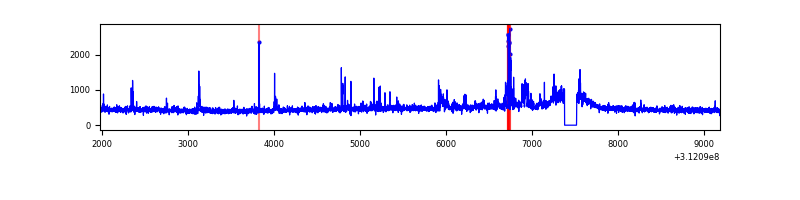 |
| C | 7208 | 7069 | 0 | 0 | 0.00% | 0.00% | 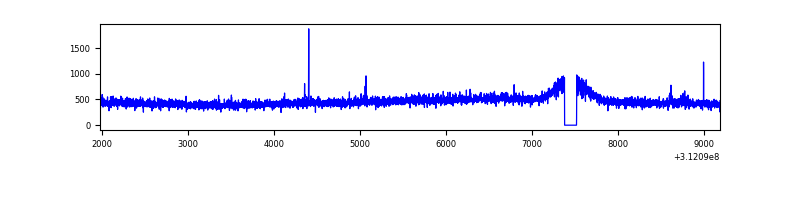 |
| D | 7208 | 7069 | 13 | 13 | 0.18% | 0.18% | 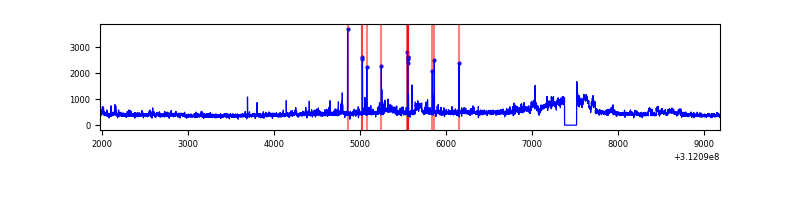 |
Top three noisy pixels from each quadrant. If the there are fewer than three noisy pixels in the level2.evt file, extra rows are filled as -1
| Pixel properties | Quadrant properties | ||||||
|---|---|---|---|---|---|---|---|
| Quadrant | DetID | PixID | Counts | Sigma | Mean | Median | Sigma |
| A | 3 | 1 | 13989 | 78.23 | 834 | 814 | 168.4 |
| A | 15 | 174 | 13380 | 74.61 | 834 | 814 | 168.4 |
| A | 13 | 254 | 9459 | 51.33 | 834 | 814 | 168.4 |
| B | 10 | 245 | 144108 | 899.32 | 831 | 808 | 159.3 |
| B | 3 | 64 | 32661 | 199.9 | 831 | 808 | 159.3 |
| B | 5 | 172 | 25327 | 153.88 | 831 | 808 | 159.3 |
| C | 14 | 238 | 126176 | 679.89 | 795 | 797 | 184.4 |
| C | 10 | 22 | 17321 | 89.6 | 795 | 797 | 184.4 |
| C | 9 | 54 | 6764 | 32.36 | 795 | 797 | 184.4 |
| D | 7 | 223 | 205457 | 1036.69 | 808 | 780 | 197.4 |
| D | 1 | 52 | 180674 | 911.16 | 808 | 780 | 197.4 |
| D | 13 | 172 | 29273 | 144.31 | 808 | 780 | 197.4 |
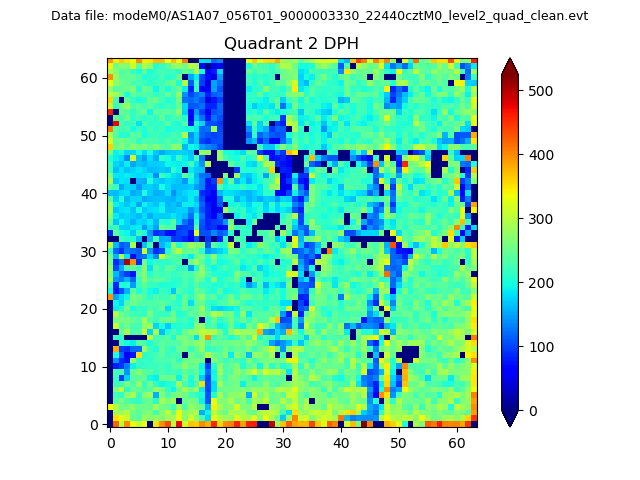
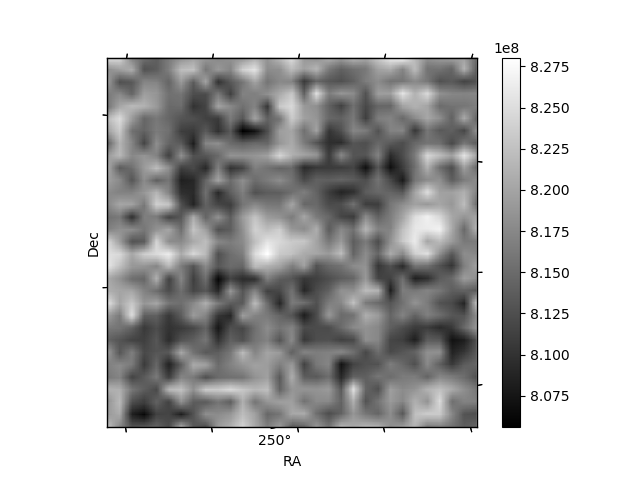
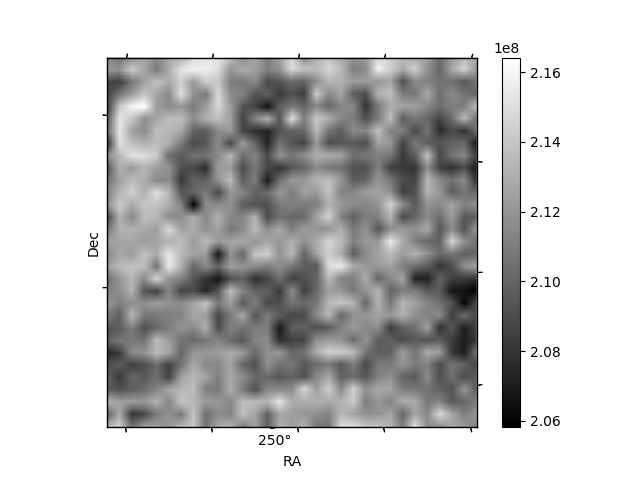
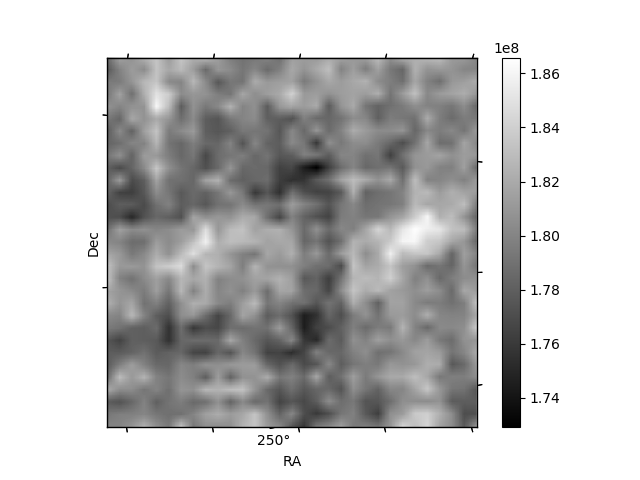
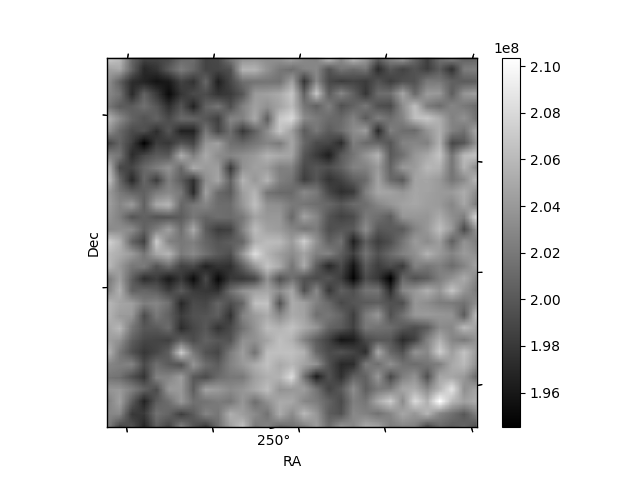
Histogram calculated using DETX and DETY for each event in the final _common_clean file
| Quadrant A | 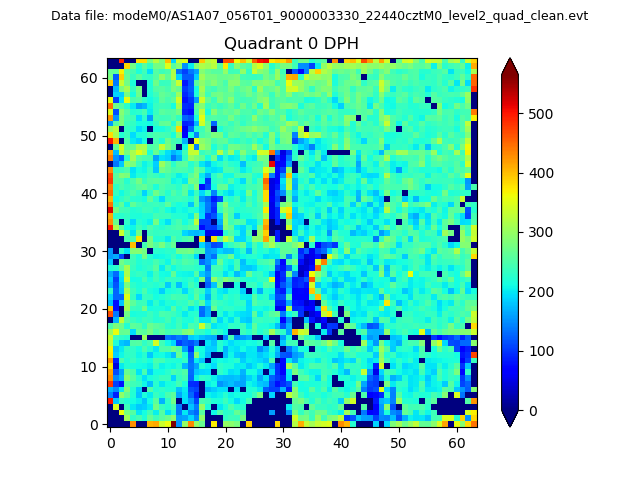 |
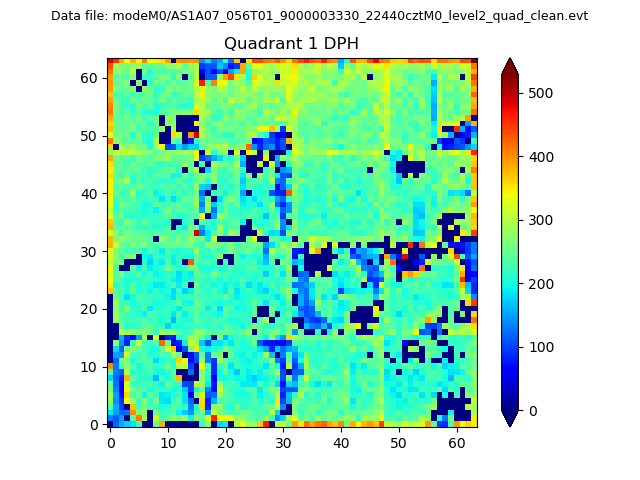 |
Quadrant B |
|---|---|---|---|
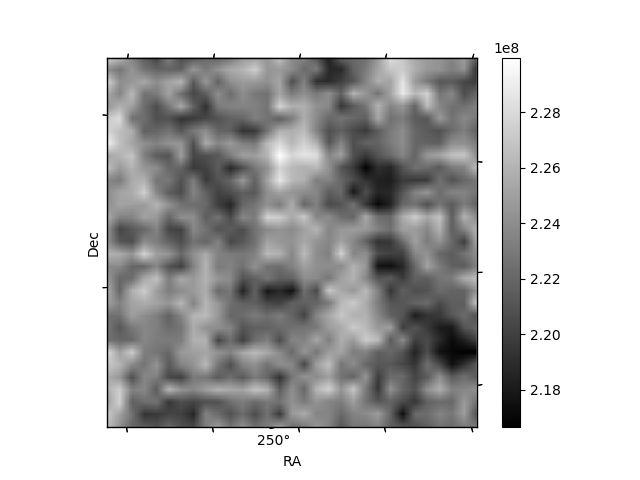
| Quadrant D | 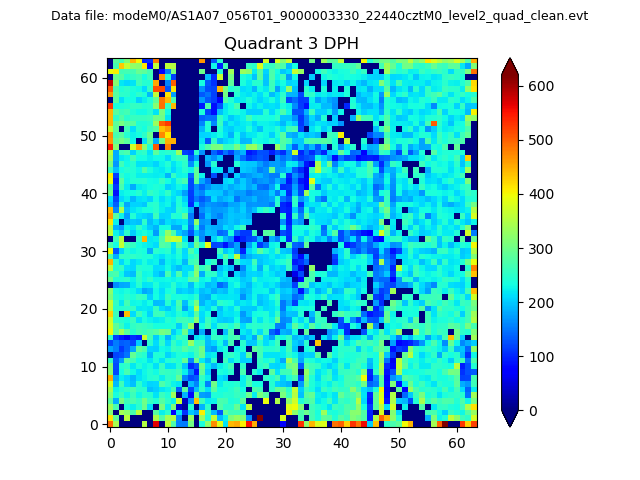 |
 |
Quadrant C |
| Plot type | Count rate plots | Images |
|---|---|---|
| Comparison with Poisson distribution Blue bars denote a histogram of data divided into 1 sec bins. Red curve is a Poisson curve with rate = median count rate of data. |
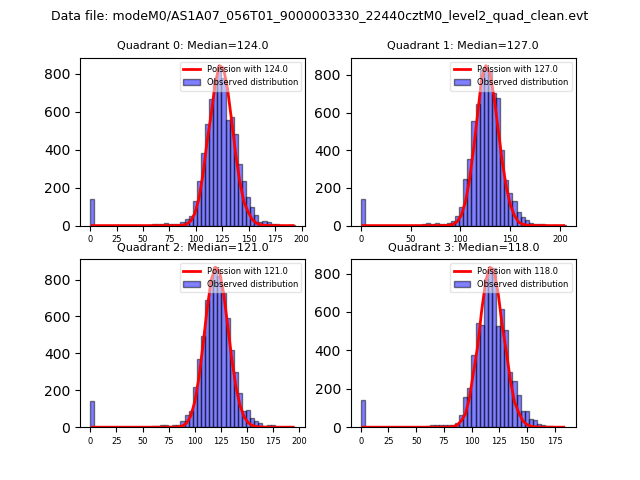 |
 |
| Quadrant-wise count rates Data is divided into 100 sec bins |
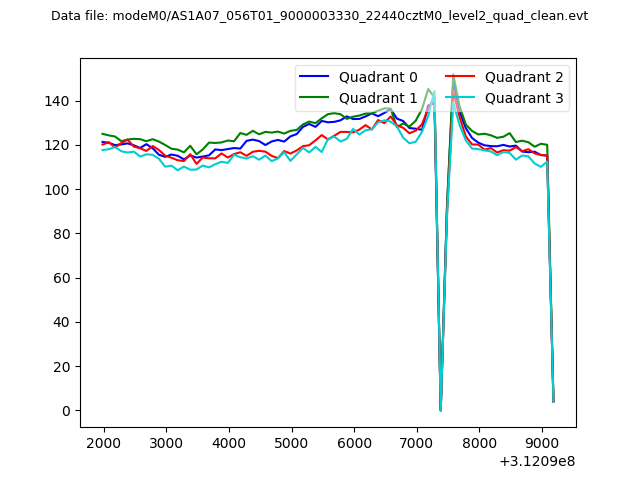 |
|
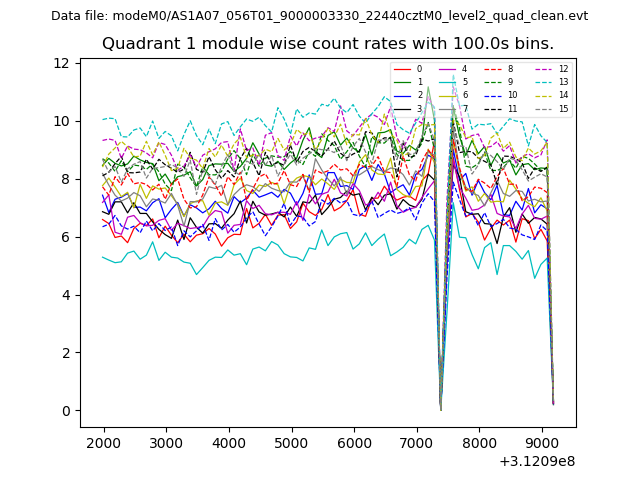
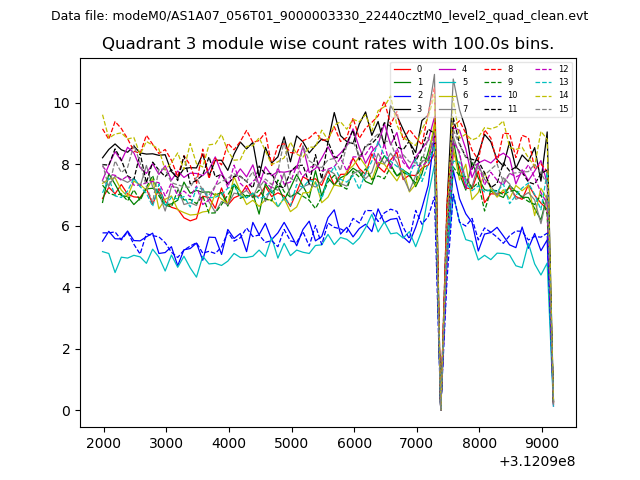
| Module-wise count rates for Quadrant A Data is divided into 100 sec bins |
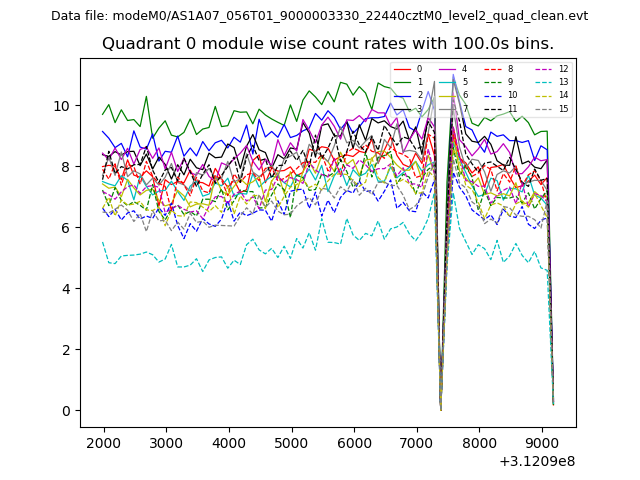 |
 |
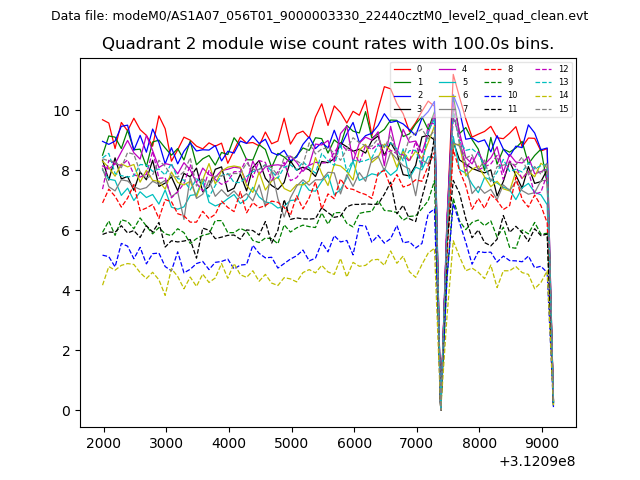
| Module-wise count rates for Quadrant B Data is divided into 100 sec bins |
 |
 |
| Module-wise count rates for Quadrant C Data is divided into 100 sec bins |
 |
 |
| Module-wise count rates for Quadrant D Data is divided into 100 sec bins |
 |
 |
| Parameter | Plot |
|---|---|
| CZT HV Monitor | 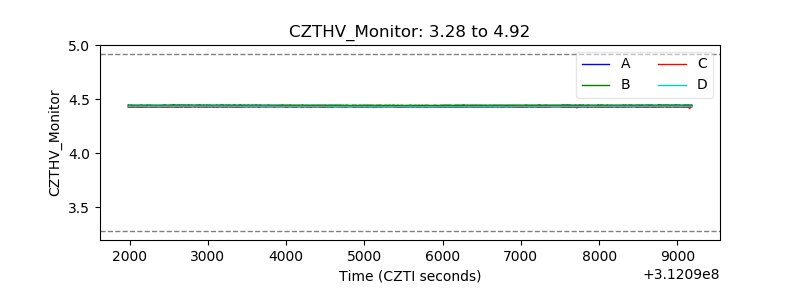 |
| D_VDD | 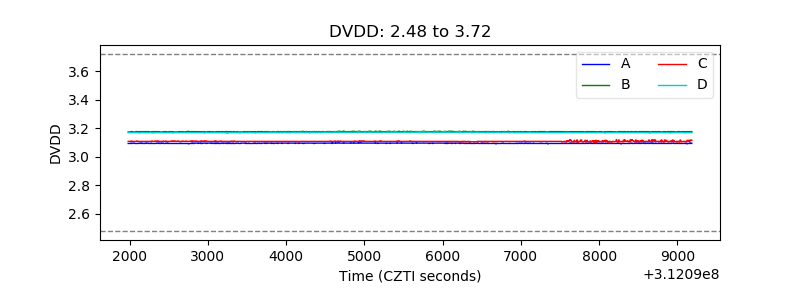 |
| Temperature 1 | 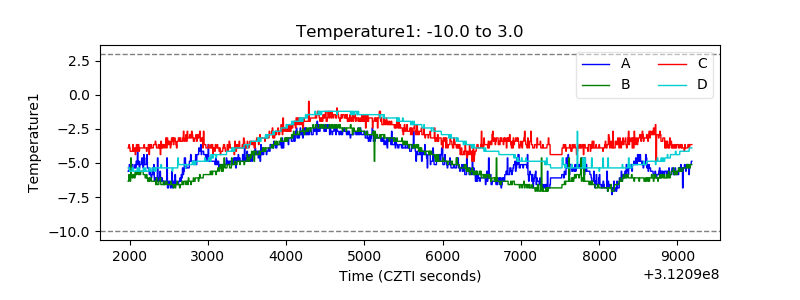 |
| Veto HV Monitor | 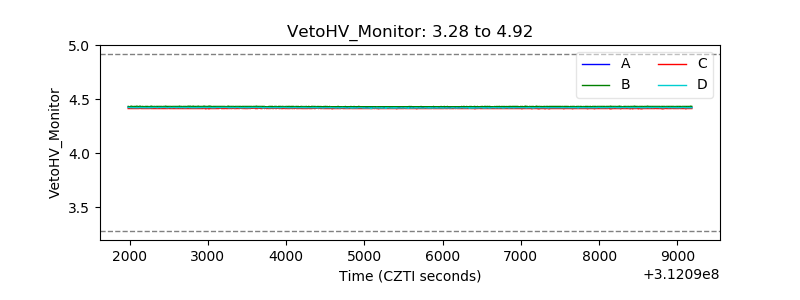 |
| Veto LLD | 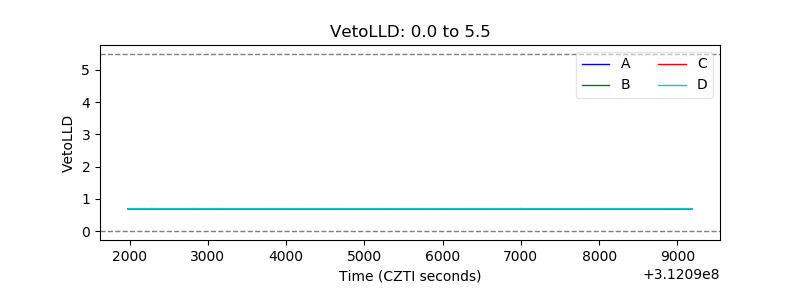 |
| Alpha Counter | 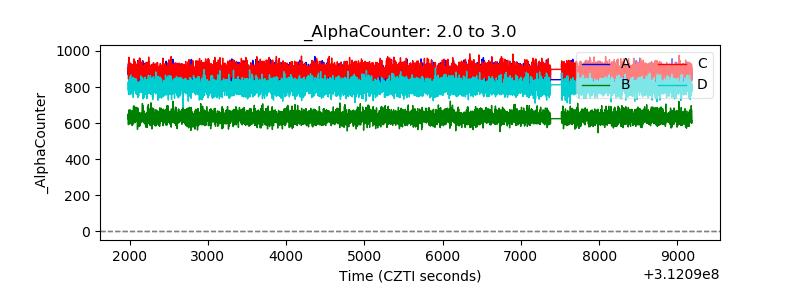 |
| _CPM_Rate | 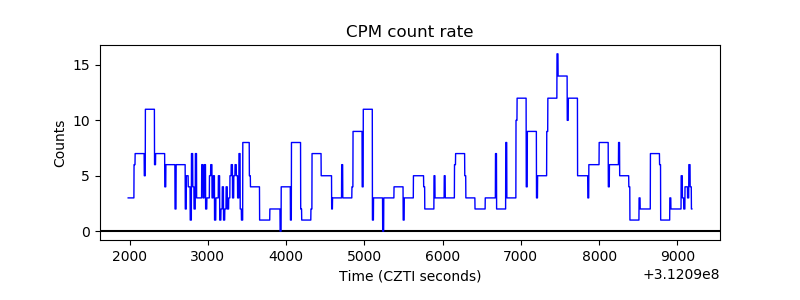 |
| CZT Counter | 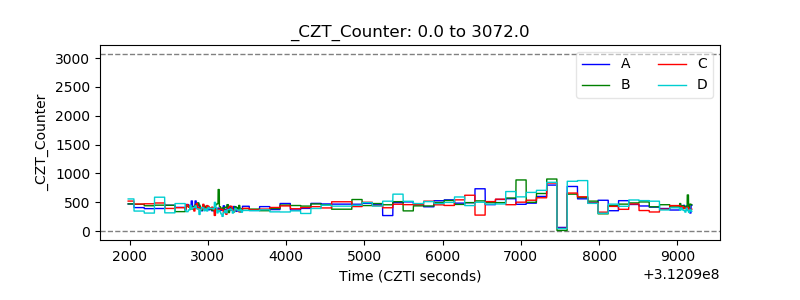 |
| +2.5 Volts monitor | 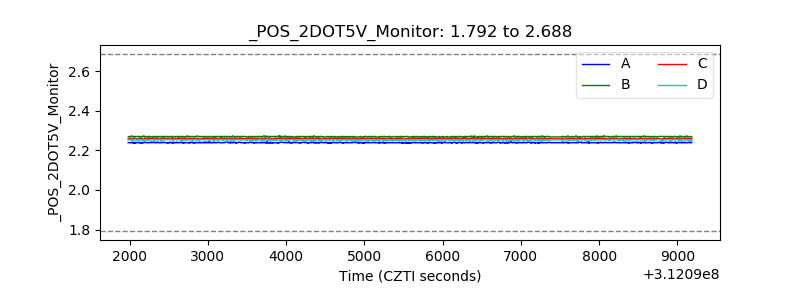 |
| +5 Volts monitor |  |
| _ROLL_ROT | 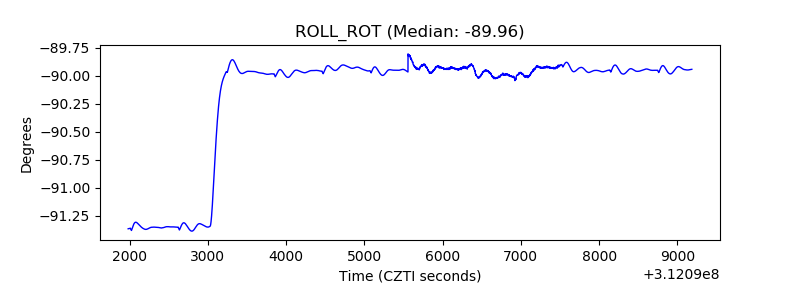 |
| _Roll_DEC | 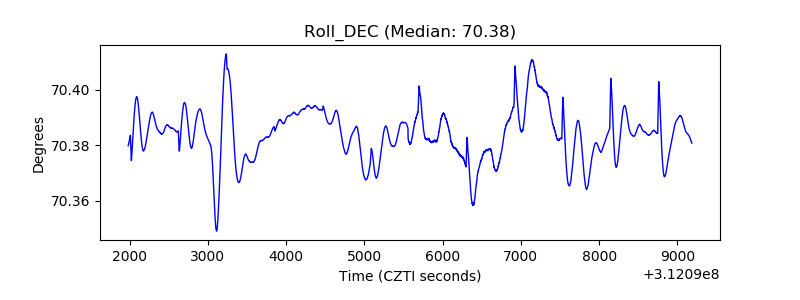 |
| _Roll_RA | 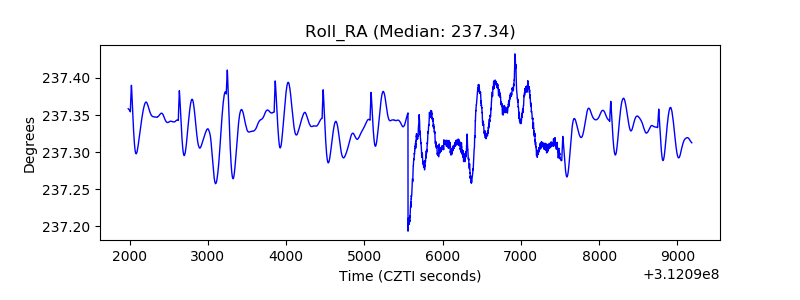 |
| Veto Counter | 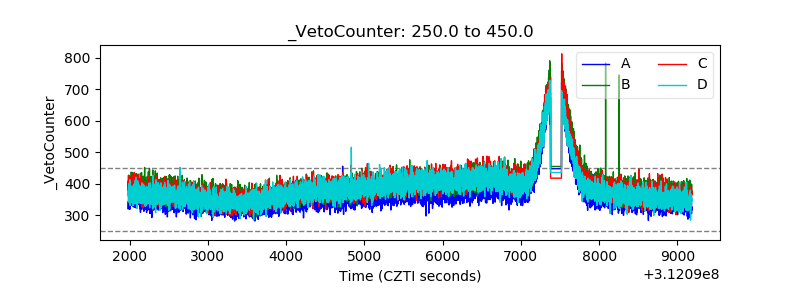 |