| Param | Original file | Final file |
|---|---|---|
| Filename | modeM0/AS1A07_056T01_9000003330_22445cztM0_level2.evt | modeM0/AS1A07_056T01_9000003330_22445cztM0_level2_quad_clean.evt |
| Size (bytes) | 1,567,621,440 | 412,200,000 |
| Size | 1.5 GB | 393.1 MB |
| Events in quadrant A | 10,276,965 | 2,792,552 |
| Events in quadrant B | 12,250,925 | 2,821,799 |
| Events in quadrant C | 11,028,085 | 2,695,020 |
| Events in quadrant D | 12,403,669 | 2,632,663 |
| Mode SS | |||
|---|---|---|---|
| Quadrant | BADHDUFLAG | Total packets | Discarded packets |
| A | 0 | 456 | 0 |
| B | 0 | 456 | 0 |
| C | 0 | 456 | 0 |
| D | 0 | 456 | 0 |
| Mode M9 | |||
|---|---|---|---|
| Quadrant | BADHDUFLAG | Total packets | Discarded packets |
| A | 0 | 29 | 0 |
| B | 0 | 29 | 0 |
| C | 0 | 29 | 0 |
| D | 0 | 29 | 0 |
| Mode M0 | |||
|---|---|---|---|
| Quadrant | BADHDUFLAG | Total packets | Discarded packets |
| A | 0 | 45548 | 4 |
| B | 0 | 50961 | 4 |
| C | 0 | 47412 | 4 |
| D | 0 | 52543 | 4 |
| Quadrant | Total seconds | Saturated seconds | Saturation percentage |
|---|---|---|---|
| A | 22437 | 145 | 0.646254% |
| B | 22437 | 407 | 1.813968% |
| C | 22437 | 321 | 1.430673% |
| D | 22437 | 435 | 1.938762% |
Noise dominated data is calculated using 1-second bins in cleaned event files. If a bin has >2000 counts, and if more than 50% of those come from <1% of pixels, then it is considered to be noise-dominated and hence unusable.
| Quadrant | # 1 sec bins | Bins with >0 counts | Bins with >2000 counts | High rate bins dominated by noise | Noise dominated (total time) | Noise dominated (detector-on time) | Marked lightcurve |
|---|---|---|---|---|---|---|---|
| A | 25267 | 22438 | 0 | 0 | 0.00% | 0.00% | 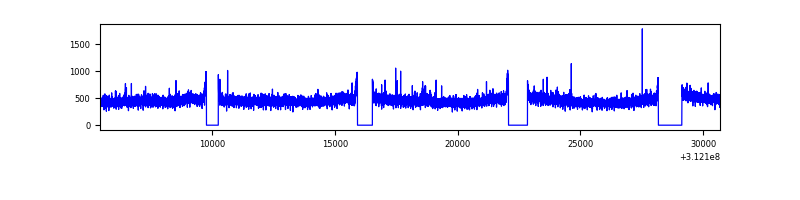 |
| B | 25267 | 22440 | 173 | 173 | 0.68% | 0.77% | 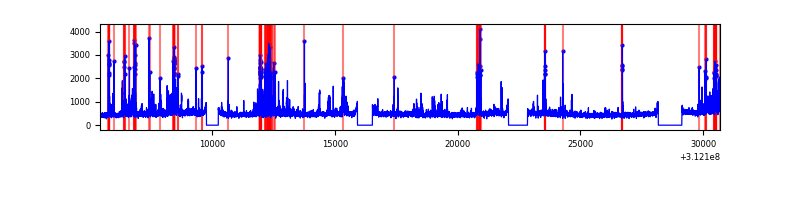 |
| C | 25267 | 22439 | 33 | 33 | 0.13% | 0.15% | 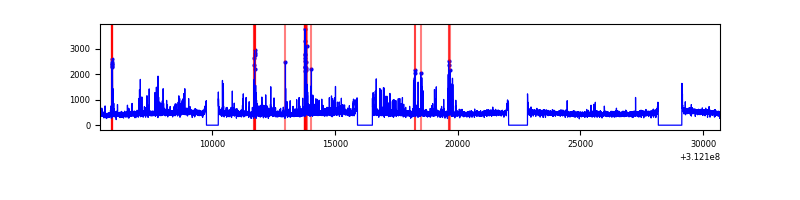 |
| D | 25267 | 22438 | 269 | 269 | 1.06% | 1.20% | 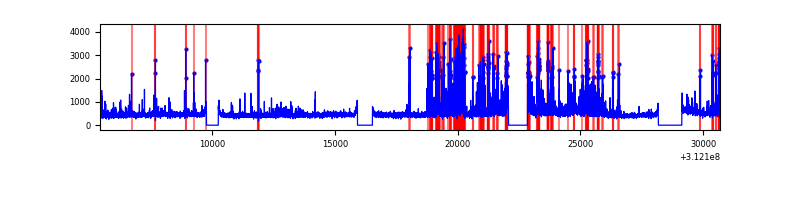 |
Top three noisy pixels from each quadrant. If the there are fewer than three noisy pixels in the level2.evt file, extra rows are filled as -1
| Pixel properties | Quadrant properties | ||||||
|---|---|---|---|---|---|---|---|
| Quadrant | DetID | PixID | Counts | Sigma | Mean | Median | Sigma |
| A | 3 | 1 | 86791 | 159.13 | 2634 | 2575 | 529.2 |
| A | 15 | 174 | 41509 | 73.57 | 2634 | 2575 | 529.2 |
| A | 13 | 254 | 32141 | 55.86 | 2634 | 2575 | 529.2 |
| B | 10 | 245 | 1753846 | 3546.17 | 2616 | 2544 | 493.9 |
| B | 0 | 190 | 81675 | 160.23 | 2616 | 2544 | 493.9 |
| B | 12 | 111 | 61510 | 119.4 | 2616 | 2544 | 493.9 |
| C | 0 | 239 | 506964 | 857.43 | 2526 | 2535 | 588.3 |
| C | 14 | 238 | 402593 | 680.02 | 2526 | 2535 | 588.3 |
| C | 10 | 22 | 239085 | 402.09 | 2526 | 2535 | 588.3 |
| D | 1 | 52 | 2298962 | 3698.72 | 2553 | 2476 | 620.9 |
| D | 13 | 172 | 168275 | 267.04 | 2553 | 2476 | 620.9 |
| D | 2 | 234 | 94919 | 148.89 | 2553 | 2476 | 620.9 |
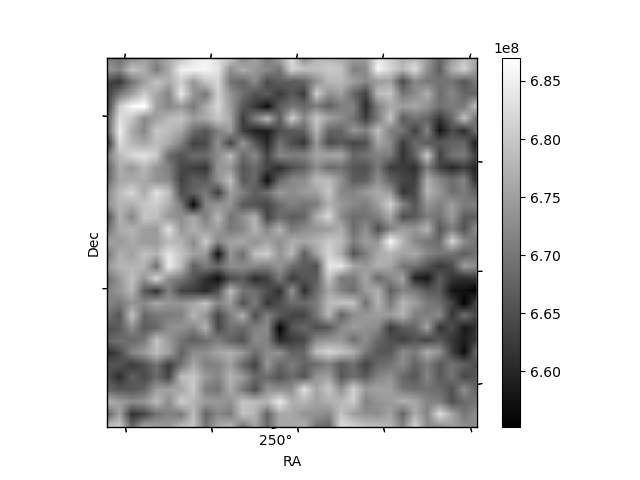
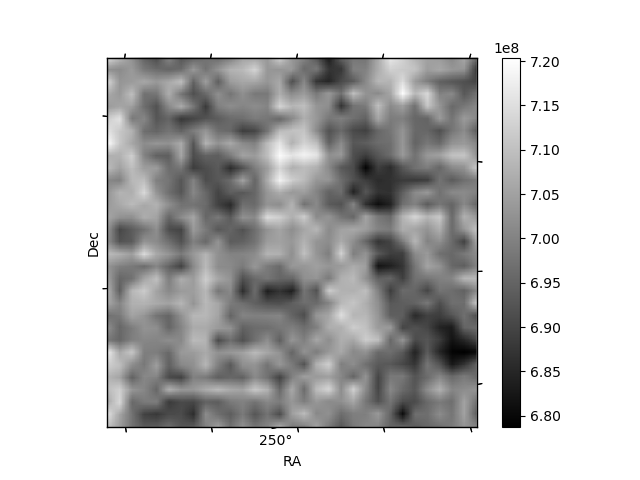
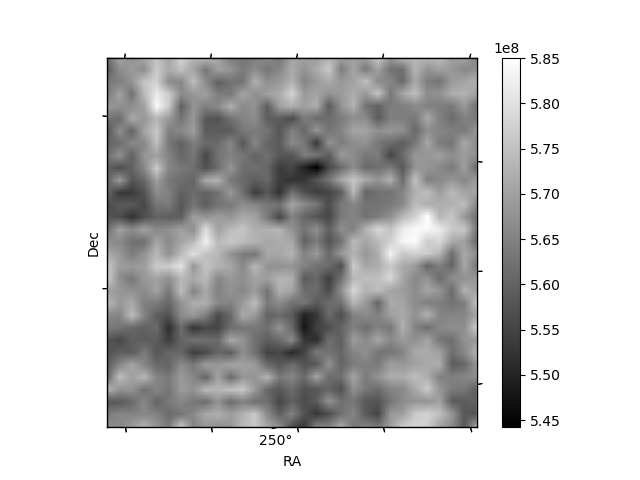
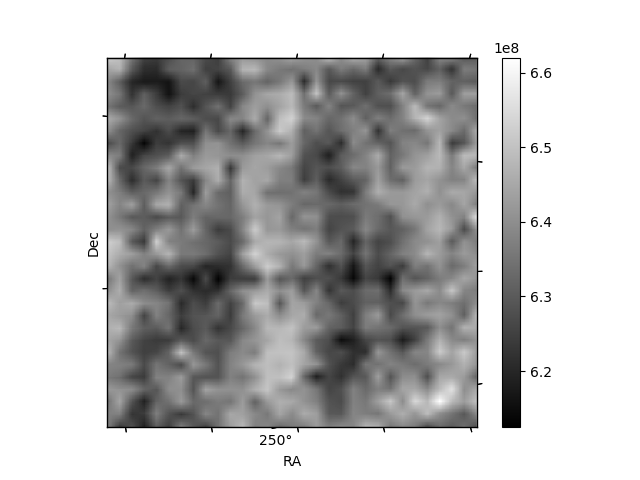
Histogram calculated using DETX and DETY for each event in the final _common_clean file
| Quadrant A |  |
 |
Quadrant B |
|---|---|---|---|
| Quadrant D |  |
 |
Quadrant C |
| Plot type | Count rate plots | Images |
|---|---|---|
| Comparison with Poisson distribution Blue bars denote a histogram of data divided into 1 sec bins. Red curve is a Poisson curve with rate = median count rate of data. |
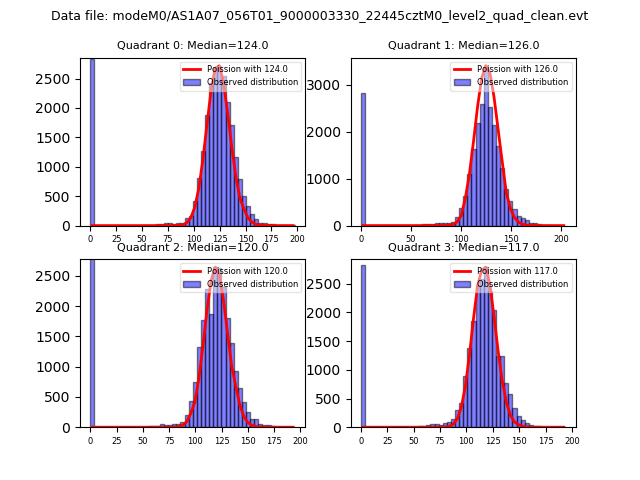 |
 |
| Quadrant-wise count rates Data is divided into 100 sec bins |
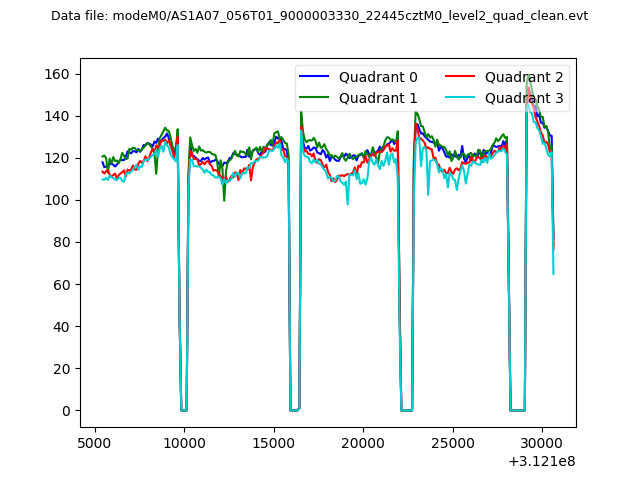 |
|
| Module-wise count rates for Quadrant A Data is divided into 100 sec bins |
 |
 |
| Module-wise count rates for Quadrant B Data is divided into 100 sec bins |
 |
 |
| Module-wise count rates for Quadrant C Data is divided into 100 sec bins |
 |
 |
| Module-wise count rates for Quadrant D Data is divided into 100 sec bins |
 |
 |
| Parameter | Plot |
|---|---|
| CZT HV Monitor |  |
| D_VDD | 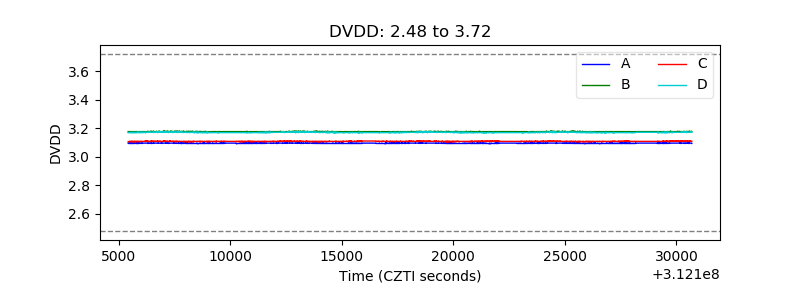 |
| Temperature 1 |  |
| Veto HV Monitor |  |
| Veto LLD |  |
| Alpha Counter | 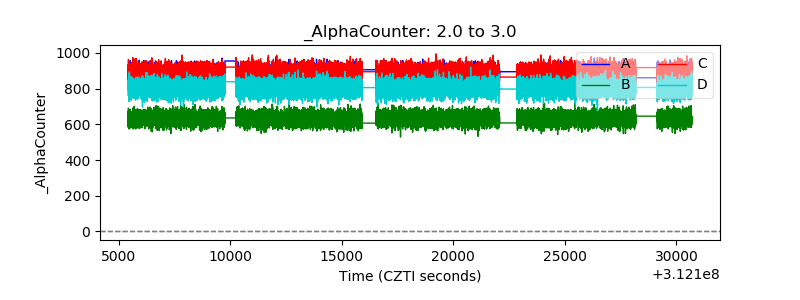 |
| _CPM_Rate | 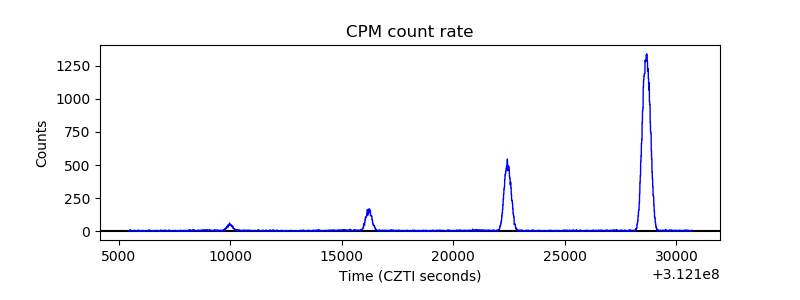 |
| CZT Counter |  |
| +2.5 Volts monitor |  |
| +5 Volts monitor |  |
| _ROLL_ROT |  |
| _Roll_DEC |  |
| _Roll_RA |  |
| Veto Counter |  |