| Param | Original file | Final file |
|---|---|---|
| Filename | modeM0/AS1A07_056T01_9000003330_22448cztM0_level2.evt | modeM0/AS1A07_056T01_9000003330_22448cztM0_level2_quad_clean.evt |
| Size (bytes) | 466,168,320 | 128,272,320 |
| Size | 444.6 MB | 122.3 MB |
| Events in quadrant A | 3,039,753 | 871,047 |
| Events in quadrant B | 3,944,308 | 878,887 |
| Events in quadrant C | 3,187,680 | 862,925 |
| Events in quadrant D | 3,526,330 | 840,754 |
| Mode SS | |||
|---|---|---|---|
| Quadrant | BADHDUFLAG | Total packets | Discarded packets |
| A | 0 | 124 | 0 |
| B | 0 | 124 | 0 |
| C | 0 | 124 | 0 |
| D | 0 | 124 | 0 |
| Mode M9 | |||
|---|---|---|---|
| Quadrant | BADHDUFLAG | Total packets | Discarded packets |
| A | 0 | 13 | 0 |
| B | 0 | 13 | 0 |
| C | 0 | 13 | 0 |
| D | 0 | 13 | 0 |
| Mode M0 | |||
|---|---|---|---|
| Quadrant | BADHDUFLAG | Total packets | Discarded packets |
| A | 0 | 13127 | 1 |
| B | 0 | 15895 | 1 |
| C | 0 | 13481 | 1 |
| D | 0 | 14732 | 1 |
| Quadrant | Total seconds | Saturated seconds | Saturation percentage |
|---|---|---|---|
| A | 6190 | 28 | 0.452342% |
| B | 6189 | 200 | 3.231540% |
| C | 6189 | 108 | 1.745032% |
| D | 6189 | 40 | 0.646308% |
Noise dominated data is calculated using 1-second bins in cleaned event files. If a bin has >2000 counts, and if more than 50% of those come from <1% of pixels, then it is considered to be noise-dominated and hence unusable.
| Quadrant | # 1 sec bins | Bins with >0 counts | Bins with >2000 counts | High rate bins dominated by noise | Noise dominated (total time) | Noise dominated (detector-on time) | Marked lightcurve |
|---|---|---|---|---|---|---|---|
| A | 7420 | 6191 | 0 | 0 | 0.00% | 0.00% | 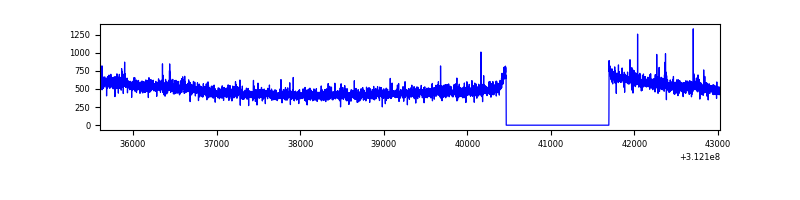 |
| B | 7419 | 6190 | 128 | 128 | 1.73% | 2.07% | 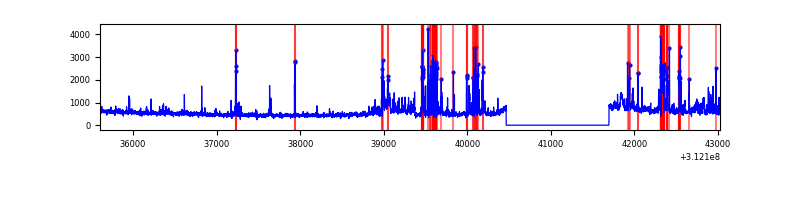 |
| C | 7419 | 6189 | 5 | 5 | 0.07% | 0.08% | 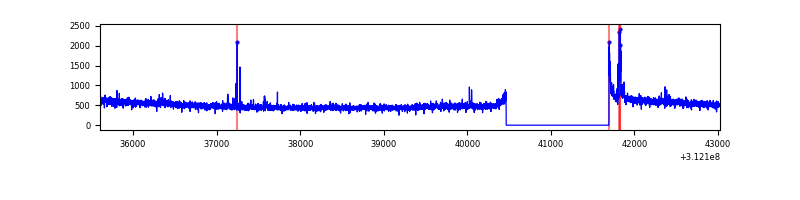 |
| D | 7419 | 6189 | 7 | 7 | 0.09% | 0.11% | 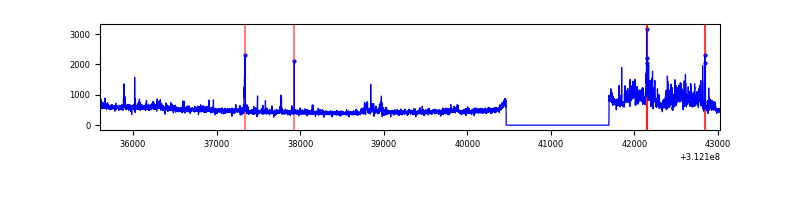 |
Top three noisy pixels from each quadrant. If the there are fewer than three noisy pixels in the level2.evt file, extra rows are filled as -1
| Pixel properties | Quadrant properties | ||||||
|---|---|---|---|---|---|---|---|
| Quadrant | DetID | PixID | Counts | Sigma | Mean | Median | Sigma |
| A | 3 | 1 | 37301 | 236.42 | 774 | 758 | 154.6 |
| A | 15 | 174 | 11010 | 66.33 | 774 | 758 | 154.6 |
| A | 13 | 254 | 10113 | 60.52 | 774 | 758 | 154.6 |
| B | 10 | 245 | 874293 | 6130.04 | 765 | 747 | 142.5 |
| B | 0 | 190 | 25409 | 173.06 | 765 | 747 | 142.5 |
| B | 12 | 111 | 16394 | 109.8 | 765 | 747 | 142.5 |
| C | 14 | 238 | 122085 | 688.66 | 759 | 764 | 176.2 |
| C | 10 | 22 | 56320 | 315.35 | 759 | 764 | 176.2 |
| C | 3 | 9 | 22762 | 124.87 | 759 | 764 | 176.2 |
| D | 1 | 52 | 374713 | 2037.39 | 766 | 745 | 183.6 |
| D | 7 | 223 | 144252 | 781.83 | 766 | 745 | 183.6 |
| D | 13 | 172 | 43228 | 231.45 | 766 | 745 | 183.6 |
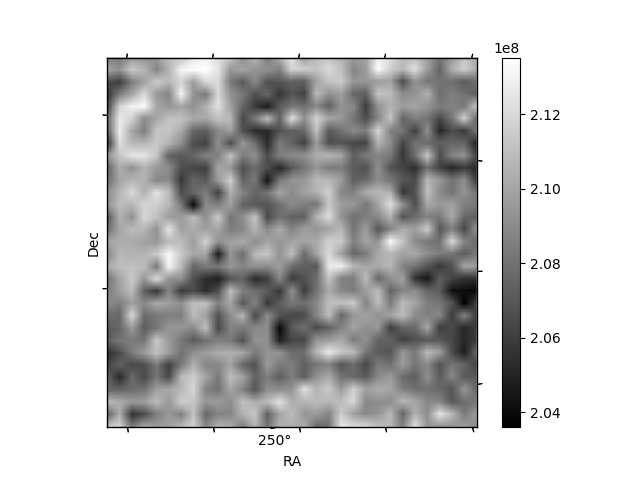
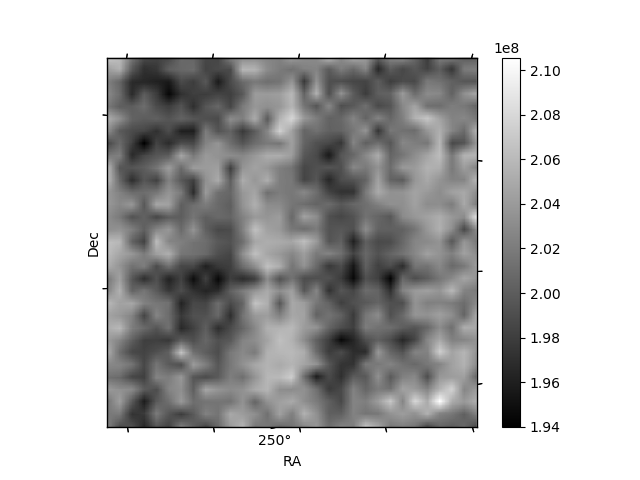
Histogram calculated using DETX and DETY for each event in the final _common_clean file
| Quadrant A | 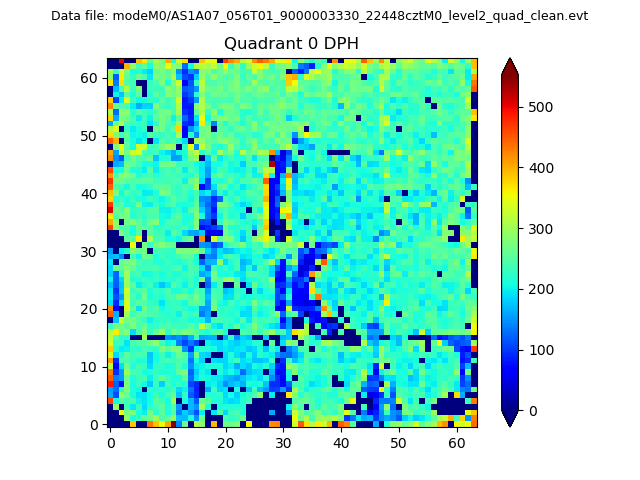 |
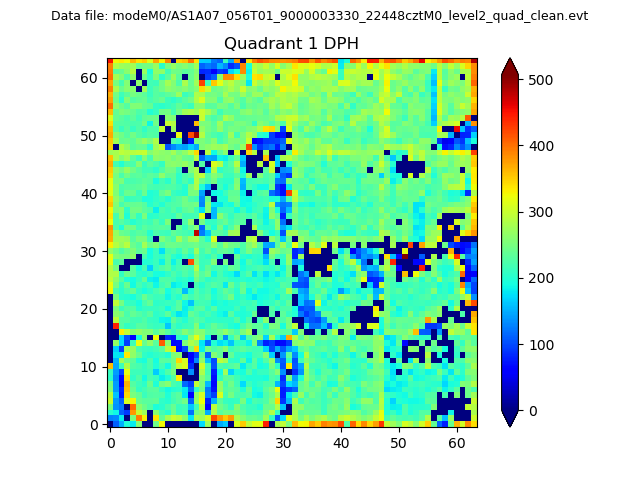 |
Quadrant B |
|---|---|---|---|
| Quadrant D | 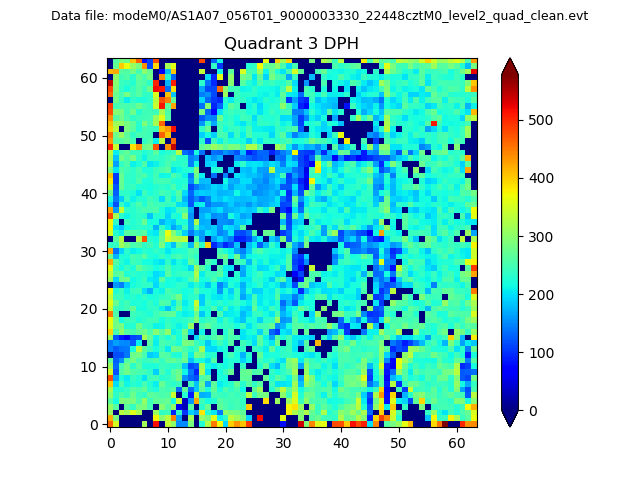 |
 |
Quadrant C |
| Plot type | Count rate plots | Images |
|---|---|---|
| Comparison with Poisson distribution Blue bars denote a histogram of data divided into 1 sec bins. Red curve is a Poisson curve with rate = median count rate of data. |
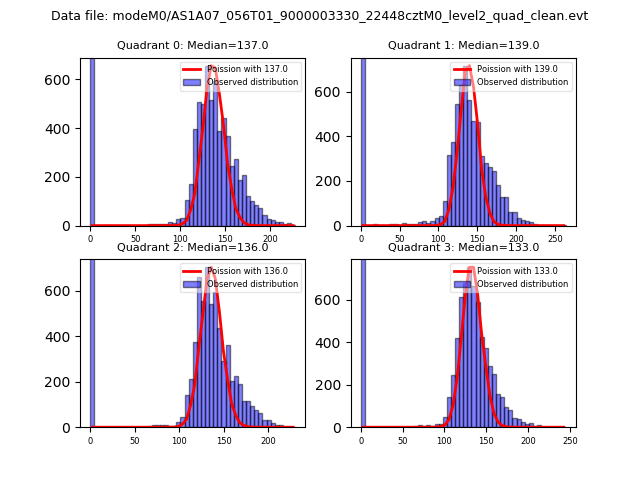 |
 |
| Quadrant-wise count rates Data is divided into 100 sec bins |
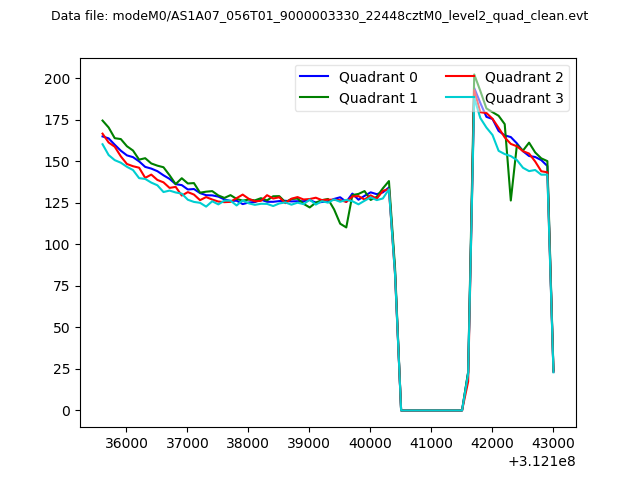 |
|
| Module-wise count rates for Quadrant A Data is divided into 100 sec bins |
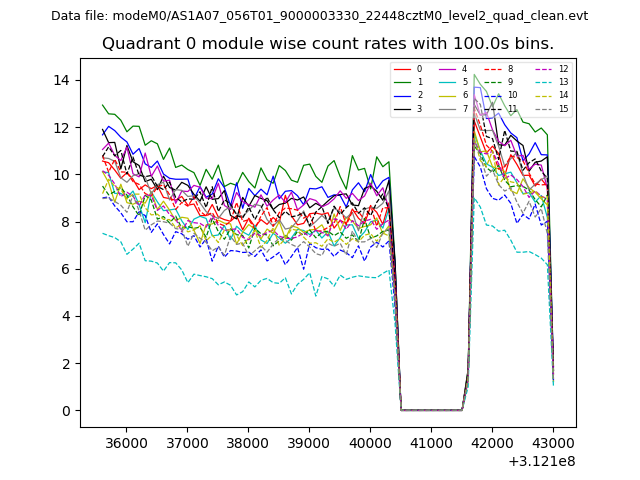 |
 |
| Module-wise count rates for Quadrant B Data is divided into 100 sec bins |
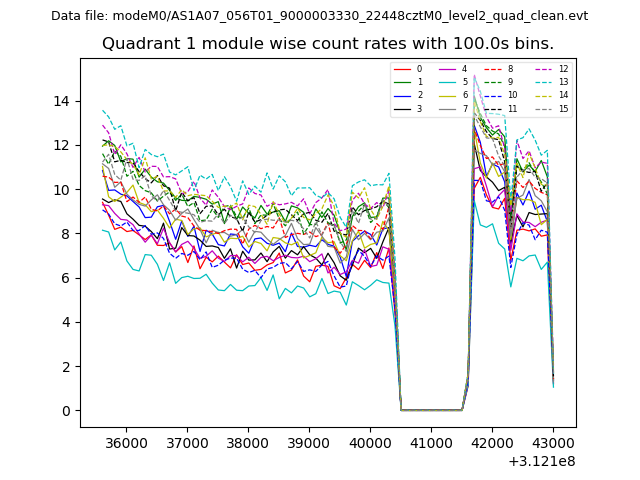 |
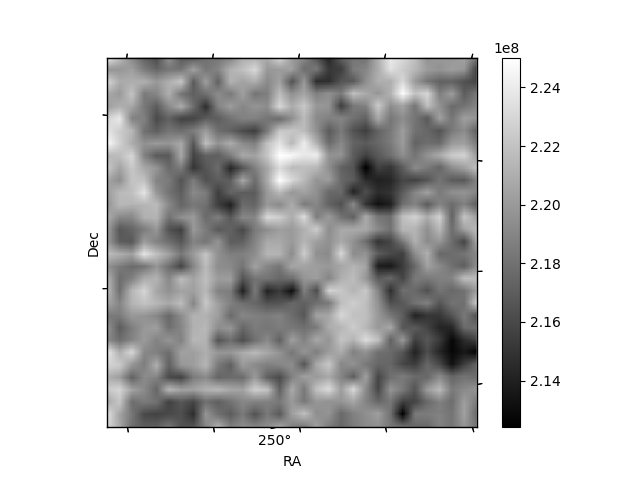 |
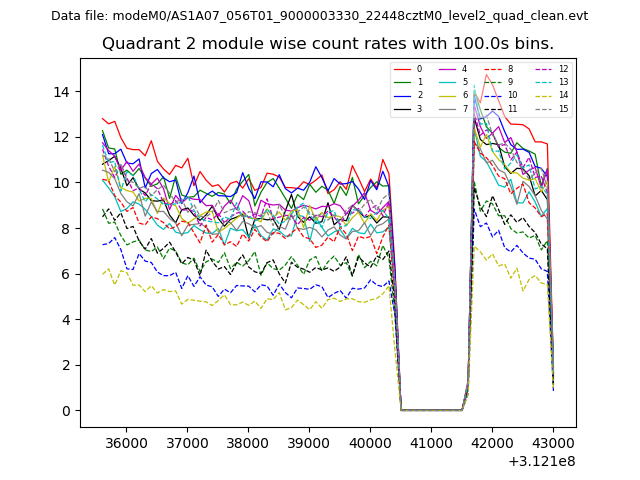
| Module-wise count rates for Quadrant C Data is divided into 100 sec bins |
 |
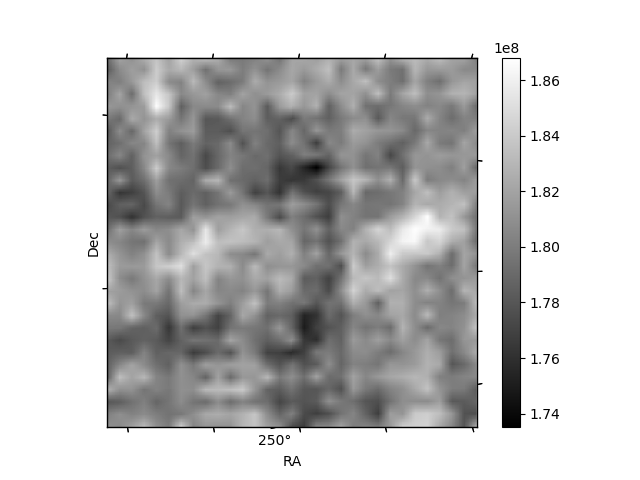 |
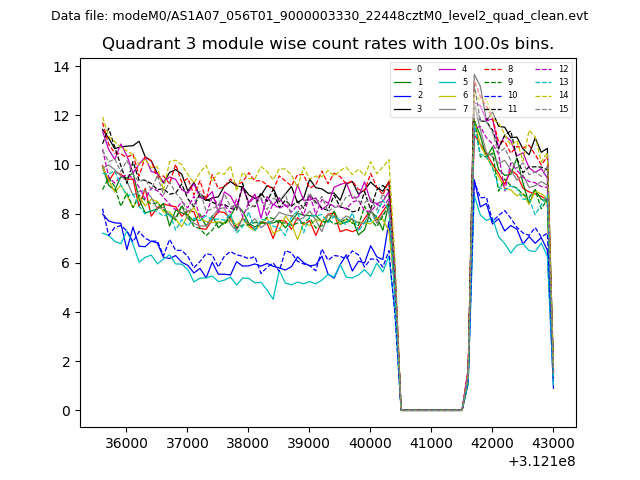
| Module-wise count rates for Quadrant D Data is divided into 100 sec bins |
 |
 |
| Parameter | Plot |
|---|---|
| CZT HV Monitor | 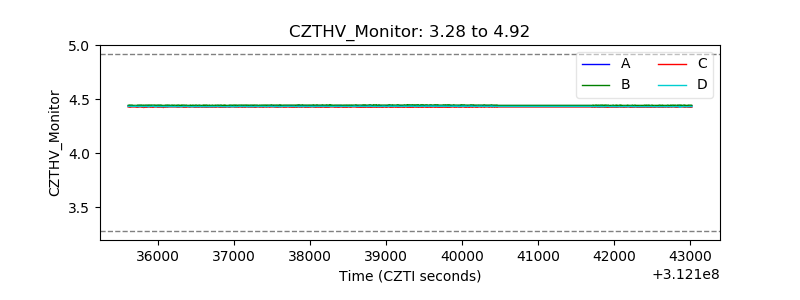 |
| D_VDD | 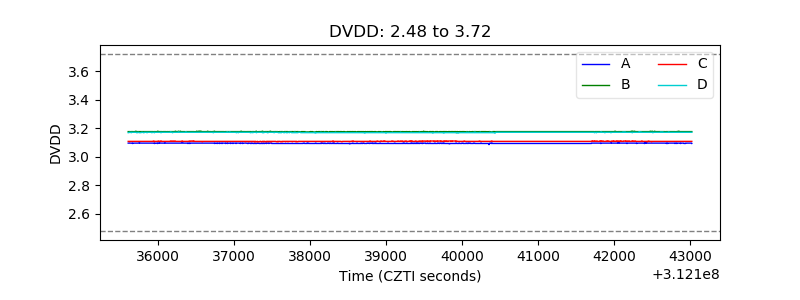 |
| Temperature 1 | 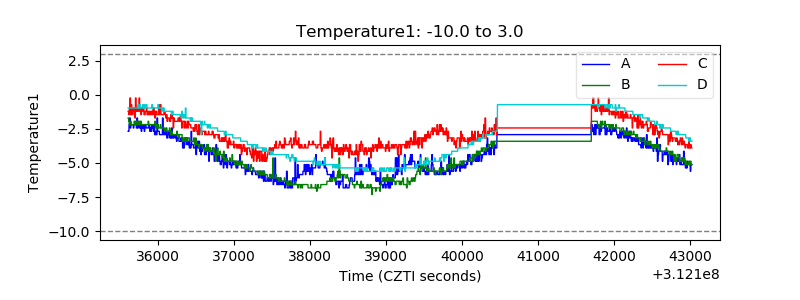 |
| Veto HV Monitor | 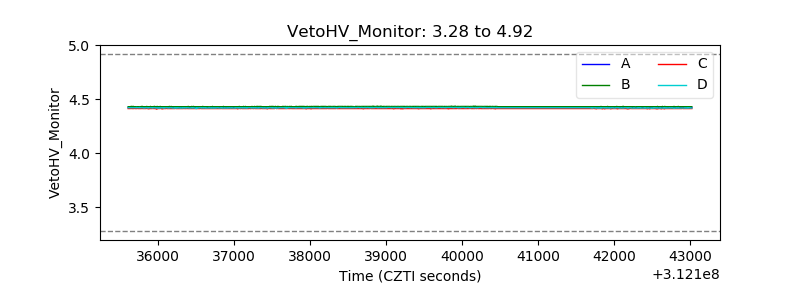 |
| Veto LLD | 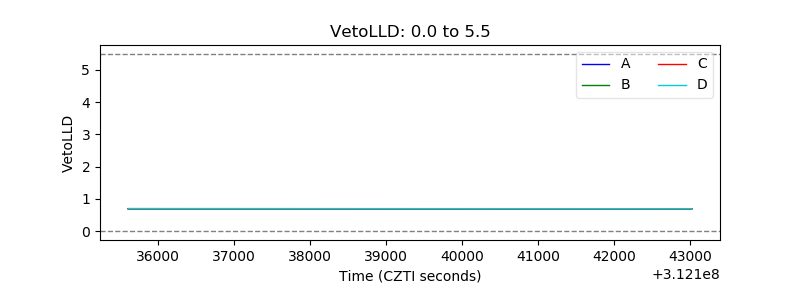 |
| Alpha Counter | 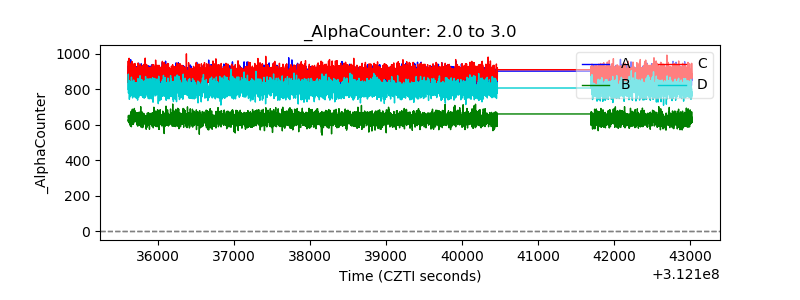 |
| _CPM_Rate | 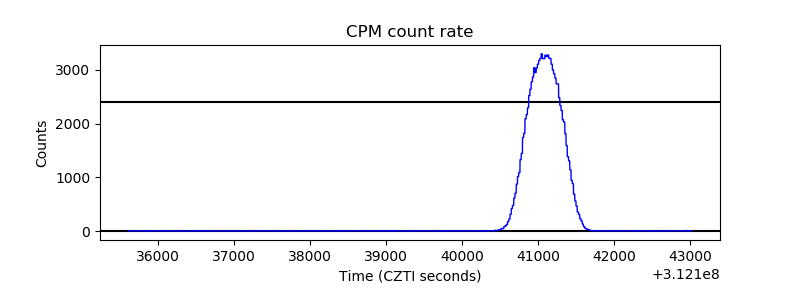 |
| CZT Counter | 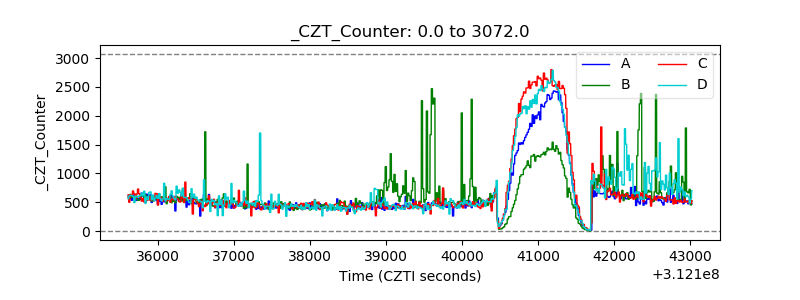 |
| +2.5 Volts monitor |  |
| +5 Volts monitor | 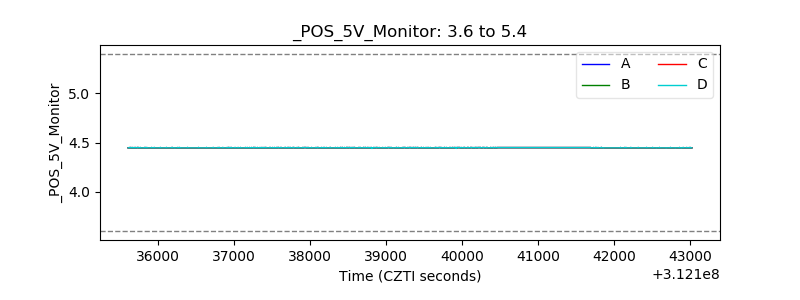 |
| _ROLL_ROT | 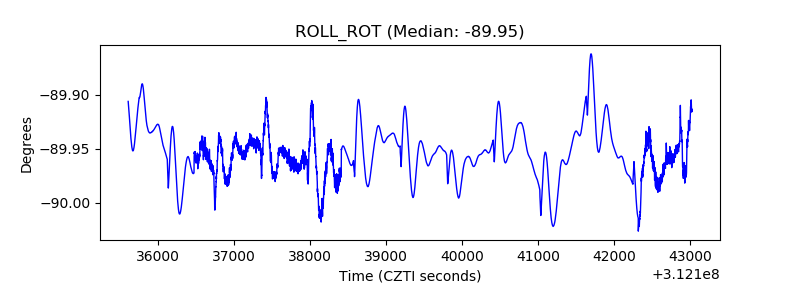 |
| _Roll_DEC | 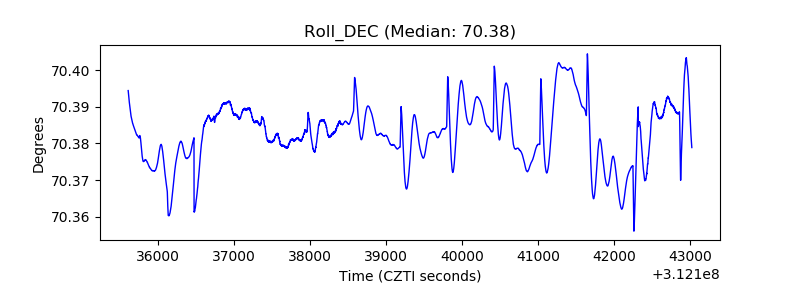 |
| _Roll_RA | 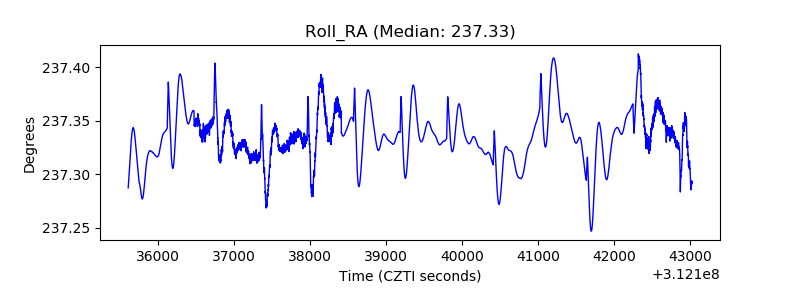 |
| Veto Counter | 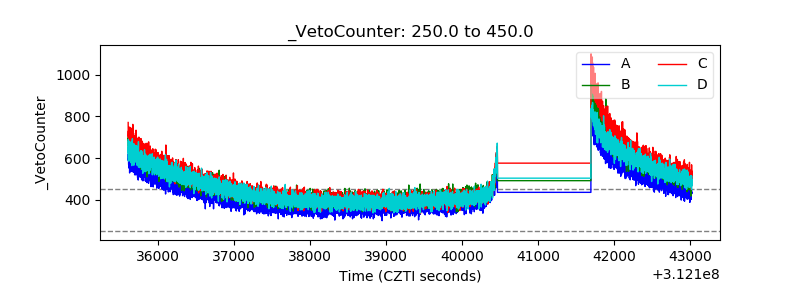 |