| Param | Original file | Final file |
|---|---|---|
| Filename | modeM0/AS1A07_056T01_9000003330_22449cztM0_level2.evt | modeM0/AS1A07_056T01_9000003330_22449cztM0_level2_quad_clean.evt |
| Size (bytes) | 490,734,720 | 132,494,400 |
| Size | 468.0 MB | 126.4 MB |
| Events in quadrant A | 3,072,834 | 901,602 |
| Events in quadrant B | 4,364,022 | 908,589 |
| Events in quadrant C | 3,438,225 | 898,321 |
| Events in quadrant D | 3,568,863 | 874,556 |
| Mode SS | |||
|---|---|---|---|
| Quadrant | BADHDUFLAG | Total packets | Discarded packets |
| A | 0 | 124 | 0 |
| B | 0 | 124 | 0 |
| C | 0 | 124 | 0 |
| D | 0 | 124 | 0 |
| Mode M9 | |||
|---|---|---|---|
| Quadrant | BADHDUFLAG | Total packets | Discarded packets |
| A | 0 | 13 | 0 |
| B | 0 | 13 | 0 |
| C | 0 | 13 | 0 |
| D | 0 | 13 | 0 |
| Mode M0 | |||
|---|---|---|---|
| Quadrant | BADHDUFLAG | Total packets | Discarded packets |
| A | 0 | 13193 | 1 |
| B | 0 | 17223 | 1 |
| C | 0 | 14274 | 1 |
| D | 0 | 15008 | 1 |
| Quadrant | Total seconds | Saturated seconds | Saturation percentage |
|---|---|---|---|
| A | 6164 | 49 | 0.794938% |
| B | 6163 | 342 | 5.549245% |
| C | 6163 | 143 | 2.320299% |
| D | 6163 | 70 | 1.135810% |
Noise dominated data is calculated using 1-second bins in cleaned event files. If a bin has >2000 counts, and if more than 50% of those come from <1% of pixels, then it is considered to be noise-dominated and hence unusable.
| Quadrant | # 1 sec bins | Bins with >0 counts | Bins with >2000 counts | High rate bins dominated by noise | Noise dominated (total time) | Noise dominated (detector-on time) | Marked lightcurve |
|---|---|---|---|---|---|---|---|
| A | 7474 | 6165 | 0 | 0 | 0.00% | 0.00% | 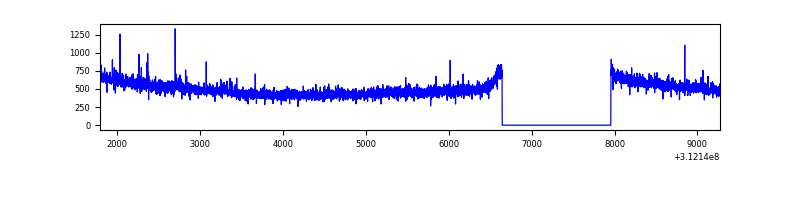 |
| B | 7473 | 6163 | 238 | 238 | 3.18% | 3.86% | 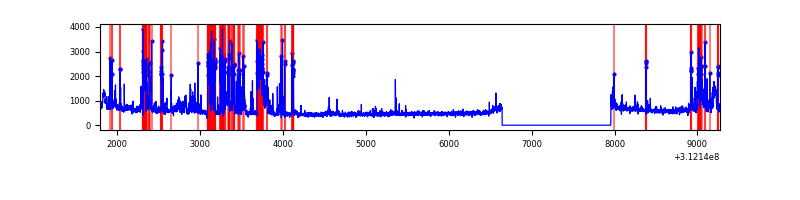 |
| C | 7473 | 6163 | 19 | 19 | 0.25% | 0.31% | 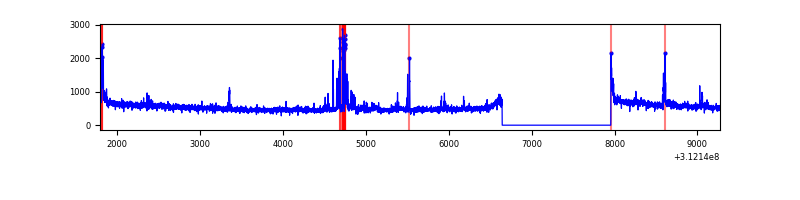 |
| D | 7473 | 6164 | 15 | 15 | 0.20% | 0.24% | 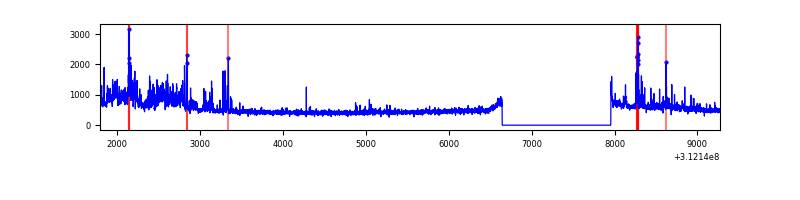 |
Top three noisy pixels from each quadrant. If the there are fewer than three noisy pixels in the level2.evt file, extra rows are filled as -1
| Pixel properties | Quadrant properties | ||||||
|---|---|---|---|---|---|---|---|
| Quadrant | DetID | PixID | Counts | Sigma | Mean | Median | Sigma |
| A | 3 | 1 | 22258 | 138.03 | 787 | 771 | 155.7 |
| A | 15 | 174 | 10318 | 61.33 | 787 | 771 | 155.7 |
| A | 13 | 254 | 9359 | 55.17 | 787 | 771 | 155.7 |
| B | 10 | 245 | 1265825 | 8838.26 | 778 | 760 | 143.1 |
| B | 0 | 228 | 16584 | 110.55 | 778 | 760 | 143.1 |
| B | 12 | 111 | 16421 | 109.41 | 778 | 760 | 143.1 |
| C | 10 | 22 | 192960 | 1067.47 | 778 | 783 | 180.0 |
| C | 14 | 238 | 124136 | 685.18 | 778 | 783 | 180.0 |
| C | 3 | 9 | 41782 | 227.73 | 778 | 783 | 180.0 |
| D | 1 | 52 | 473937 | 2541.67 | 782 | 761 | 186.2 |
| D | 13 | 249 | 60831 | 322.67 | 782 | 761 | 186.2 |
| D | 13 | 172 | 32536 | 170.68 | 782 | 761 | 186.2 |
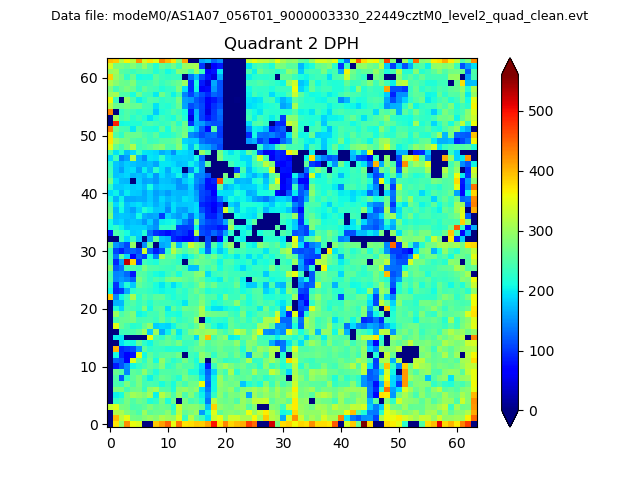
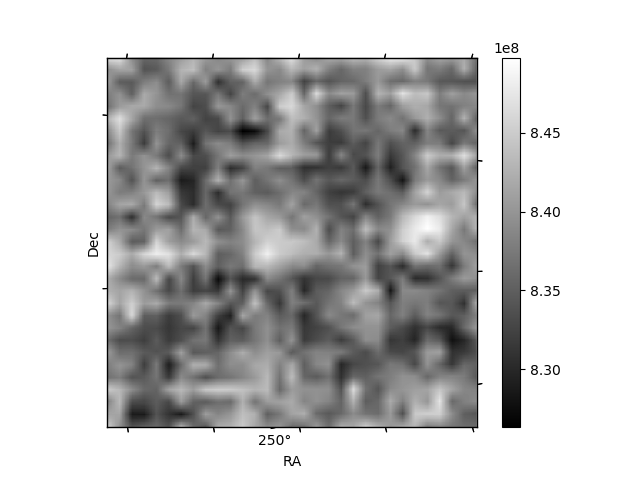
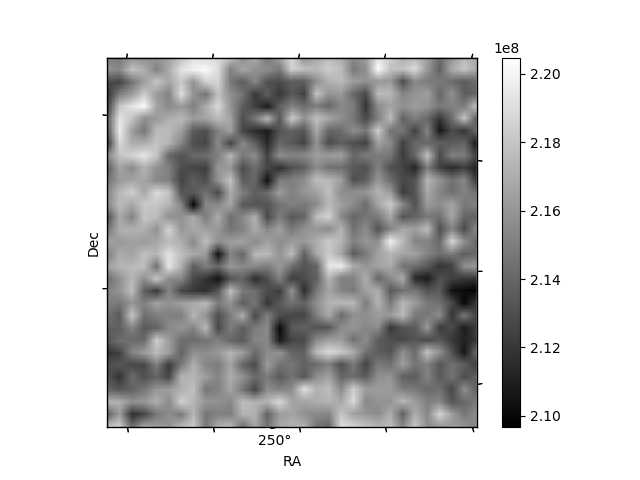
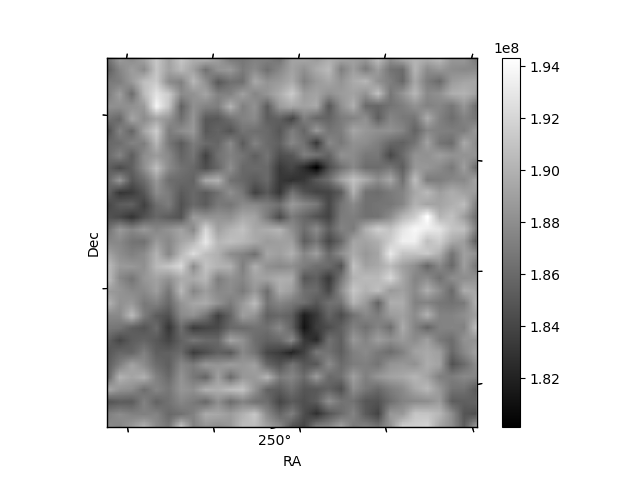
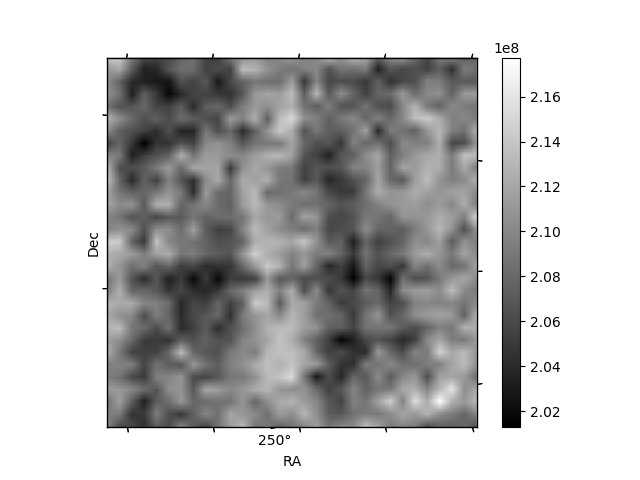
Histogram calculated using DETX and DETY for each event in the final _common_clean file
| Quadrant A | 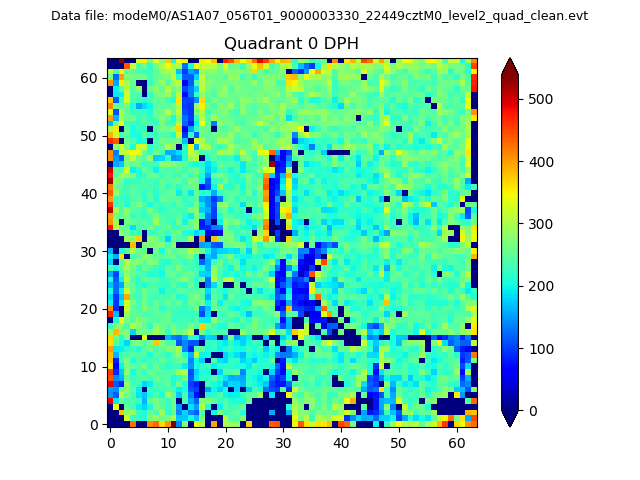 |
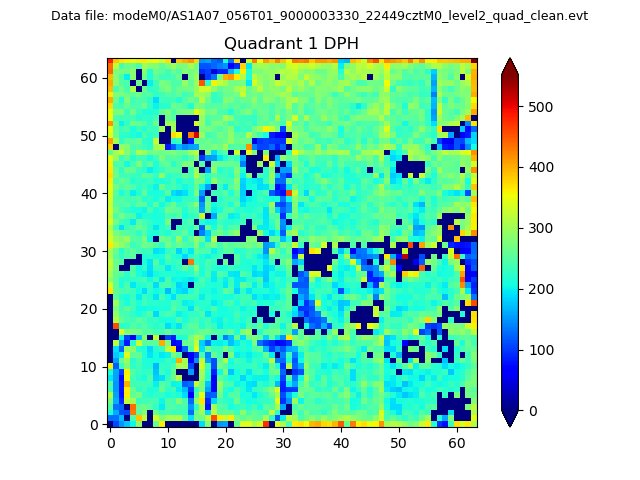 |
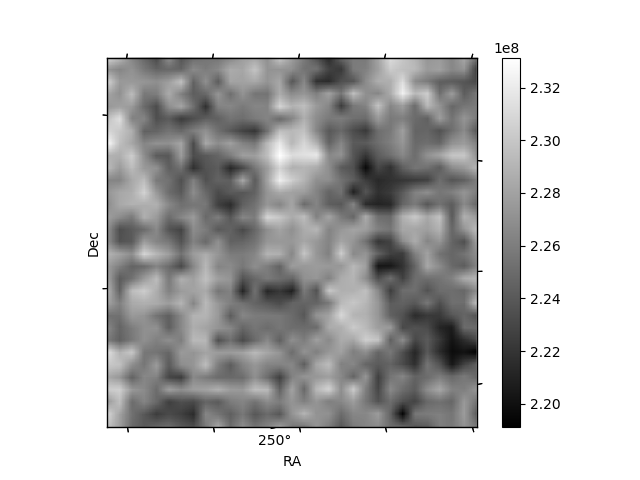
Quadrant B |
|---|---|---|---|
| Quadrant D | 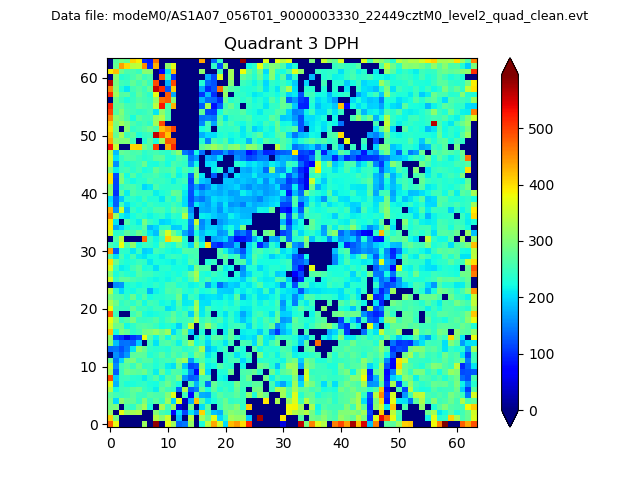 |
 |
Quadrant C |
| Plot type | Count rate plots | Images |
|---|---|---|
| Comparison with Poisson distribution Blue bars denote a histogram of data divided into 1 sec bins. Red curve is a Poisson curve with rate = median count rate of data. |
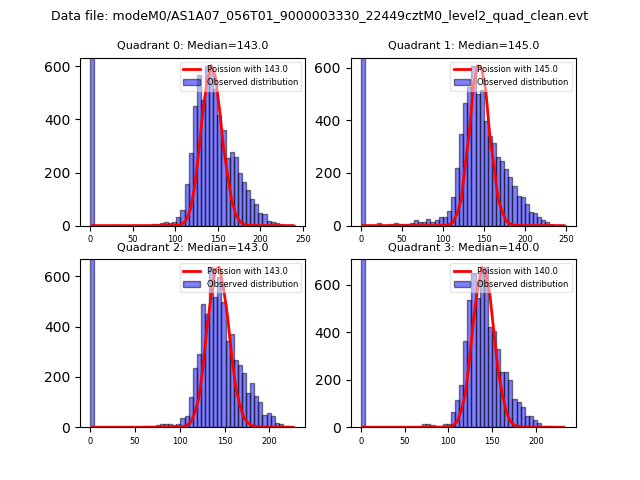 |
 |
| Quadrant-wise count rates Data is divided into 100 sec bins |
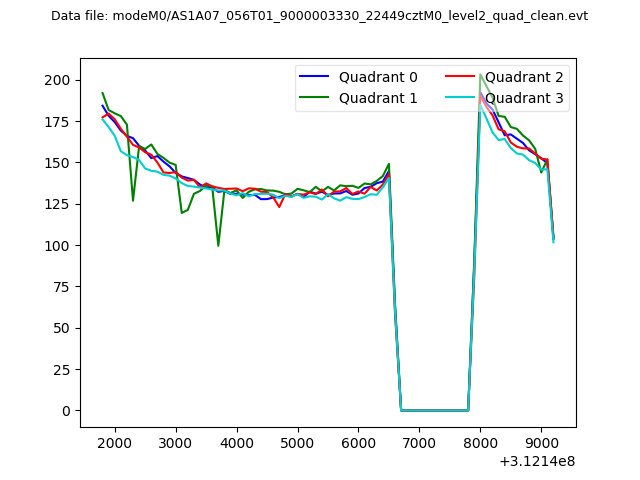 |
|
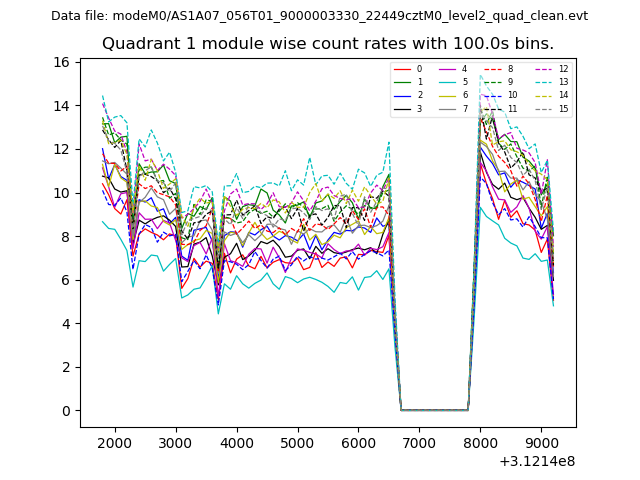
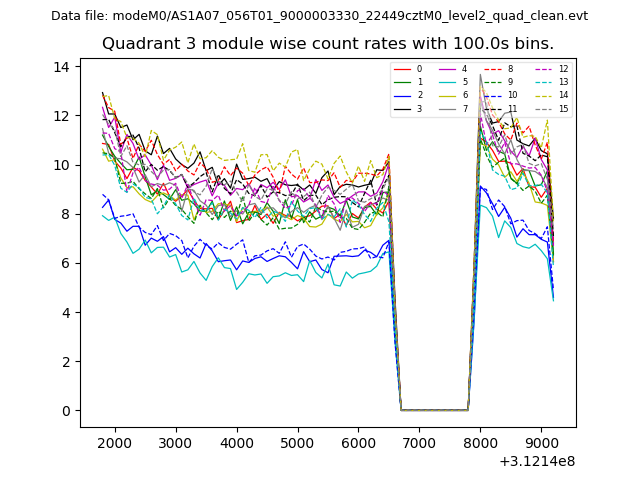
| Module-wise count rates for Quadrant A Data is divided into 100 sec bins |
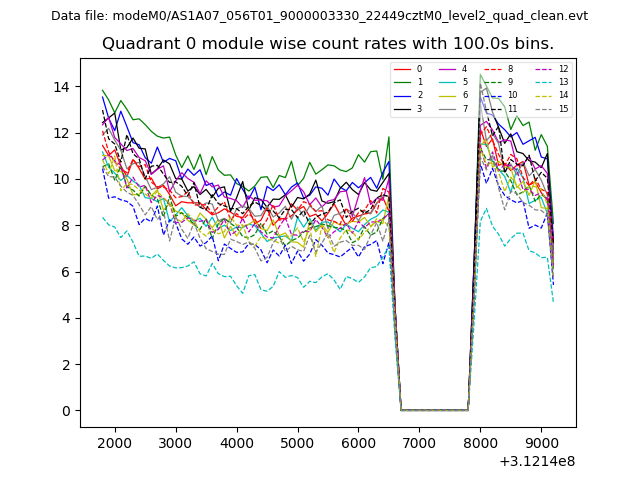 |
 |
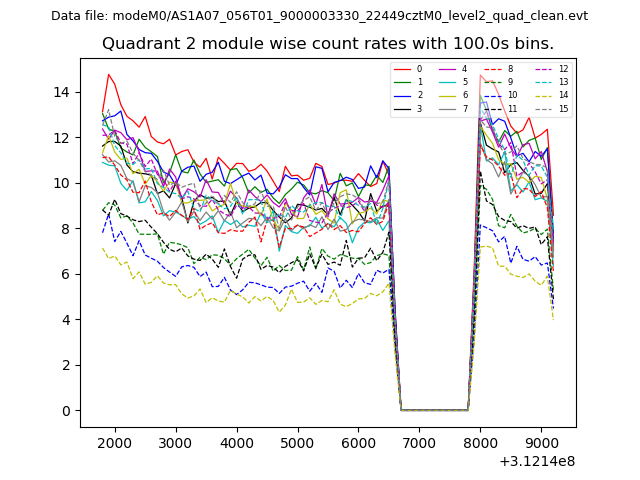
| Module-wise count rates for Quadrant B Data is divided into 100 sec bins |
 |
 |
| Module-wise count rates for Quadrant C Data is divided into 100 sec bins |
 |
 |
| Module-wise count rates for Quadrant D Data is divided into 100 sec bins |
 |
 |
| Parameter | Plot |
|---|---|
| CZT HV Monitor | 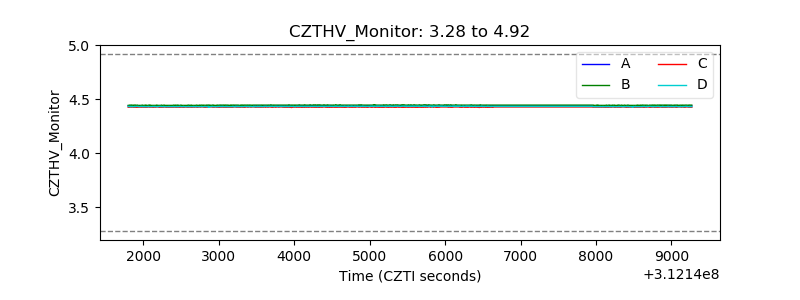 |
| D_VDD | 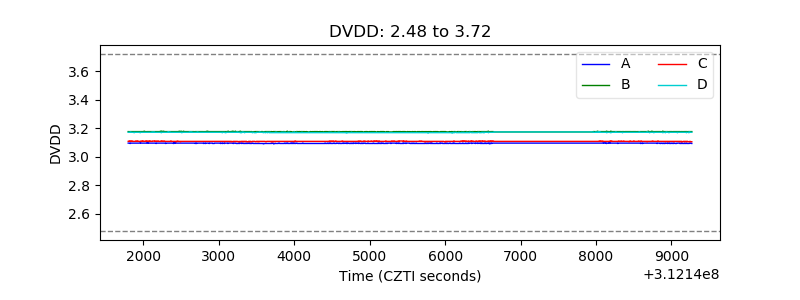 |
| Temperature 1 | 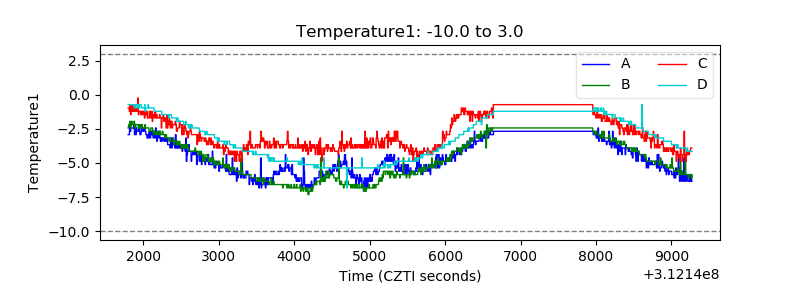 |
| Veto HV Monitor |  |
| Veto LLD | 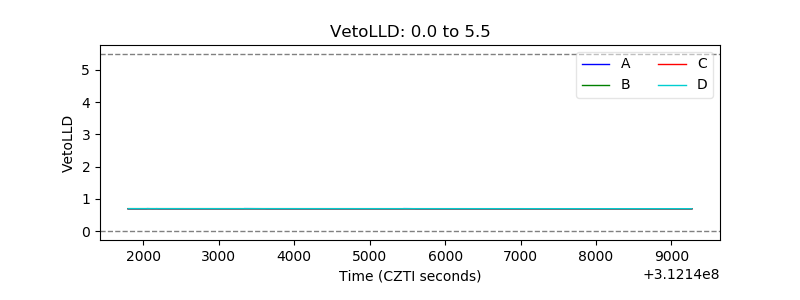 |
| Alpha Counter | 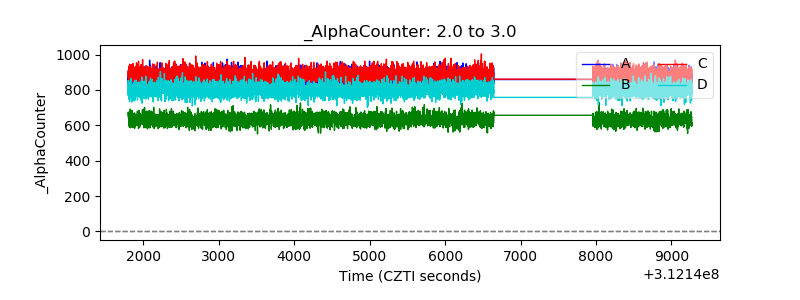 |
| _CPM_Rate | 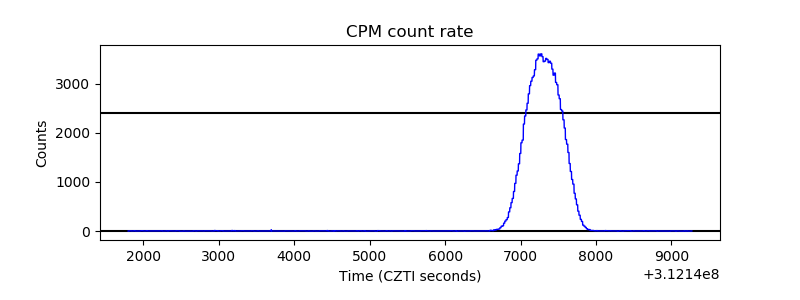 |
| CZT Counter | 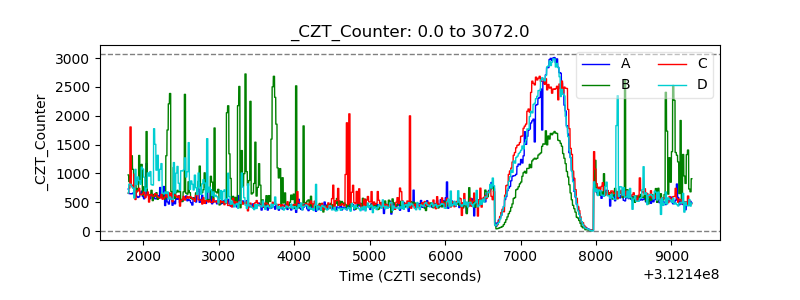 |
| +2.5 Volts monitor | 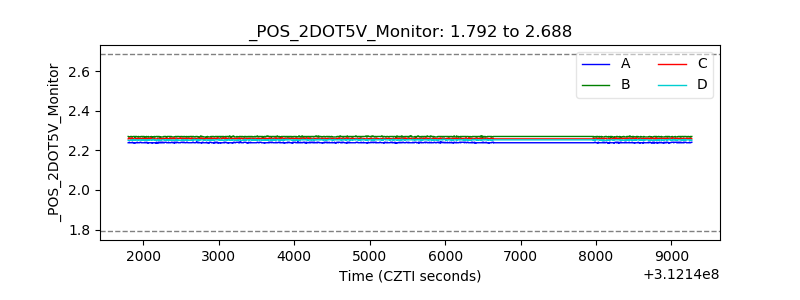 |
| +5 Volts monitor |  |
| _ROLL_ROT | 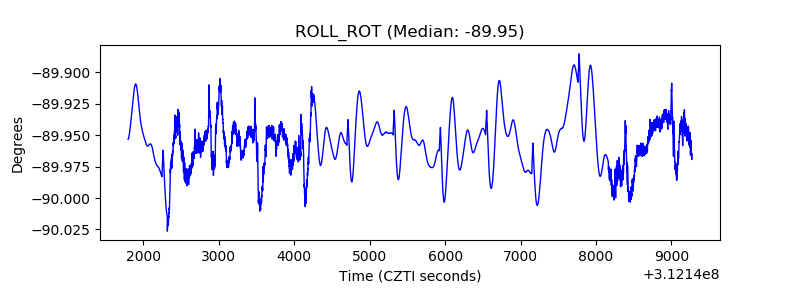 |
| _Roll_DEC | 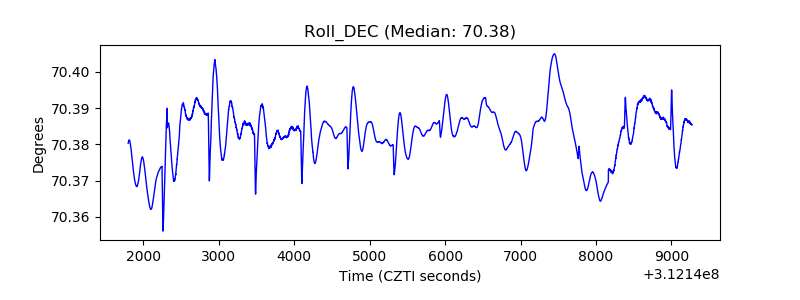 |
| _Roll_RA | 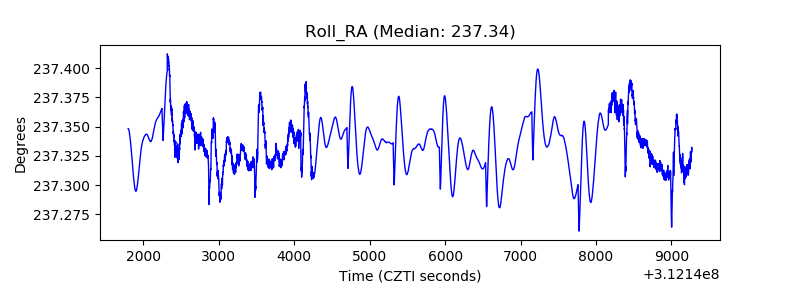 |
| Veto Counter | 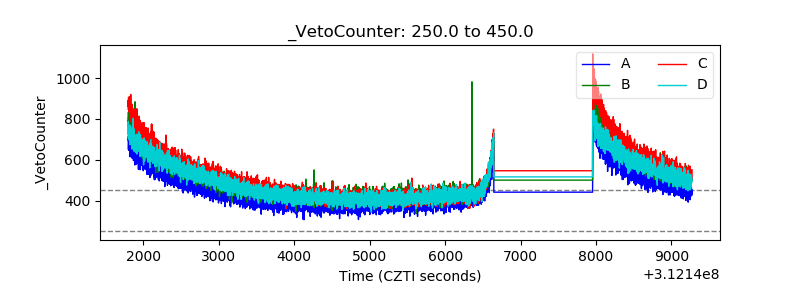 |