| Param | Original file | Final file |
|---|---|---|
| Filename | modeM0/AS1A07_056T01_9000003330_22450cztM0_level2.evt | modeM0/AS1A07_056T01_9000003330_22450cztM0_level2_quad_clean.evt |
| Size (bytes) | 481,435,200 | 132,966,720 |
| Size | 459.1 MB | 126.8 MB |
| Events in quadrant A | 3,047,799 | 905,102 |
| Events in quadrant B | 4,174,810 | 921,999 |
| Events in quadrant C | 3,294,551 | 902,766 |
| Events in quadrant D | 3,647,283 | 869,695 |
| Mode SS | |||
|---|---|---|---|
| Quadrant | BADHDUFLAG | Total packets | Discarded packets |
| A | 0 | 124 | 0 |
| B | 0 | 124 | 0 |
| C | 0 | 124 | 0 |
| D | 0 | 124 | 0 |
| Mode M9 | |||
|---|---|---|---|
| Quadrant | BADHDUFLAG | Total packets | Discarded packets |
| A | 0 | 14 | 0 |
| B | 0 | 15 | 0 |
| C | 0 | 15 | 0 |
| D | 0 | 15 | 0 |
| Mode M0 | |||
|---|---|---|---|
| Quadrant | BADHDUFLAG | Total packets | Discarded packets |
| A | 0 | 13047 | 2 |
| B | 0 | 16675 | 2 |
| C | 0 | 13790 | 2 |
| D | 0 | 14930 | 2 |
| Quadrant | Total seconds | Saturated seconds | Saturation percentage |
|---|---|---|---|
| A | 6129 | 30 | 0.489476% |
| B | 6129 | 202 | 3.295807% |
| C | 6129 | 104 | 1.696851% |
| D | 6129 | 122 | 1.990537% |
Noise dominated data is calculated using 1-second bins in cleaned event files. If a bin has >2000 counts, and if more than 50% of those come from <1% of pixels, then it is considered to be noise-dominated and hence unusable.
| Quadrant | # 1 sec bins | Bins with >0 counts | Bins with >2000 counts | High rate bins dominated by noise | Noise dominated (total time) | Noise dominated (detector-on time) | Marked lightcurve |
|---|---|---|---|---|---|---|---|
| A | 7504 | 6130 | 0 | 0 | 0.00% | 0.00% | 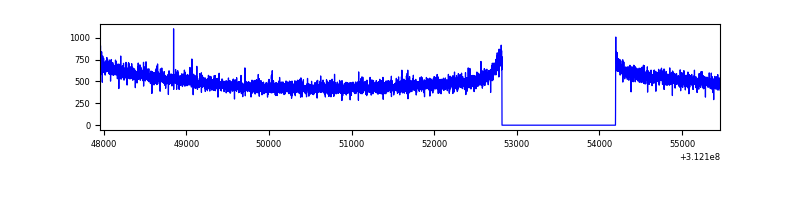 |
| B | 7504 | 6130 | 109 | 109 | 1.45% | 1.78% | 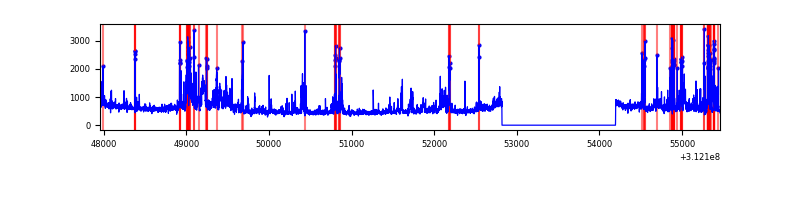 |
| C | 7504 | 6129 | 7 | 7 | 0.09% | 0.11% | 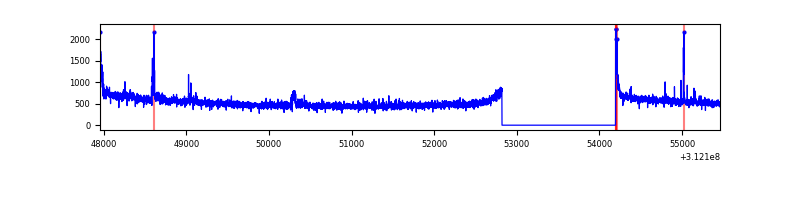 |
| D | 7504 | 6130 | 74 | 74 | 0.99% | 1.21% | 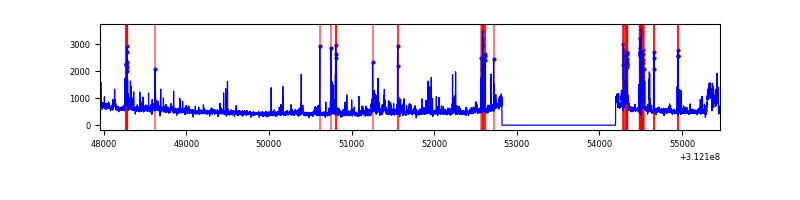 |
Top three noisy pixels from each quadrant. If the there are fewer than three noisy pixels in the level2.evt file, extra rows are filled as -1
| Pixel properties | Quadrant properties | ||||||
|---|---|---|---|---|---|---|---|
| Quadrant | DetID | PixID | Counts | Sigma | Mean | Median | Sigma |
| A | 3 | 1 | 15593 | 96.01 | 785 | 771 | 154.4 |
| A | 13 | 254 | 9791 | 58.43 | 785 | 771 | 154.4 |
| A | 15 | 174 | 6731 | 38.61 | 785 | 771 | 154.4 |
| B | 10 | 245 | 1047069 | 7255.45 | 787 | 770 | 144.2 |
| B | 0 | 197 | 17819 | 118.22 | 787 | 770 | 144.2 |
| B | 12 | 111 | 16460 | 108.8 | 787 | 770 | 144.2 |
| C | 14 | 238 | 121856 | 677.3 | 774 | 781 | 178.8 |
| C | 0 | 10 | 51812 | 285.47 | 774 | 781 | 178.8 |
| C | 3 | 9 | 40404 | 221.65 | 774 | 781 | 178.8 |
| D | 1 | 52 | 420770 | 2266.13 | 774 | 753 | 185.3 |
| D | 13 | 249 | 152196 | 817.09 | 774 | 753 | 185.3 |
| D | 2 | 120 | 76632 | 409.39 | 774 | 753 | 185.3 |
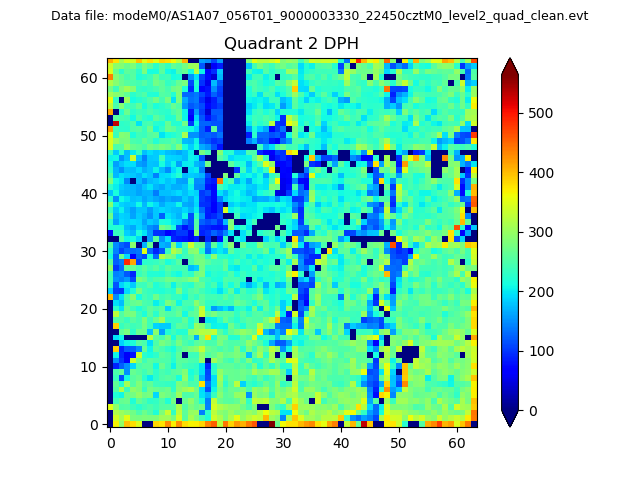
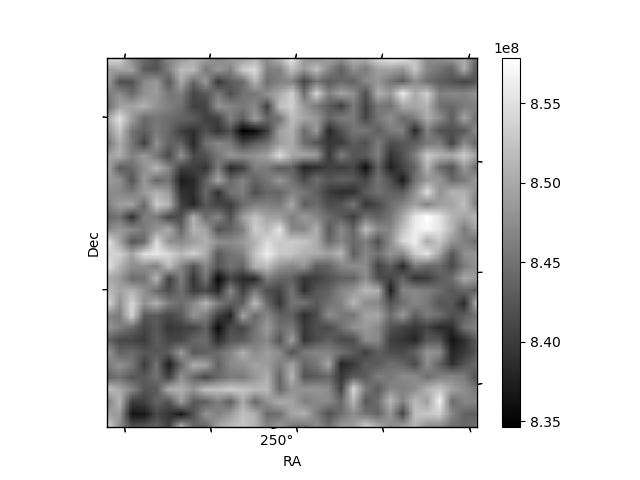
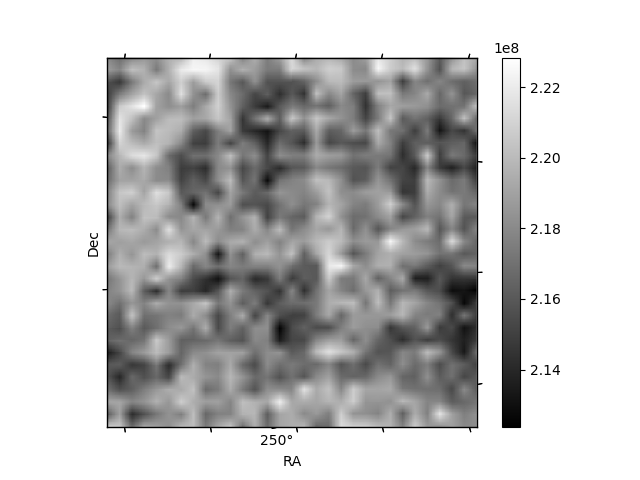
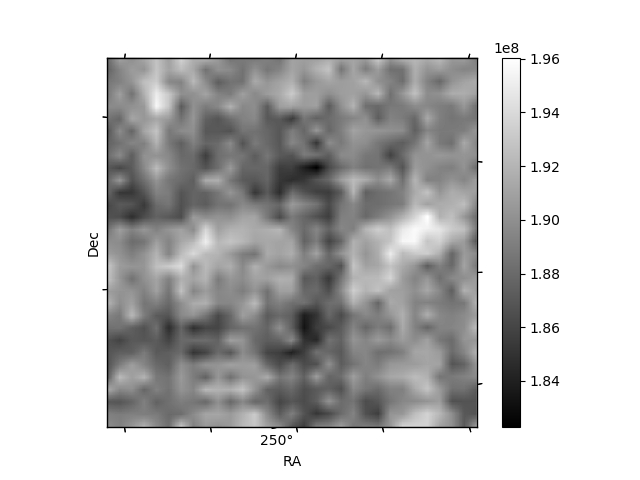
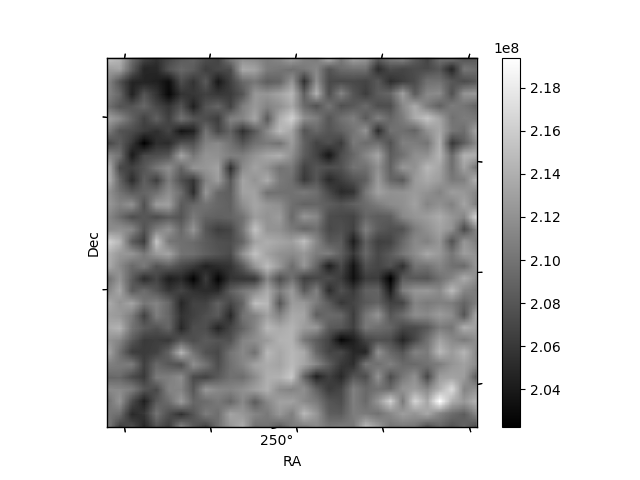
Histogram calculated using DETX and DETY for each event in the final _common_clean file
| Quadrant A | 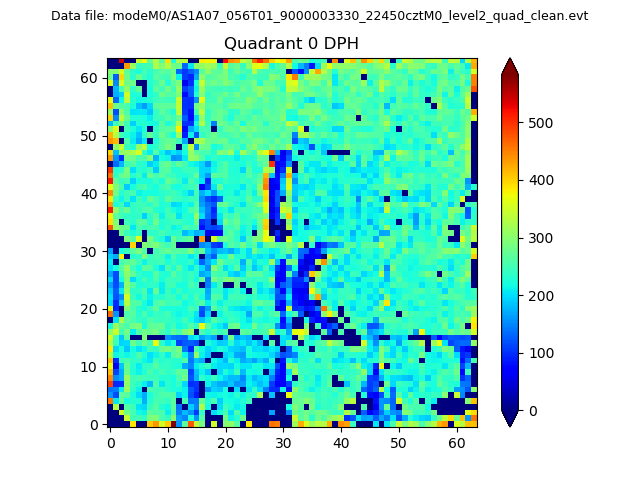 |
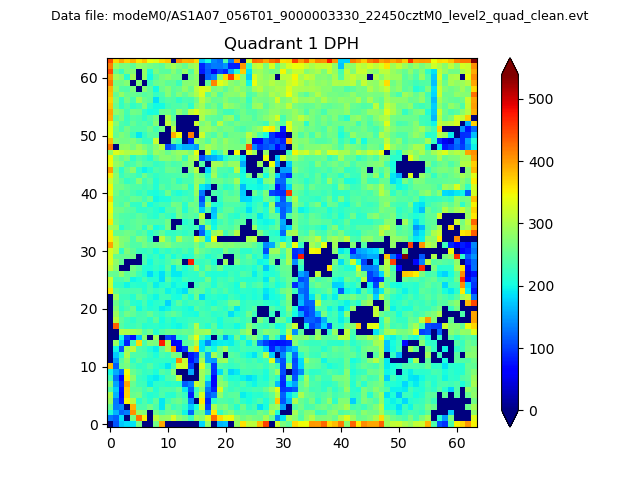 |
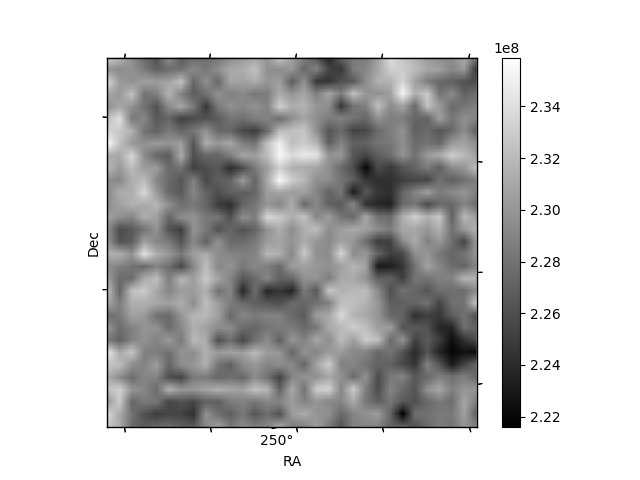
Quadrant B |
|---|---|---|---|
| Quadrant D | 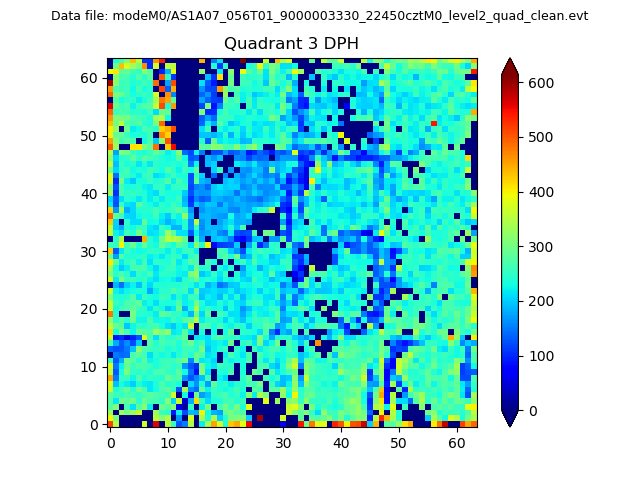 |
 |
Quadrant C |
| Plot type | Count rate plots | Images |
|---|---|---|
| Comparison with Poisson distribution Blue bars denote a histogram of data divided into 1 sec bins. Red curve is a Poisson curve with rate = median count rate of data. |
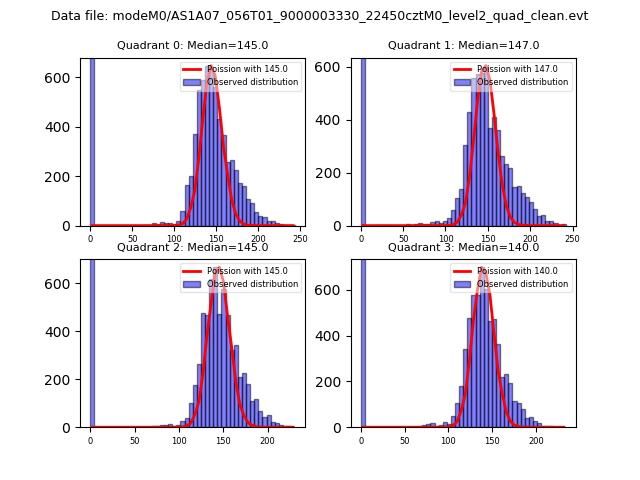 |
 |
| Quadrant-wise count rates Data is divided into 100 sec bins |
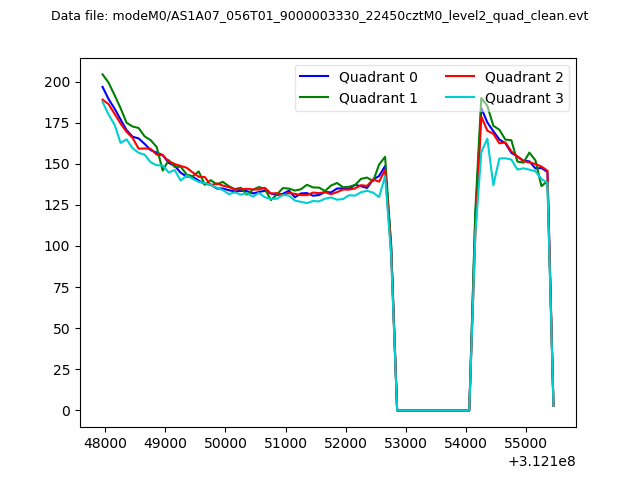 |
|
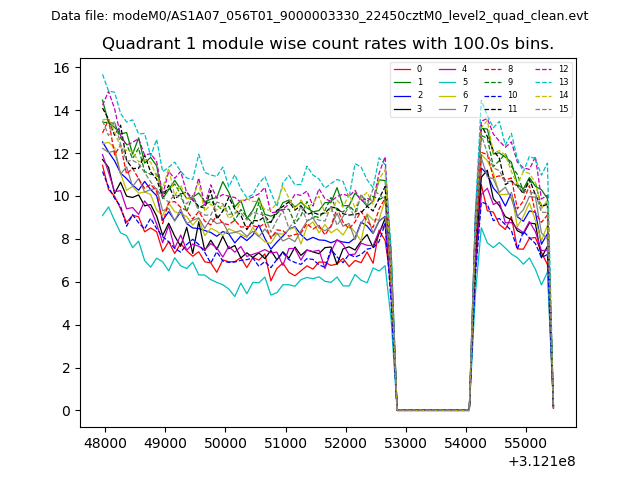
| Module-wise count rates for Quadrant A Data is divided into 100 sec bins |
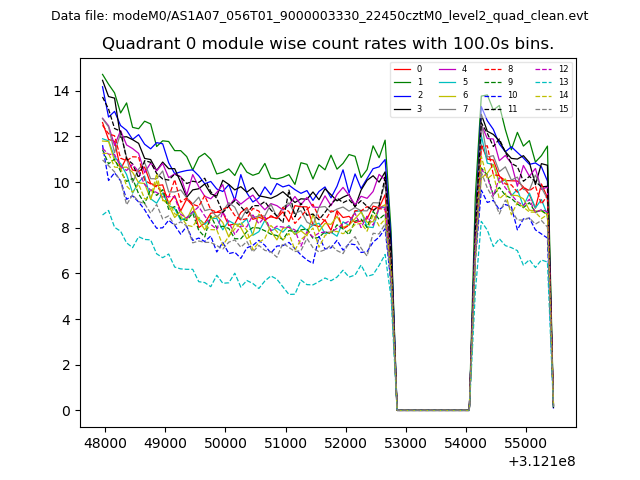 |
 |
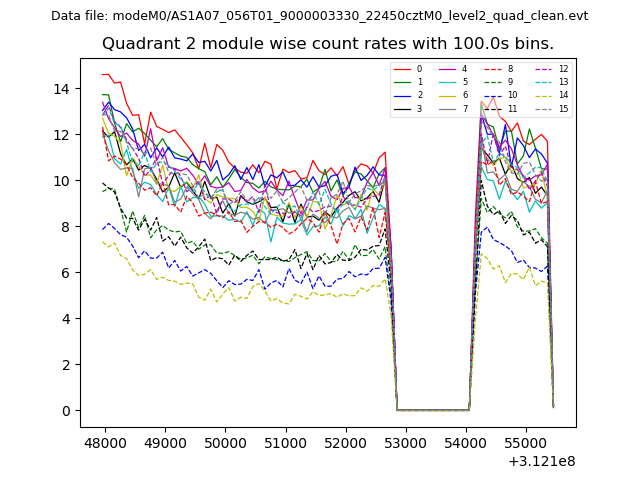
| Module-wise count rates for Quadrant B Data is divided into 100 sec bins |
 |
 |
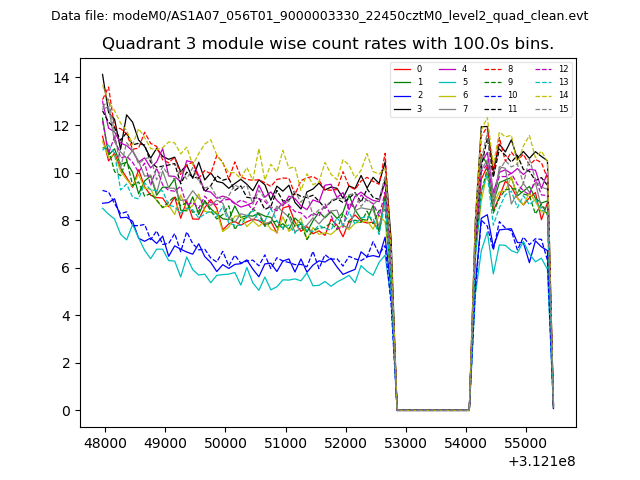
| Module-wise count rates for Quadrant C Data is divided into 100 sec bins |
 |
 |
| Module-wise count rates for Quadrant D Data is divided into 100 sec bins |
 |
 |
| Parameter | Plot |
|---|---|
| CZT HV Monitor | 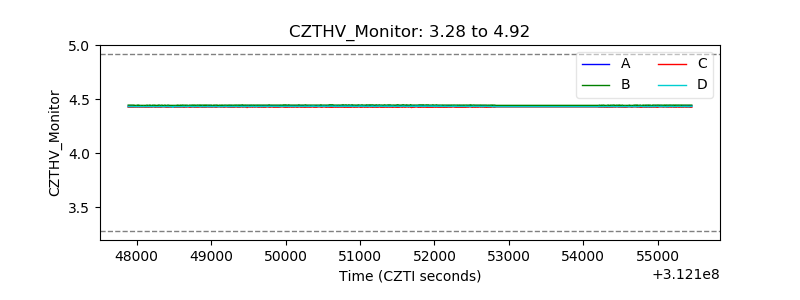 |
| D_VDD | 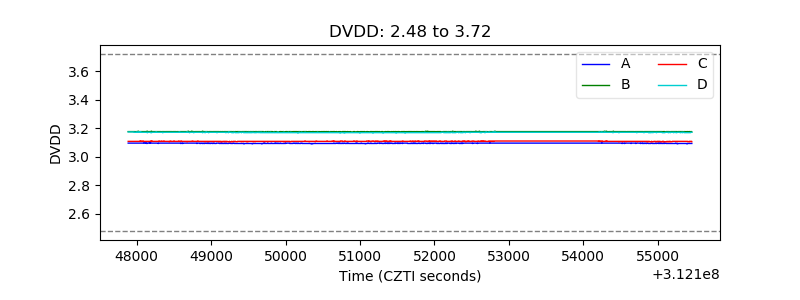 |
| Temperature 1 | 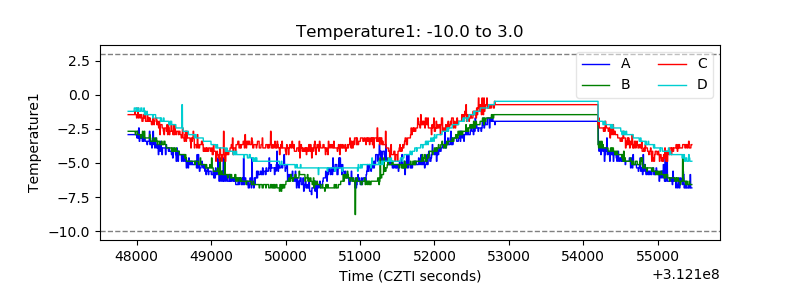 |
| Veto HV Monitor | 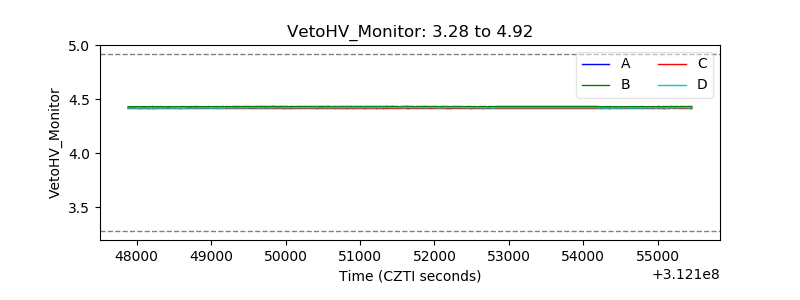 |
| Veto LLD | 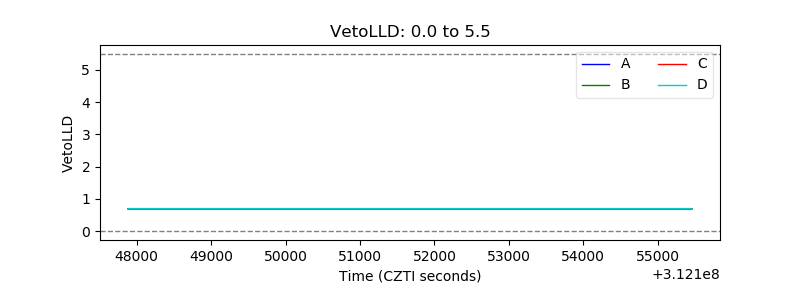 |
| Alpha Counter | 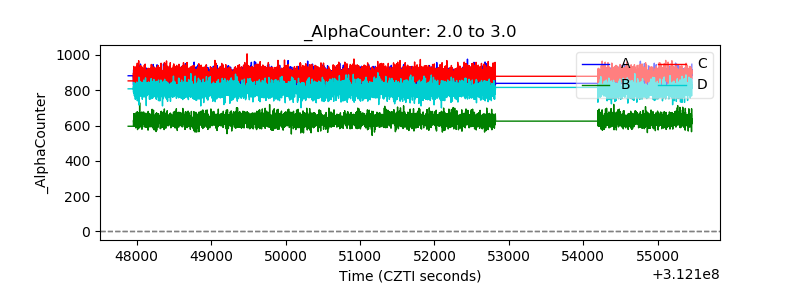 |
| _CPM_Rate | 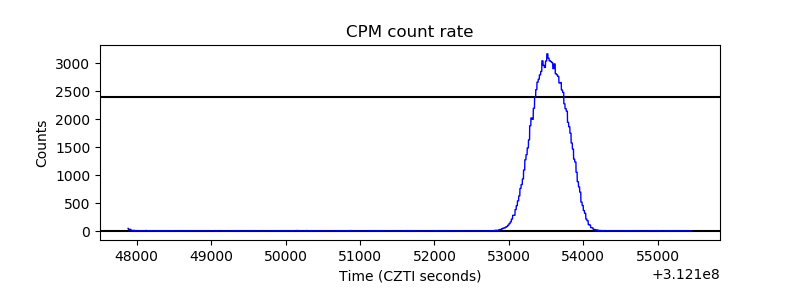 |
| CZT Counter | 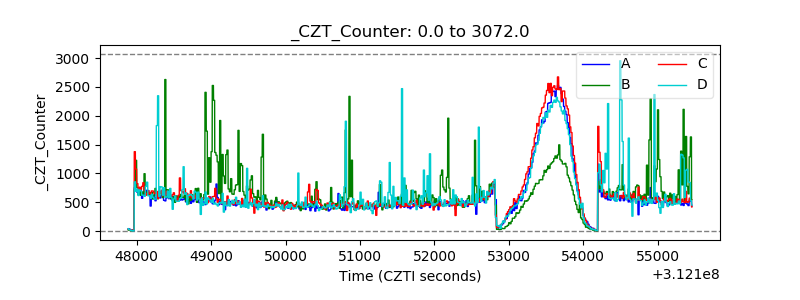 |
| +2.5 Volts monitor | 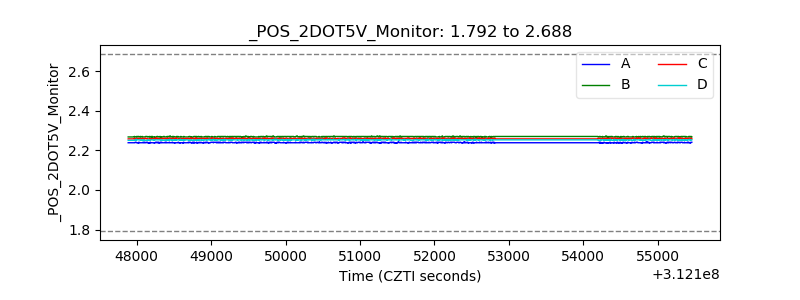 |
| +5 Volts monitor |  |
| _ROLL_ROT | 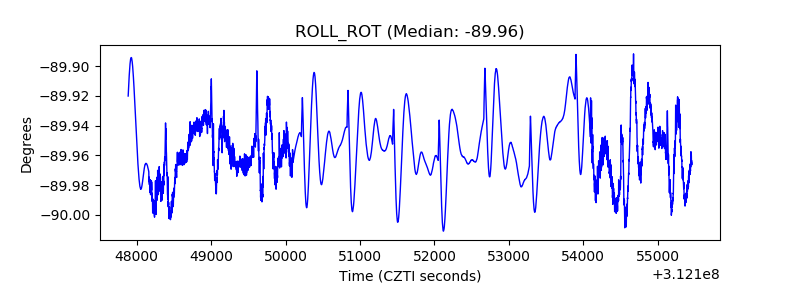 |
| _Roll_DEC | 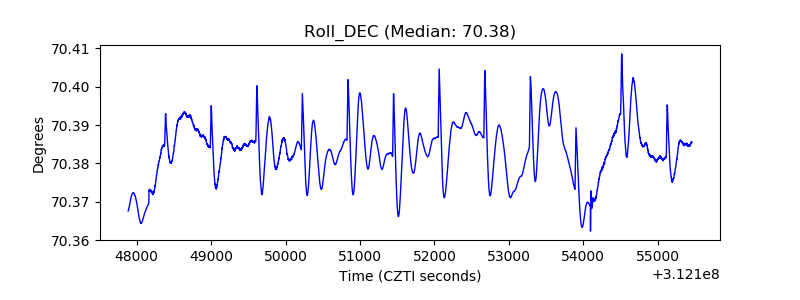 |
| _Roll_RA | 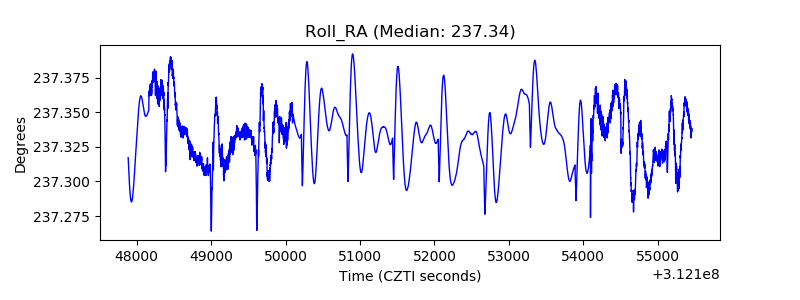 |
| Veto Counter | 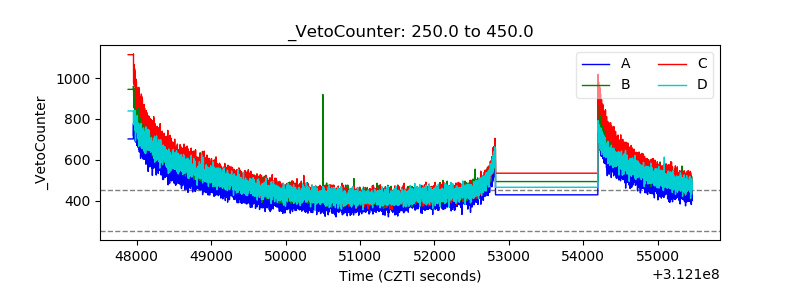 |