| Param | Original file | Final file |
|---|---|---|
| Filename | modeM0/AS1A07_056T01_9000003330_22451cztM0_level2.evt | modeM0/AS1A07_056T01_9000003330_22451cztM0_level2_quad_clean.evt |
| Size (bytes) | 482,353,920 | 135,020,160 |
| Size | 460.0 MB | 128.8 MB |
| Events in quadrant A | 3,126,543 | 919,721 |
| Events in quadrant B | 4,089,483 | 924,003 |
| Events in quadrant C | 3,332,989 | 914,798 |
| Events in quadrant D | 3,617,816 | 877,845 |
| Mode SS | |||
|---|---|---|---|
| Quadrant | BADHDUFLAG | Total packets | Discarded packets |
| A | 0 | 132 | 0 |
| B | 0 | 132 | 0 |
| C | 0 | 132 | 0 |
| D | 0 | 132 | 0 |
| Mode M9 | |||
|---|---|---|---|
| Quadrant | BADHDUFLAG | Total packets | Discarded packets |
| A | 0 | 25 | 0 |
| B | 0 | 26 | 0 |
| C | 0 | 26 | 0 |
| D | 0 | 26 | 0 |
| Mode M0 | |||
|---|---|---|---|
| Quadrant | BADHDUFLAG | Total packets | Discarded packets |
| A | 0 | 13534 | 2 |
| B | 0 | 16510 | 2 |
| C | 0 | 14057 | 2 |
| D | 0 | 15243 | 3 |
| Quadrant | Total seconds | Saturated seconds | Saturation percentage |
|---|---|---|---|
| A | 6494 | 59 | 0.908531% |
| B | 6494 | 320 | 4.927626% |
| C | 6494 | 134 | 2.063443% |
| D | 6493 | 211 | 3.249653% |
Noise dominated data is calculated using 1-second bins in cleaned event files. If a bin has >2000 counts, and if more than 50% of those come from <1% of pixels, then it is considered to be noise-dominated and hence unusable.
| Quadrant | # 1 sec bins | Bins with >0 counts | Bins with >2000 counts | High rate bins dominated by noise | Noise dominated (total time) | Noise dominated (detector-on time) | Marked lightcurve |
|---|---|---|---|---|---|---|---|
| A | 7809 | 6494 | 0 | 0 | 0.00% | 0.00% | 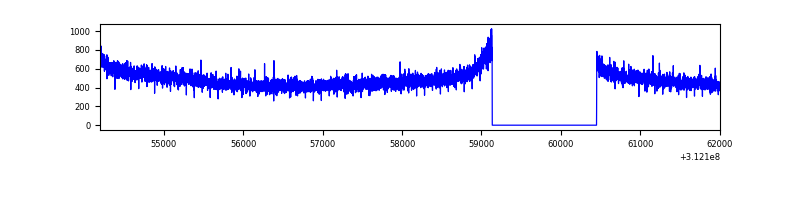 |
| B | 7809 | 6494 | 205 | 205 | 2.63% | 3.16% | 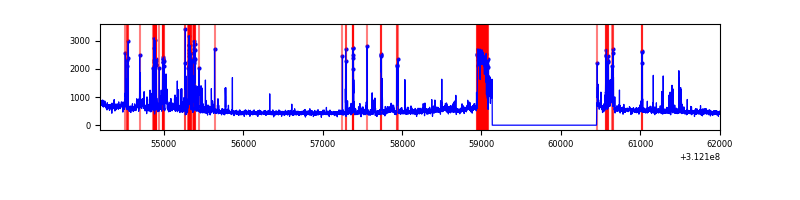 |
| C | 7809 | 6494 | 5 | 5 | 0.06% | 0.08% | 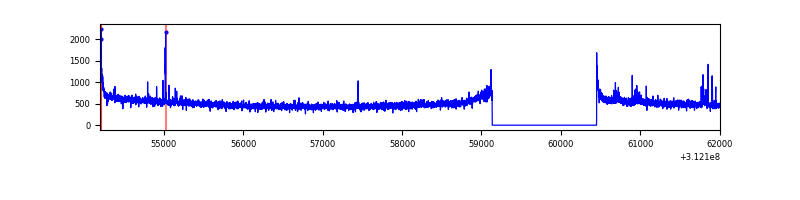 |
| D | 7808 | 6494 | 135 | 135 | 1.73% | 2.08% | 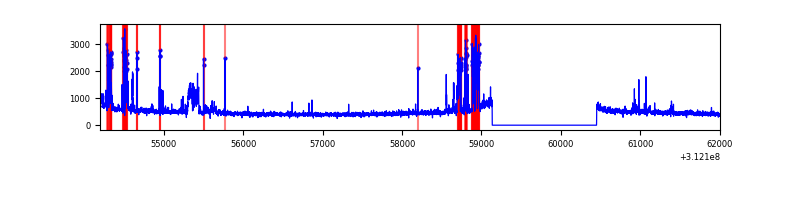 |
Top three noisy pixels from each quadrant. If the there are fewer than three noisy pixels in the level2.evt file, extra rows are filled as -1
| Pixel properties | Quadrant properties | ||||||
|---|---|---|---|---|---|---|---|
| Quadrant | DetID | PixID | Counts | Sigma | Mean | Median | Sigma |
| A | 3 | 1 | 10880 | 62.58 | 808 | 792 | 161.2 |
| A | 13 | 254 | 9650 | 54.95 | 808 | 792 | 161.2 |
| A | 0 | 226 | 6819 | 37.39 | 808 | 792 | 161.2 |
| B | 10 | 245 | 936753 | 6372.24 | 795 | 777 | 146.9 |
| B | 0 | 197 | 18882 | 123.26 | 795 | 777 | 146.9 |
| B | 12 | 111 | 17493 | 113.8 | 795 | 777 | 146.9 |
| C | 14 | 238 | 127032 | 688.51 | 791 | 797 | 183.3 |
| C | 0 | 10 | 42791 | 229.04 | 791 | 797 | 183.3 |
| C | 10 | 22 | 40636 | 217.29 | 791 | 797 | 183.3 |
| D | 1 | 52 | 412882 | 2214.2 | 785 | 765 | 186.1 |
| D | 13 | 249 | 107750 | 574.8 | 785 | 765 | 186.1 |
| D | 2 | 120 | 78211 | 416.1 | 785 | 765 | 186.1 |
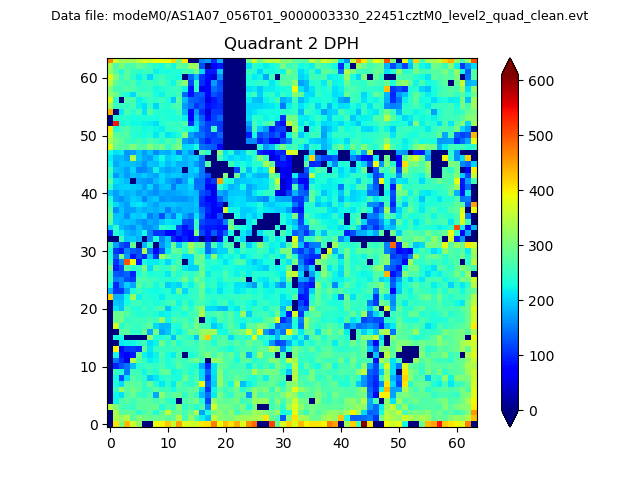
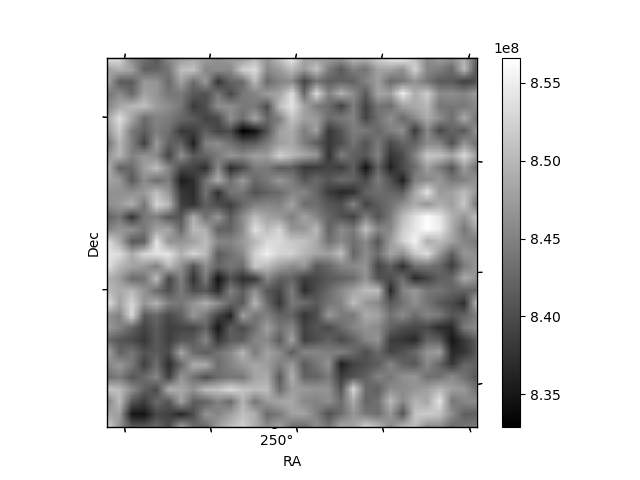
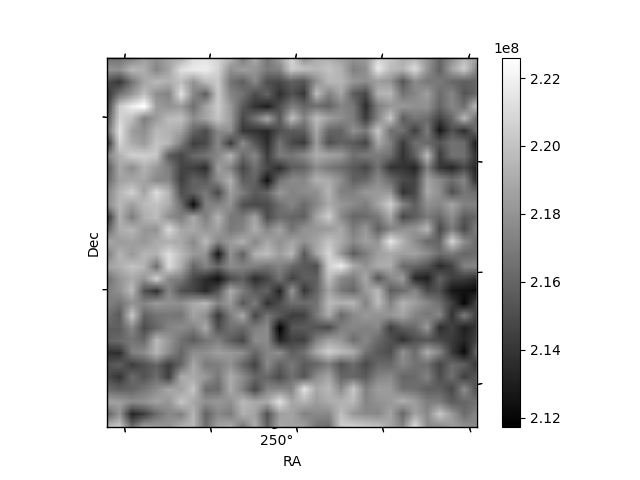
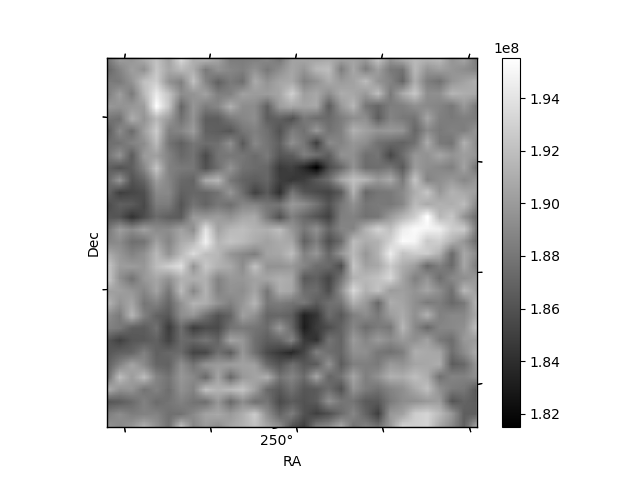
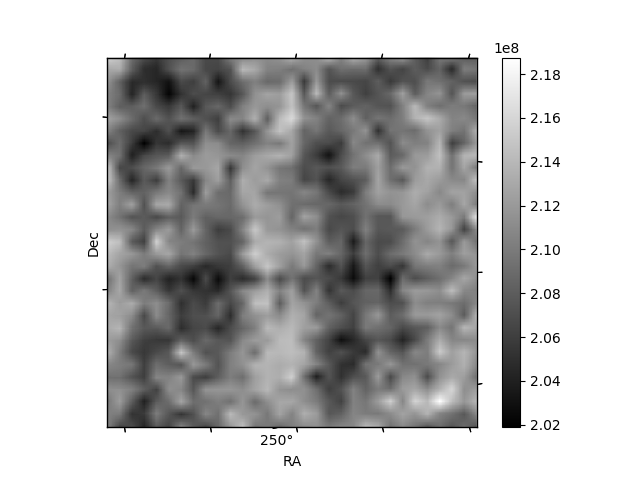
Histogram calculated using DETX and DETY for each event in the final _common_clean file
| Quadrant A | 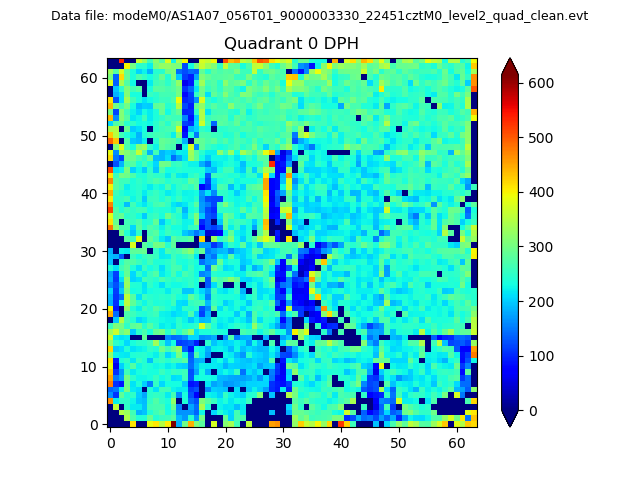 |
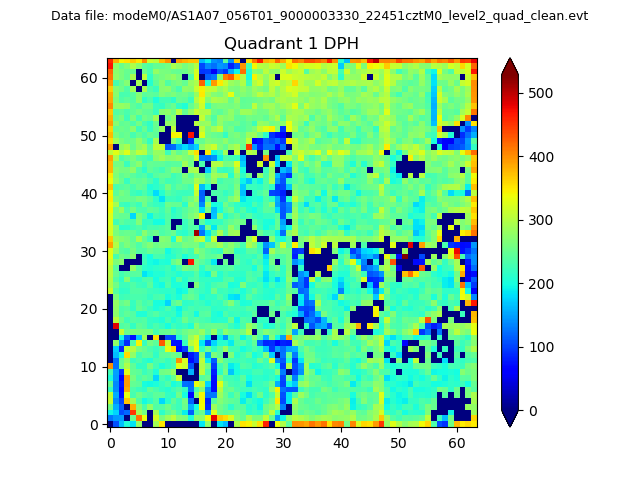 |
Quadrant B |
|---|---|---|---|
| Quadrant D | 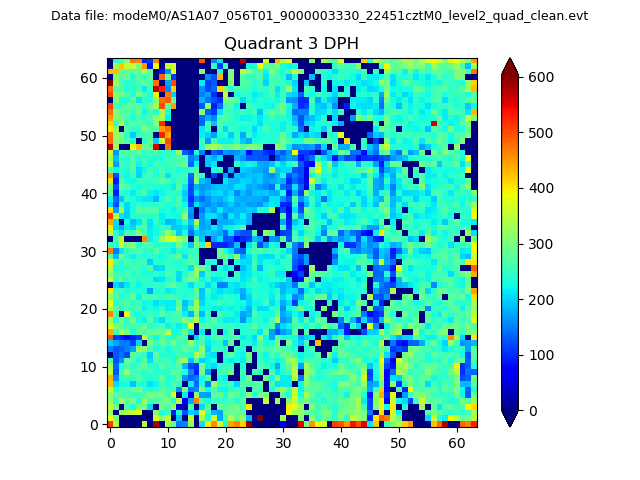 |
 |
Quadrant C |
| Plot type | Count rate plots | Images |
|---|---|---|
| Comparison with Poisson distribution Blue bars denote a histogram of data divided into 1 sec bins. Red curve is a Poisson curve with rate = median count rate of data. |
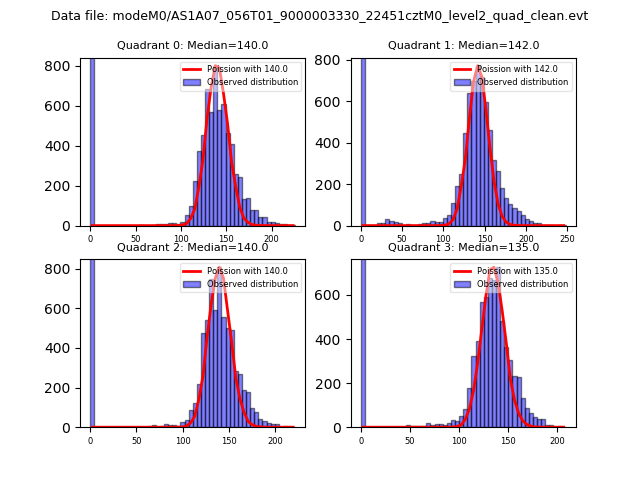 |
 |
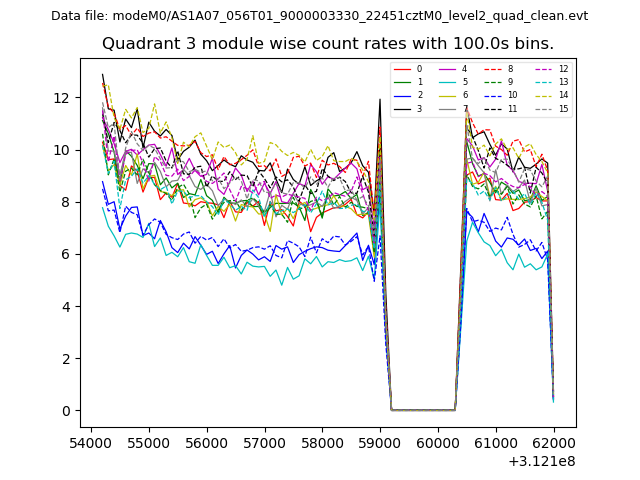
| Quadrant-wise count rates Data is divided into 100 sec bins |
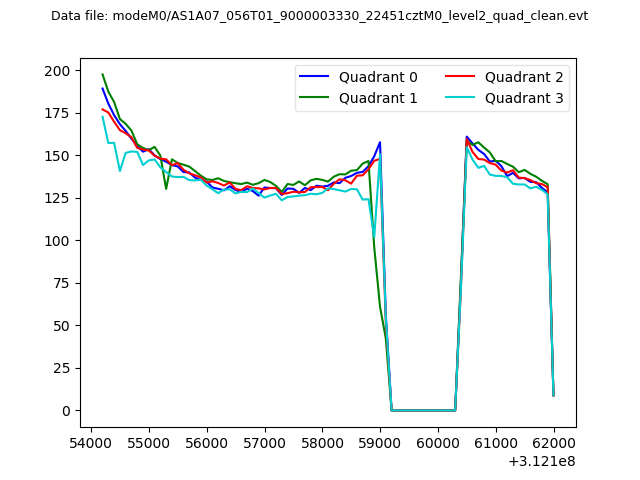 |
|
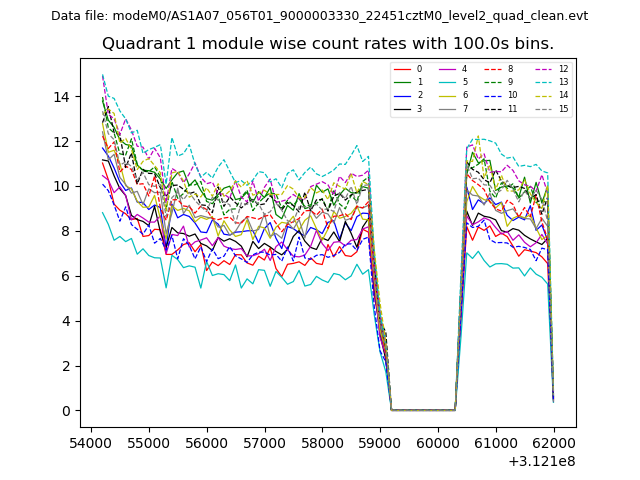
| Module-wise count rates for Quadrant A Data is divided into 100 sec bins |
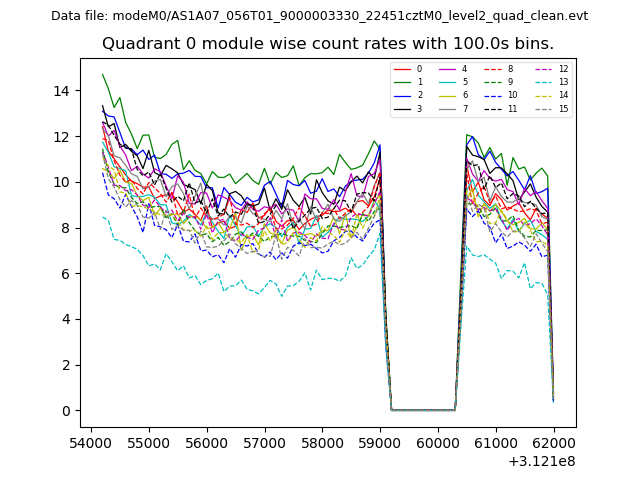 |
 |
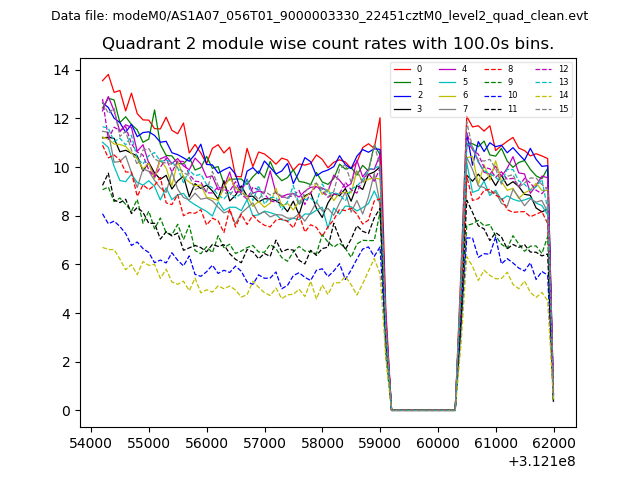
| Module-wise count rates for Quadrant B Data is divided into 100 sec bins |
 |
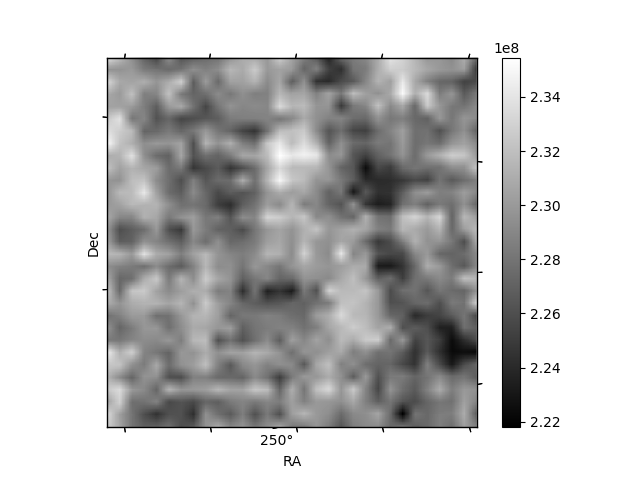 |
| Module-wise count rates for Quadrant C Data is divided into 100 sec bins |
 |
 |
| Module-wise count rates for Quadrant D Data is divided into 100 sec bins |
 |
 |
| Parameter | Plot |
|---|---|
| CZT HV Monitor | 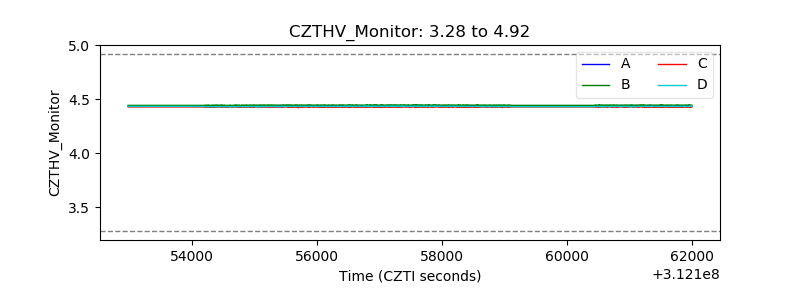 |
| D_VDD | 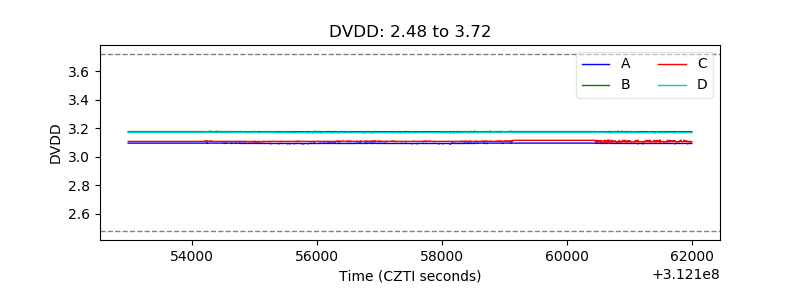 |
| Temperature 1 | 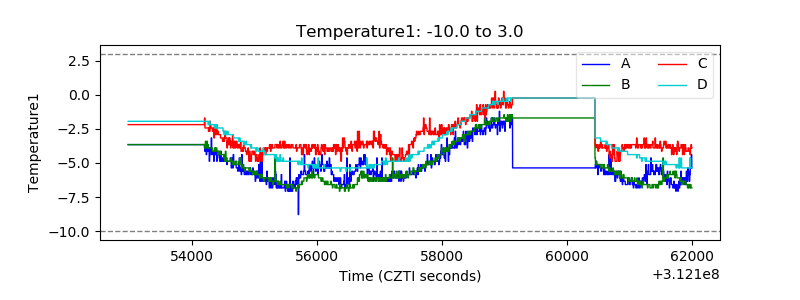 |
| Veto HV Monitor | 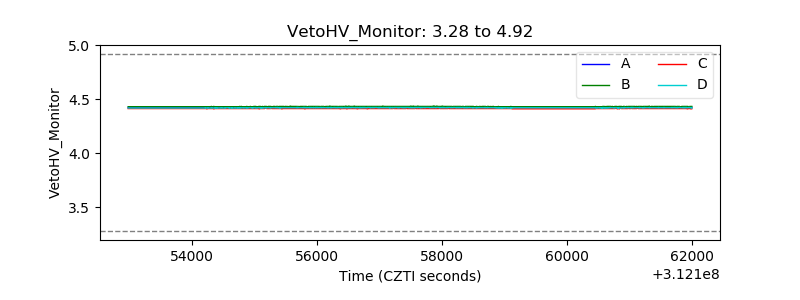 |
| Veto LLD | 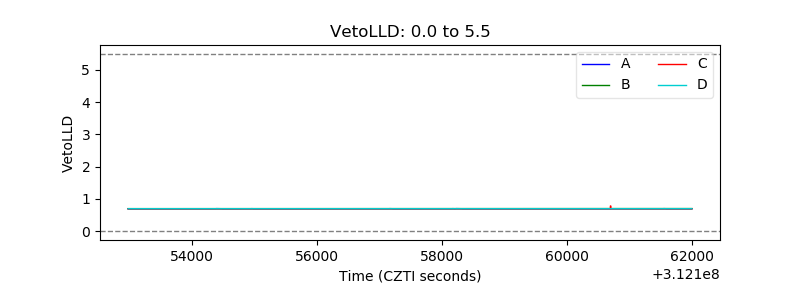 |
| Alpha Counter | 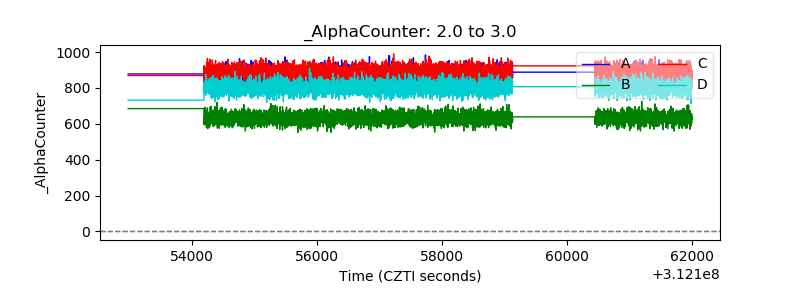 |
| _CPM_Rate | 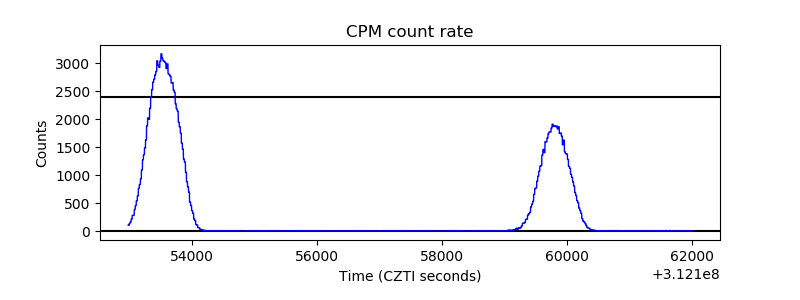 |
| CZT Counter | 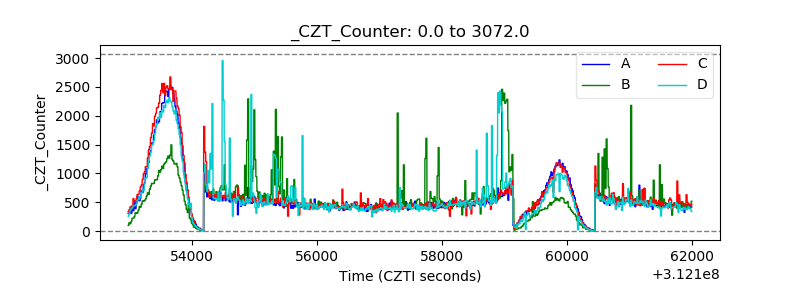 |
| +2.5 Volts monitor |  |
| +5 Volts monitor |  |
| _ROLL_ROT | 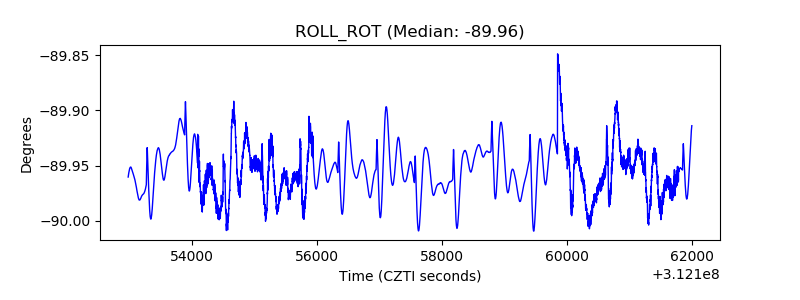 |
| _Roll_DEC |  |
| _Roll_RA |  |
| Veto Counter | 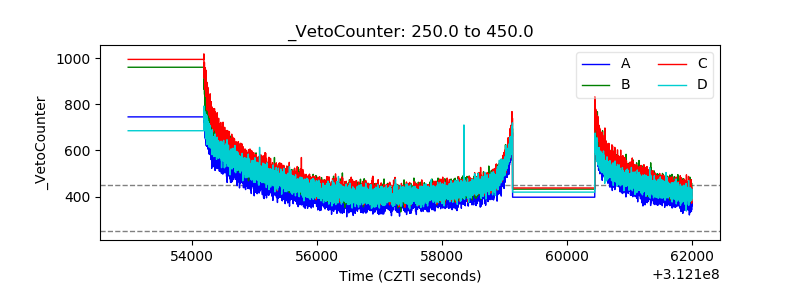 |