| Param | Original file | Final file |
|---|---|---|
| Filename | modeM0/AS1A07_056T01_9000003330_22453cztM0_level2.evt | modeM0/AS1A07_056T01_9000003330_22453cztM0_level2_quad_clean.evt |
| Size (bytes) | 471,890,880 | 132,503,040 |
| Size | 450.0 MB | 126.4 MB |
| Events in quadrant A | 3,250,464 | 892,975 |
| Events in quadrant B | 4,083,159 | 898,966 |
| Events in quadrant C | 3,284,314 | 876,102 |
| Events in quadrant D | 3,198,545 | 858,643 |
| Mode SS | |||
|---|---|---|---|
| Quadrant | BADHDUFLAG | Total packets | Discarded packets |
| A | 0 | 142 | 0 |
| B | 0 | 142 | 0 |
| C | 0 | 142 | 0 |
| D | 0 | 142 | 0 |
| Mode M9 | |||
|---|---|---|---|
| Quadrant | BADHDUFLAG | Total packets | Discarded packets |
| A | 0 | 11 | 0 |
| B | 0 | 12 | 0 |
| C | 0 | 12 | 0 |
| D | 0 | 12 | 0 |
| Mode M0 | |||
|---|---|---|---|
| Quadrant | BADHDUFLAG | Total packets | Discarded packets |
| A | 0 | 14365 | 2 |
| B | 0 | 17003 | 2 |
| C | 0 | 14377 | 2 |
| D | 0 | 14669 | 2 |
| Quadrant | Total seconds | Saturated seconds | Saturation percentage |
|---|---|---|---|
| A | 6985 | 12 | 0.171797% |
| B | 6985 | 249 | 3.564782% |
| C | 6985 | 79 | 1.130995% |
| D | 6985 | 26 | 0.372226% |
Noise dominated data is calculated using 1-second bins in cleaned event files. If a bin has >2000 counts, and if more than 50% of those come from <1% of pixels, then it is considered to be noise-dominated and hence unusable.
| Quadrant | # 1 sec bins | Bins with >0 counts | Bins with >2000 counts | High rate bins dominated by noise | Noise dominated (total time) | Noise dominated (detector-on time) | Marked lightcurve |
|---|---|---|---|---|---|---|---|
| A | 7730 | 6986 | 0 | 0 | 0.00% | 0.00% | 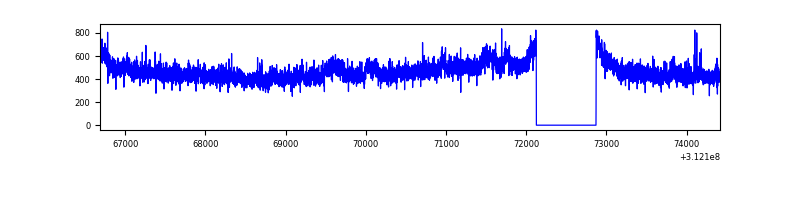 |
| B | 7730 | 6986 | 136 | 136 | 1.76% | 1.95% | 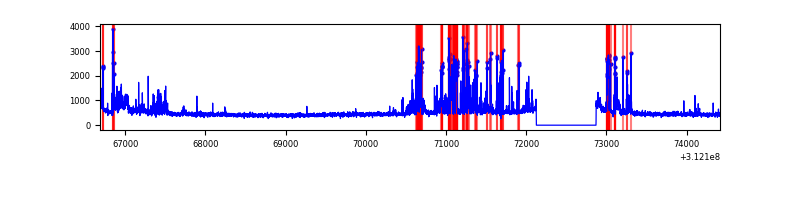 |
| C | 7730 | 6986 | 0 | 0 | 0.00% | 0.00% | 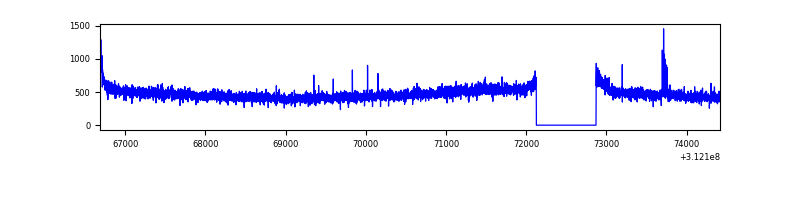 |
| D | 7730 | 6986 | 15 | 15 | 0.19% | 0.21% | 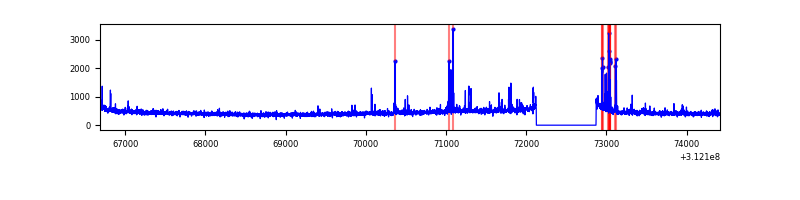 |
Top three noisy pixels from each quadrant. If the there are fewer than three noisy pixels in the level2.evt file, extra rows are filled as -1
| Pixel properties | Quadrant properties | ||||||
|---|---|---|---|---|---|---|---|
| Quadrant | DetID | PixID | Counts | Sigma | Mean | Median | Sigma |
| A | 6 | 240 | 101397 | 614.81 | 815 | 797 | 163.6 |
| A | 13 | 254 | 10405 | 58.72 | 815 | 797 | 163.6 |
| A | 3 | 137 | 7089 | 38.45 | 815 | 797 | 163.6 |
| B | 10 | 245 | 877683 | 5719.91 | 810 | 788 | 153.3 |
| B | 12 | 111 | 18653 | 116.53 | 810 | 788 | 153.3 |
| B | 11 | 111 | 16650 | 103.47 | 810 | 788 | 153.3 |
| C | 14 | 238 | 125734 | 682.46 | 789 | 794 | 183.1 |
| C | 3 | 9 | 52289 | 281.28 | 789 | 794 | 183.1 |
| C | 10 | 22 | 19484 | 102.09 | 789 | 794 | 183.1 |
| D | 1 | 52 | 63617 | 324.99 | 796 | 772 | 193.4 |
| D | 5 | 32 | 61674 | 314.94 | 796 | 772 | 193.4 |
| D | 2 | 136 | 40732 | 206.64 | 796 | 772 | 193.4 |
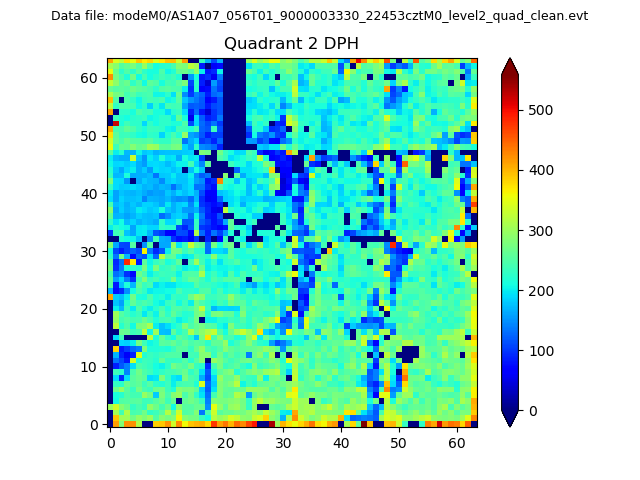
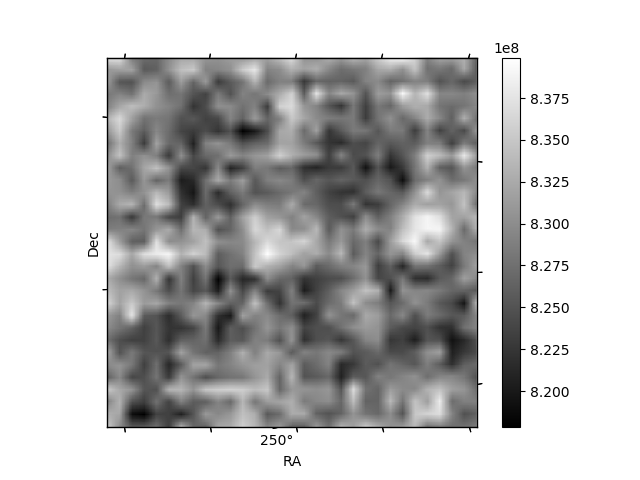
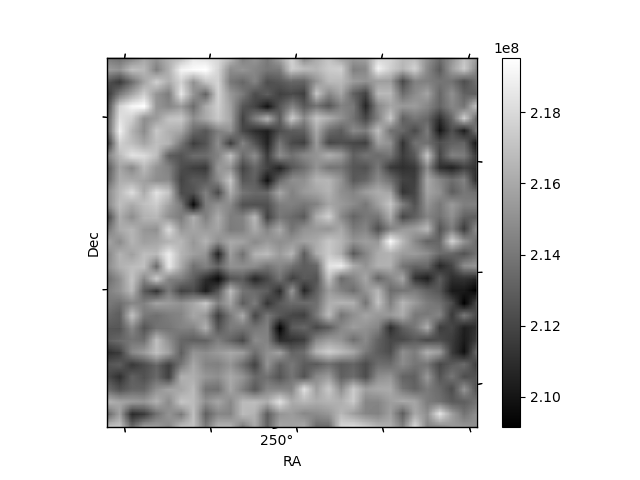
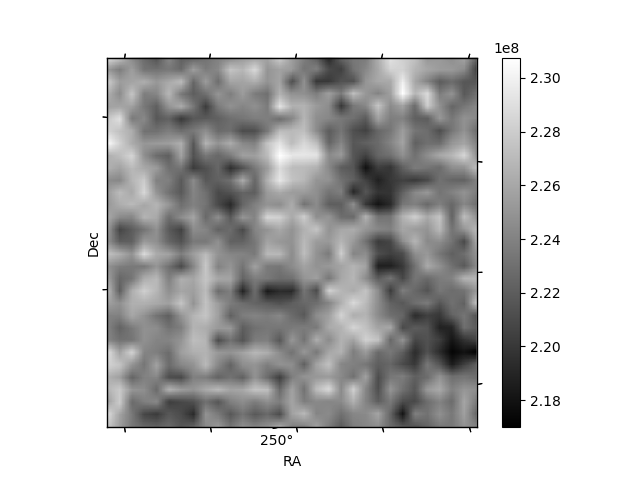
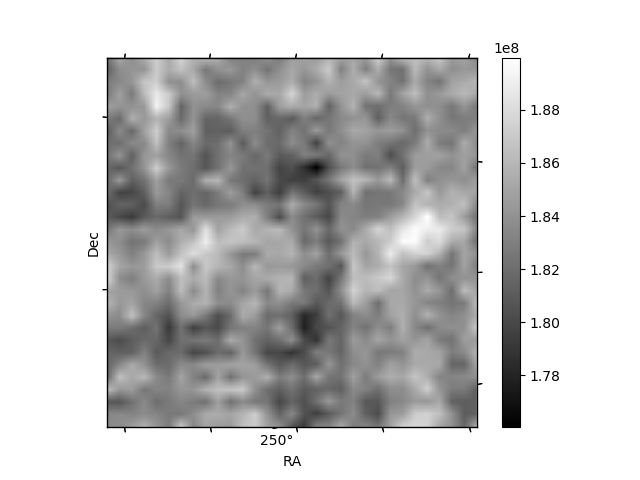
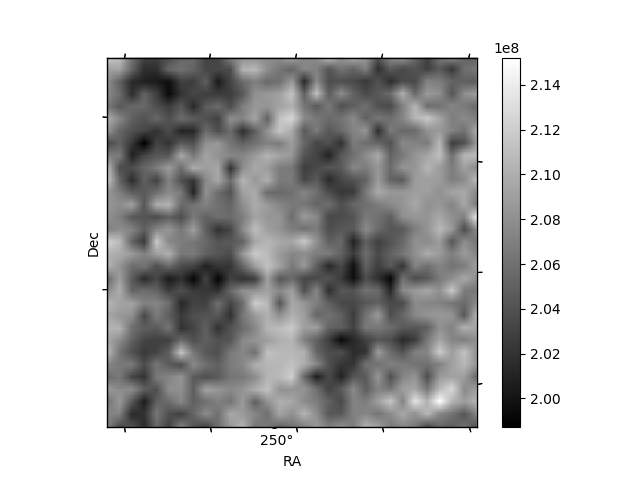
Histogram calculated using DETX and DETY for each event in the final _common_clean file
| Quadrant A | 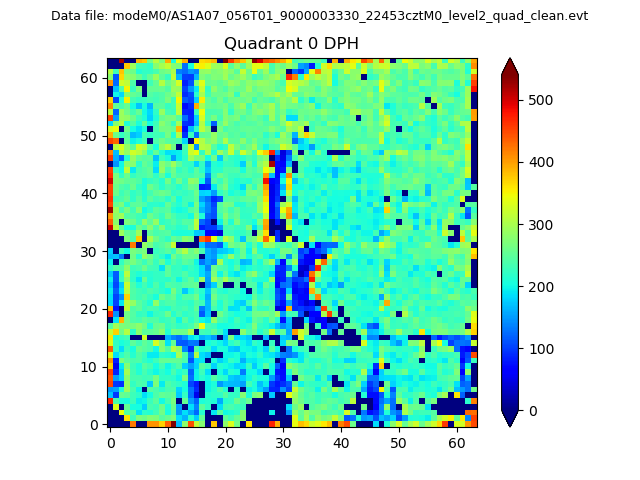 |
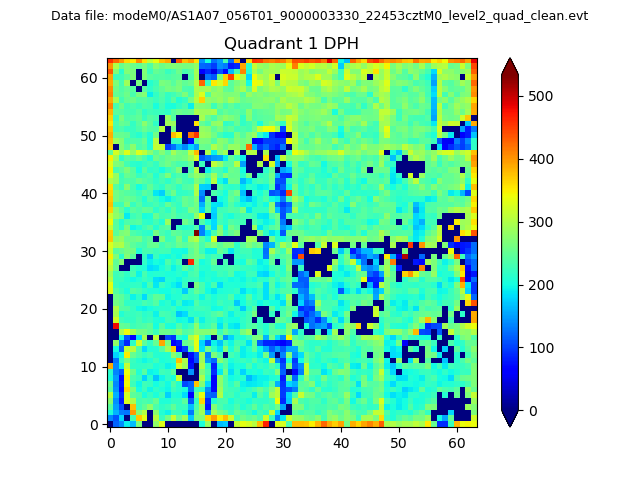 |
Quadrant B |
|---|---|---|---|
| Quadrant D | 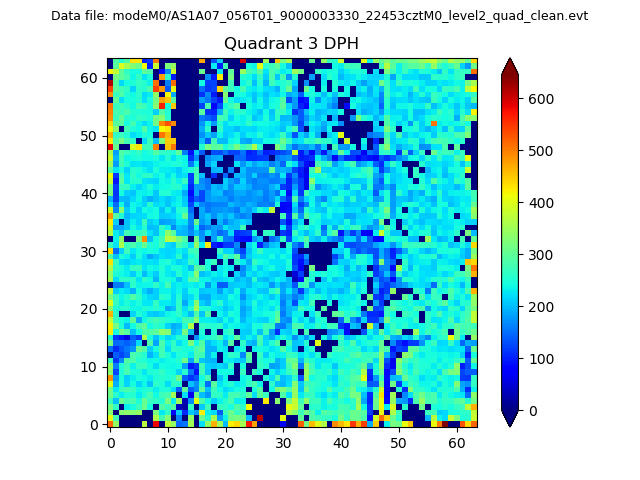 |
 |
Quadrant C |
| Plot type | Count rate plots | Images |
|---|---|---|
| Comparison with Poisson distribution Blue bars denote a histogram of data divided into 1 sec bins. Red curve is a Poisson curve with rate = median count rate of data. |
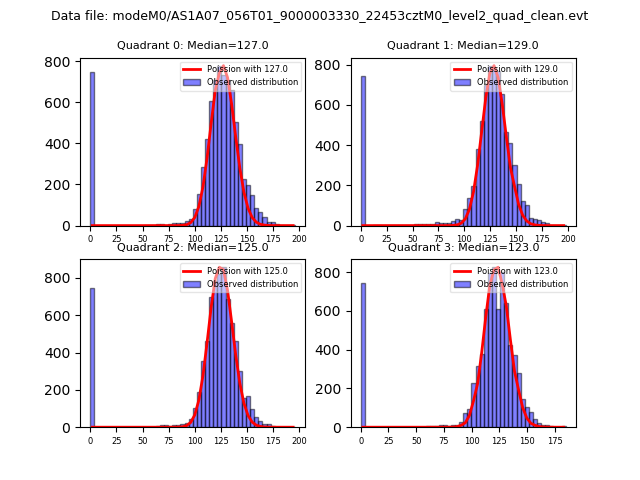 |
 |
| Quadrant-wise count rates Data is divided into 100 sec bins |
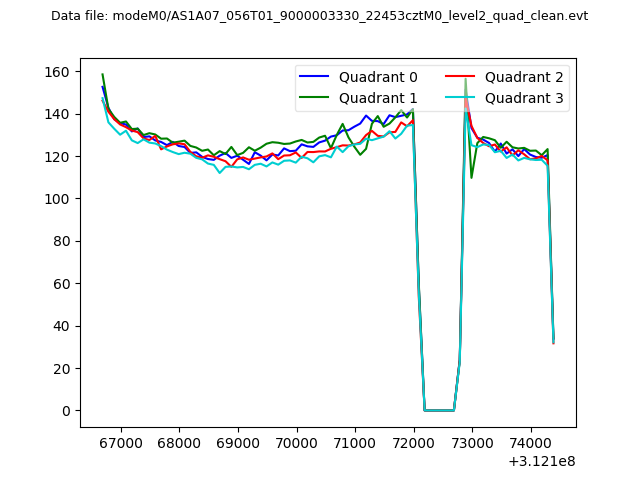 |
|
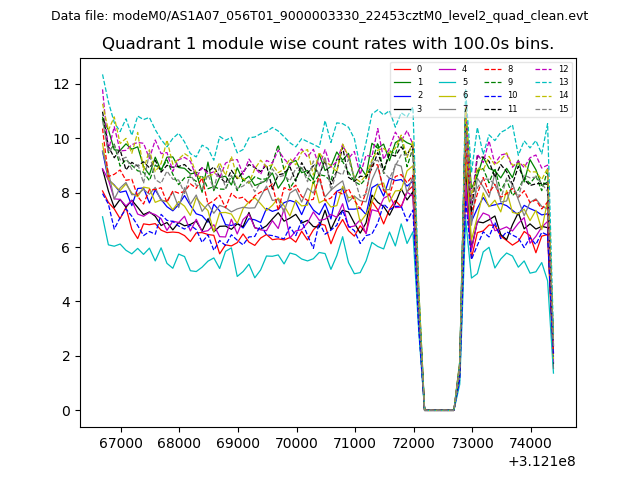
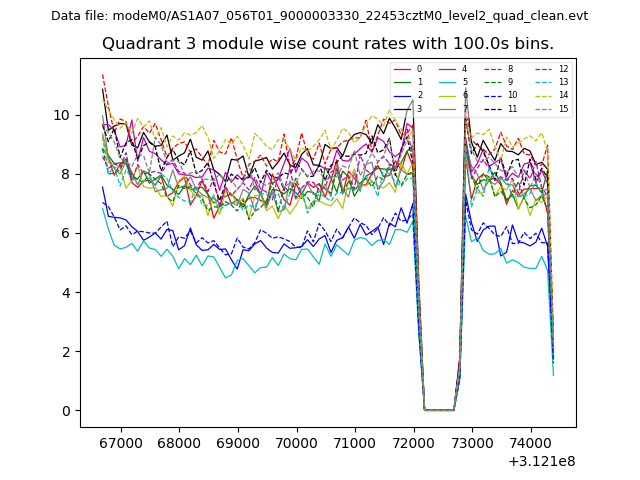
| Module-wise count rates for Quadrant A Data is divided into 100 sec bins |
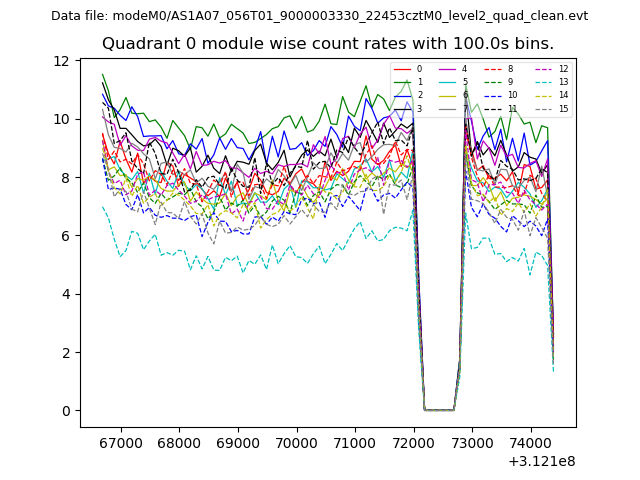 |
 |
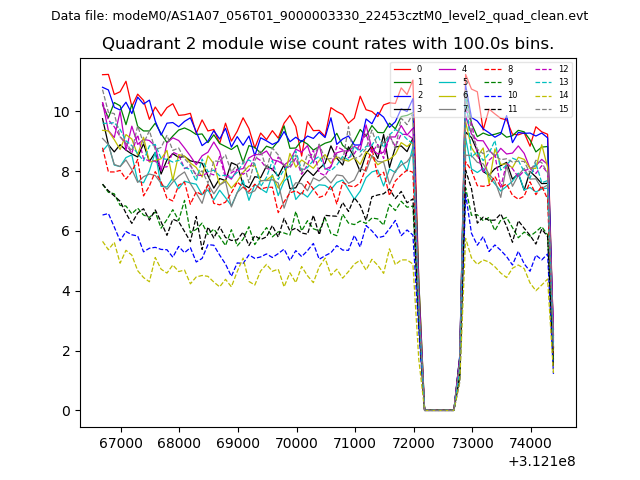
| Module-wise count rates for Quadrant B Data is divided into 100 sec bins |
 |
 |
| Module-wise count rates for Quadrant C Data is divided into 100 sec bins |
 |
 |
| Module-wise count rates for Quadrant D Data is divided into 100 sec bins |
 |
 |
| Parameter | Plot |
|---|---|
| CZT HV Monitor | 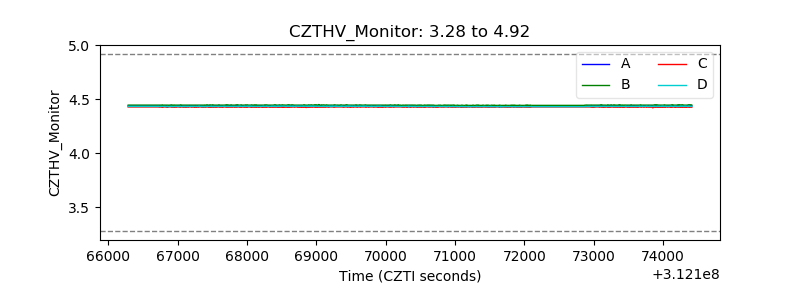 |
| D_VDD | 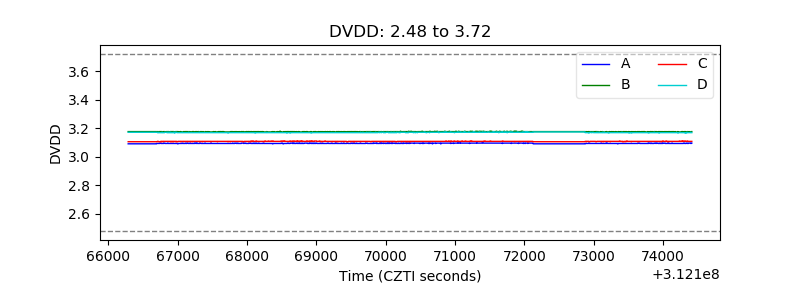 |
| Temperature 1 | 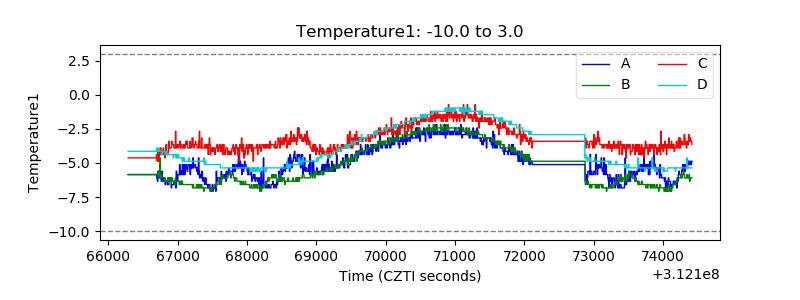 |
| Veto HV Monitor | 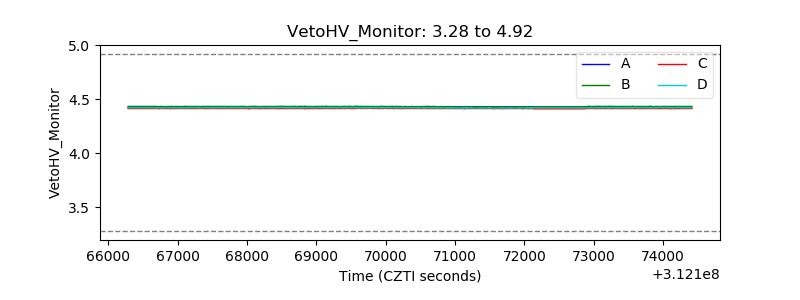 |
| Veto LLD | 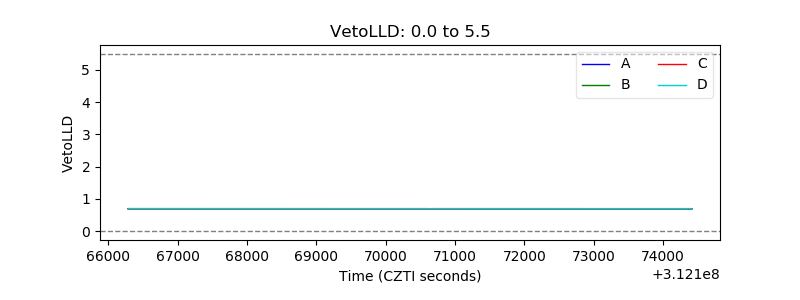 |
| Alpha Counter | 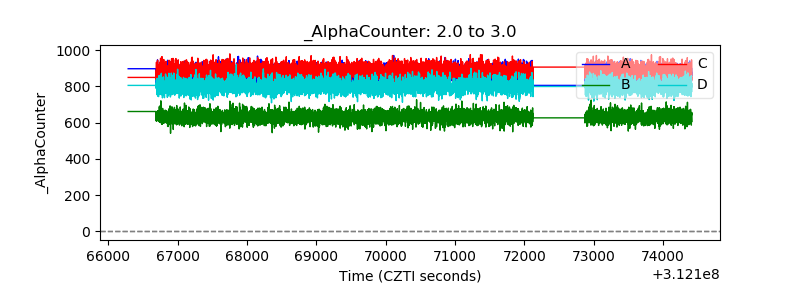 |
| _CPM_Rate | 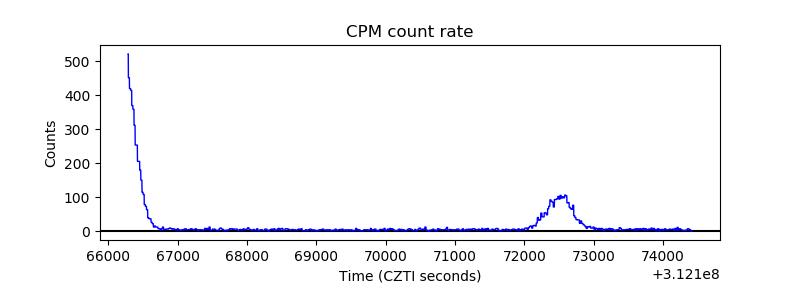 |
| CZT Counter | 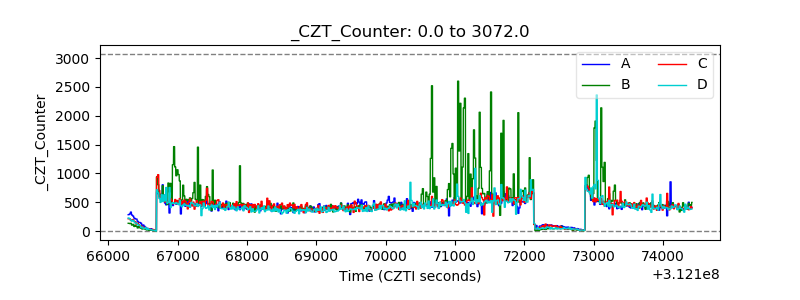 |
| +2.5 Volts monitor |  |
| +5 Volts monitor |  |
| _ROLL_ROT | 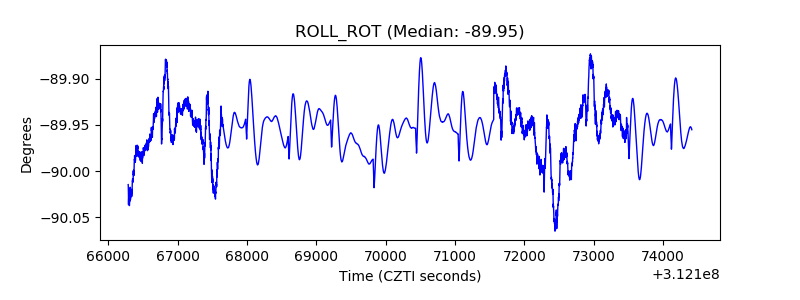 |
| _Roll_DEC |  |
| _Roll_RA | 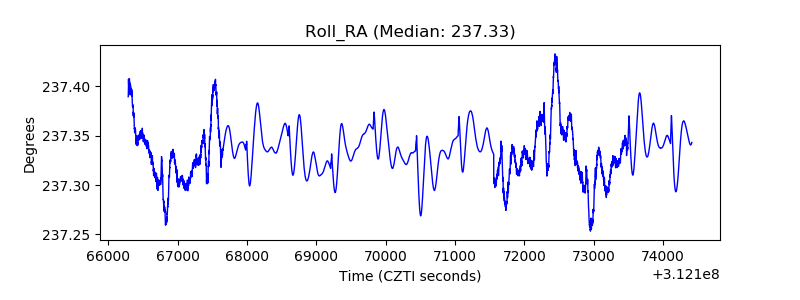 |
| Veto Counter | 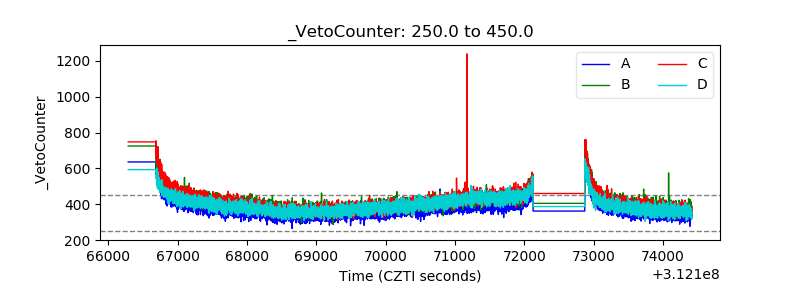 |