| Param | Original file | Final file |
|---|---|---|
| Filename | modeM0/AS1T03_149T05_9000003324cztM0_level2.fits | modeM0/AS1T03_149T05_9000003324cztM0_level2_quad_clean.evt |
| Size (bytes) | 81,616,320 | 67,625,280 |
| Size | 77.8 MB | 64.5 MB |
| Events in quadrant A | 496,806 | 384,224 |
| Events in quadrant B | 481,358 | 387,630 |
| Events in quadrant C | 489,476 | 364,005 |
| Events in quadrant D | 430,448 | 337,295 |
| Mode SS | |||
|---|---|---|---|
| Quadrant | BADHDUFLAG | Total packets | Discarded packets |
| A | 0 | 168 | 0 |
| B | 0 | 168 | 0 |
| C | 0 | 168 | 0 |
| D | 0 | 168 | 0 |
| Mode M9 | |||
|---|---|---|---|
| Quadrant | BADHDUFLAG | Total packets | Discarded packets |
| A | 0 | 20 | 0 |
| B | 0 | 20 | 0 |
| C | 0 | 20 | 0 |
| D | 0 | 20 | 0 |
| Mode M0 | |||
|---|---|---|---|
| Quadrant | BADHDUFLAG | Total packets | Discarded packets |
| A | 0 | 17065 | 0 |
| B | 0 | 17688 | 0 |
| C | 0 | 17103 | 0 |
| D | 0 | 17253 | 0 |
| Quadrant | Total seconds | Saturated seconds | Saturation percentage |
|---|---|---|---|
| A | 8267 | 34 | 0.411274% |
| B | 8267 | 60 | 0.725777% |
| C | 8267 | 123 | 1.487843% |
| D | 8267 | 31 | 0.374985% |
Noise dominated data is calculated using 1-second bins in cleaned event files. If a bin has >2000 counts, and if more than 50% of those come from <1% of pixels, then it is considered to be noise-dominated and hence unusable.
| Quadrant | # 1 sec bins | Bins with >0 counts | Bins with >2000 counts | High rate bins dominated by noise | Noise dominated (total time) | Noise dominated (detector-on time) | Marked lightcurve |
|---|---|---|---|---|---|---|---|
| A | 13852 | 8268 | 0 | 0 | 0.00% | 0.00% |  |
| B | 13852 | 8268 | 0 | 0 | 0.00% | 0.00% |  |
| C | 13852 | 8267 | 0 | 0 | 0.00% | 0.00% |  |
| D | 13852 | 8268 | 0 | 0 | 0.00% | 0.00% |  |
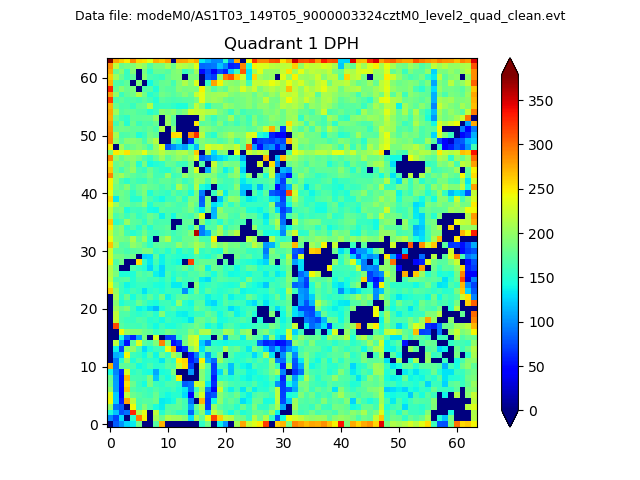
Top three noisy pixels from each quadrant. If the there are fewer than three noisy pixels in the level2.evt file, extra rows are filled as -1
| Pixel properties | Quadrant properties | ||||||
|---|---|---|---|---|---|---|---|
| Quadrant | DetID | PixID | Counts | Sigma | Mean | Median | Sigma |
| A | 0 | 29 | 439 | 9.35 | 129 | 121 | 34.0 |
| A | 7 | 110 | 395 | 8.05 | 129 | 121 | 34.0 |
| A | 9 | 19 | 394 | 8.02 | 129 | 121 | 34.0 |
| B | 2 | 9 | 357 | 8.48 | 127 | 121 | 27.8 |
| B | 5 | 232 | 349 | 8.19 | 127 | 121 | 27.8 |
| B | 5 | 128 | 334 | 7.65 | 127 | 121 | 27.8 |
| C | 1 | 81 | 383 | 7.66 | 129 | 121 | 34.2 |
| C | 1 | 80 | 376 | 7.46 | 129 | 121 | 34.2 |
| C | 3 | 158 | 364 | 7.1 | 129 | 121 | 34.2 |
| D | 6 | 67 | 348 | 6.88 | 122 | 112 | 34.3 |
| D | 3 | 14 | 319 | 6.04 | 122 | 112 | 34.3 |
| D | 1 | 31 | 305 | 5.63 | 122 | 112 | 34.3 |
Histogram calculated using DETX and DETY for each event in the final _common_clean file
| Quadrant A |  |
 |
Quadrant B |
|---|---|---|---|
| Quadrant D | 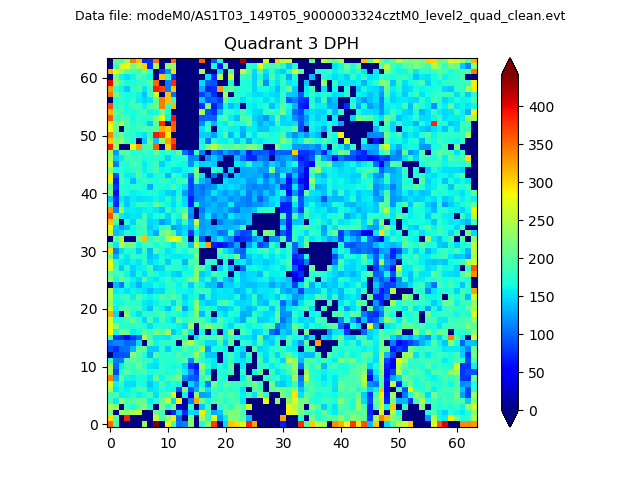 |
 |
Quadrant C |
| Plot type | Count rate plots | Images |
|---|---|---|
| Comparison with Poisson distribution Blue bars denote a histogram of data divided into 1 sec bins. Red curve is a Poisson curve with rate = median count rate of data. |
 |
 |
| Quadrant-wise count rates Data is divided into 100 sec bins |
 |
|
| Module-wise count rates for Quadrant A Data is divided into 100 sec bins |
 |
 |
| Module-wise count rates for Quadrant B Data is divided into 100 sec bins |
 |
 |
| Module-wise count rates for Quadrant C Data is divided into 100 sec bins |
 |
 |
| Module-wise count rates for Quadrant D Data is divided into 100 sec bins |
 |
 |
| Parameter | Plot |
|---|---|
| CZT HV Monitor |  |
| D_VDD |  |
| Temperature 1 |  |
| Veto HV Monitor |  |
| Veto LLD |  |
| Alpha Counter |  |
| _CPM_Rate |  |
| CZT Counter |  |
| +2.5 Volts monitor |  |
| +5 Volts monitor |  |
| _ROLL_ROT |  |
| _Roll_DEC |  |
| _Roll_RA |  |
| Veto Counter |  |