| Param | Original file | Final file |
|---|---|---|
| Filename | modeM0/AS1T03_149T05_9000003324_22423cztM0_level2.evt | modeM0/AS1T03_149T05_9000003324_22423cztM0_level2_quad_clean.evt |
| Size (bytes) | 234,322,560 | 41,650,560 |
| Size | 223.5 MB | 39.7 MB |
| Events in quadrant A | 1,686,738 | 258,068 |
| Events in quadrant B | 1,758,690 | 265,472 |
| Events in quadrant C | 1,730,861 | 251,729 |
| Events in quadrant D | 1,688,910 | 246,018 |
| Mode SS | |||
|---|---|---|---|
| Quadrant | BADHDUFLAG | Total packets | Discarded packets |
| A | 0 | 68 | 0 |
| B | 0 | 68 | 0 |
| C | 0 | 68 | 0 |
| D | 0 | 68 | 0 |
| Mode M9 | |||
|---|---|---|---|
| Quadrant | BADHDUFLAG | Total packets | Discarded packets |
| A | 0 | 12 | 0 |
| B | 0 | 12 | 0 |
| C | 0 | 12 | 0 |
| D | 0 | 12 | 0 |
| Mode M0 | |||
|---|---|---|---|
| Quadrant | BADHDUFLAG | Total packets | Discarded packets |
| A | 0 | 7121 | 2 |
| B | 0 | 7266 | 1 |
| C | 0 | 7130 | 1 |
| D | 0 | 7191 | 1 |
| Quadrant | Total seconds | Saturated seconds | Saturation percentage |
|---|---|---|---|
| A | 3382 | 25 | 0.739208% |
| B | 3382 | 30 | 0.887049% |
| C | 3382 | 59 | 1.744530% |
| D | 3382 | 16 | 0.473093% |
Noise dominated data is calculated using 1-second bins in cleaned event files. If a bin has >2000 counts, and if more than 50% of those come from <1% of pixels, then it is considered to be noise-dominated and hence unusable.
| Quadrant | # 1 sec bins | Bins with >0 counts | Bins with >2000 counts | High rate bins dominated by noise | Noise dominated (total time) | Noise dominated (detector-on time) | Marked lightcurve |
|---|---|---|---|---|---|---|---|
| A | 4547 | 3383 | 1 | 1 | 0.02% | 0.03% | 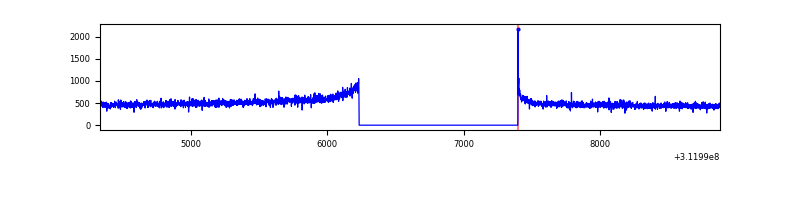 |
| B | 4547 | 3383 | 1 | 1 | 0.02% | 0.03% | 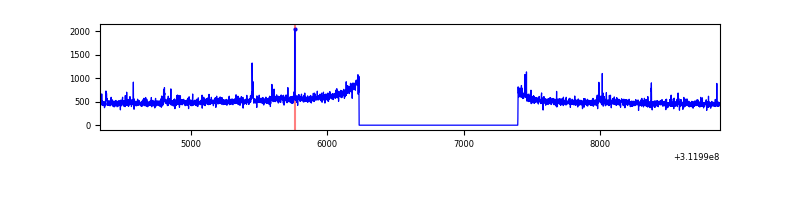 |
| C | 4547 | 3383 | 1 | 1 | 0.02% | 0.03% | 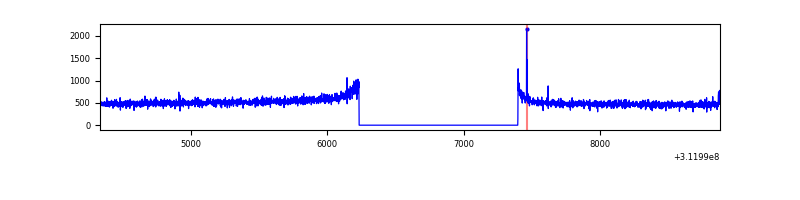 |
| D | 4547 | 3383 | 1 | 1 | 0.02% | 0.03% | 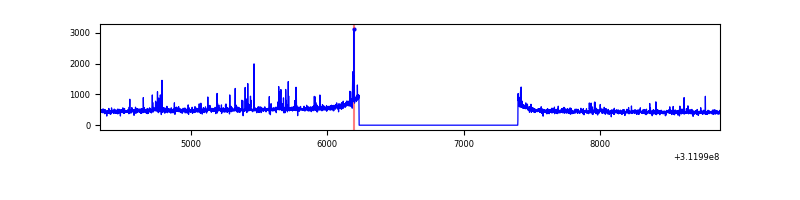 |
Top three noisy pixels from each quadrant. If the there are fewer than three noisy pixels in the level2.evt file, extra rows are filled as -1
| Pixel properties | Quadrant properties | ||||||
|---|---|---|---|---|---|---|---|
| Quadrant | DetID | PixID | Counts | Sigma | Mean | Median | Sigma |
| A | 13 | 254 | 4670 | 47.84 | 436 | 427 | 88.7 |
| A | 15 | 48 | 3969 | 39.93 | 436 | 427 | 88.7 |
| A | 3 | 137 | 3724 | 37.17 | 436 | 427 | 88.7 |
| B | 3 | 64 | 15511 | 178.67 | 437 | 425 | 84.4 |
| B | 0 | 190 | 14310 | 164.45 | 437 | 425 | 84.4 |
| B | 0 | 244 | 12631 | 144.56 | 437 | 425 | 84.4 |
| C | 14 | 238 | 67530 | 668.33 | 424 | 427 | 100.4 |
| C | 12 | 143 | 5127 | 46.81 | 424 | 427 | 100.4 |
| C | 0 | 10 | 3581 | 31.41 | 424 | 427 | 100.4 |
| D | 1 | 52 | 39790 | 377.94 | 426 | 414 | 104.2 |
| D | 15 | 145 | 14938 | 139.4 | 426 | 414 | 104.2 |
| D | 2 | 234 | 14908 | 139.12 | 426 | 414 | 104.2 |
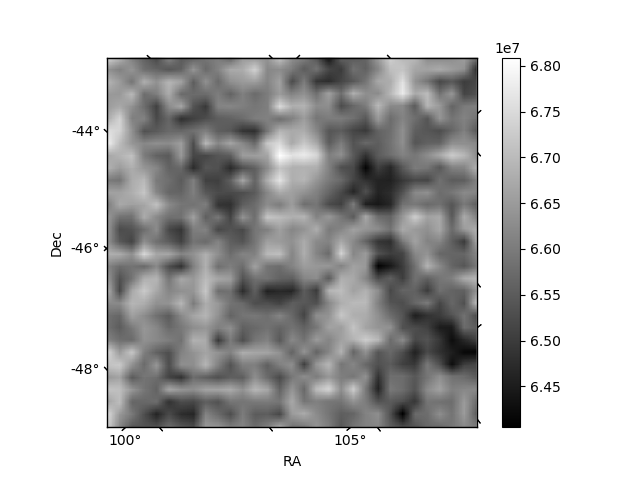
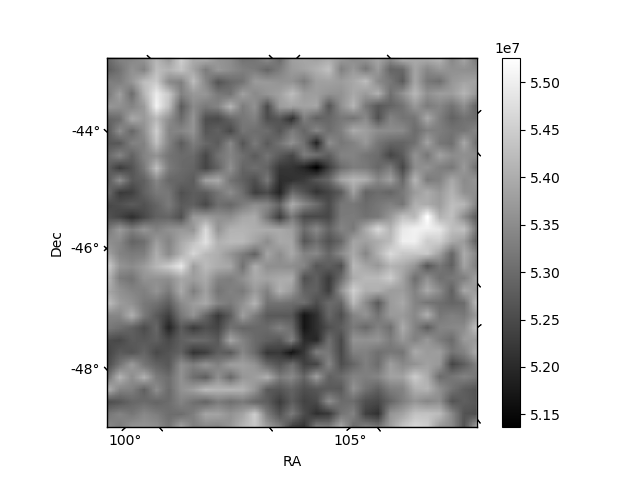
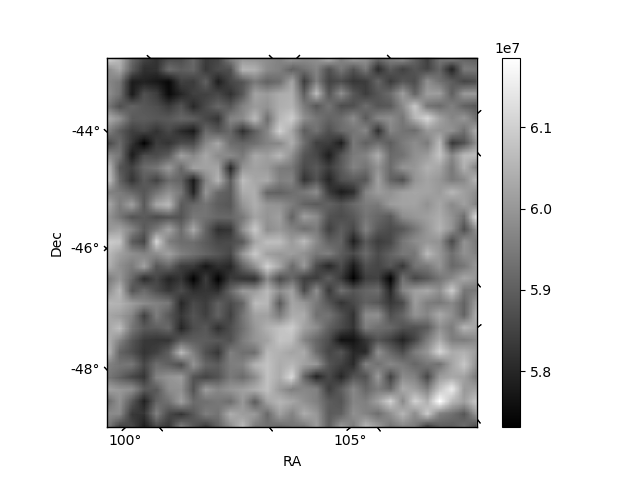
Histogram calculated using DETX and DETY for each event in the final _common_clean file
| Quadrant A | 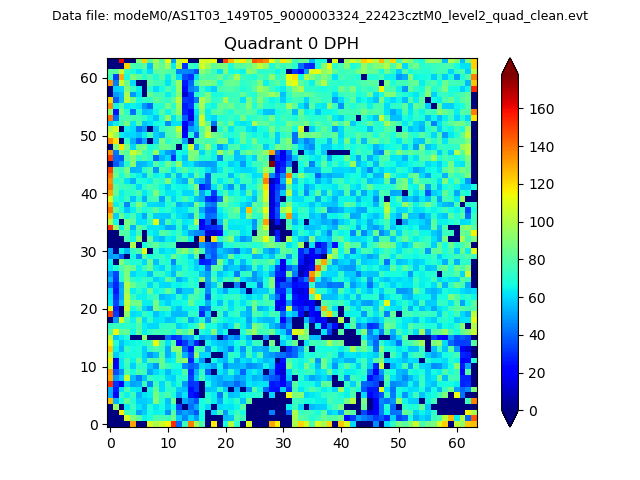 |
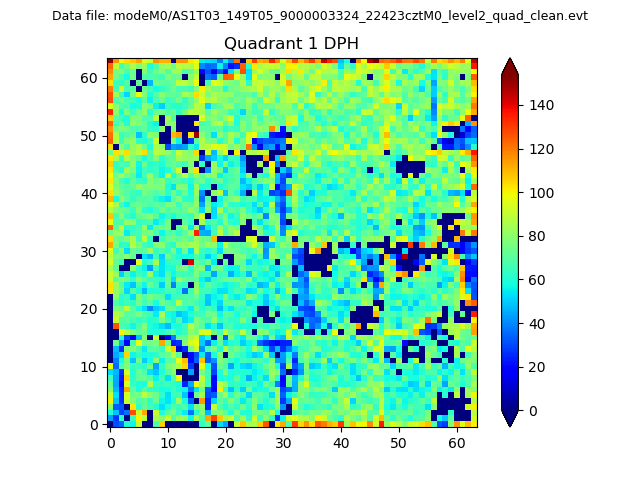 |
Quadrant B |
|---|---|---|---|
| Quadrant D | 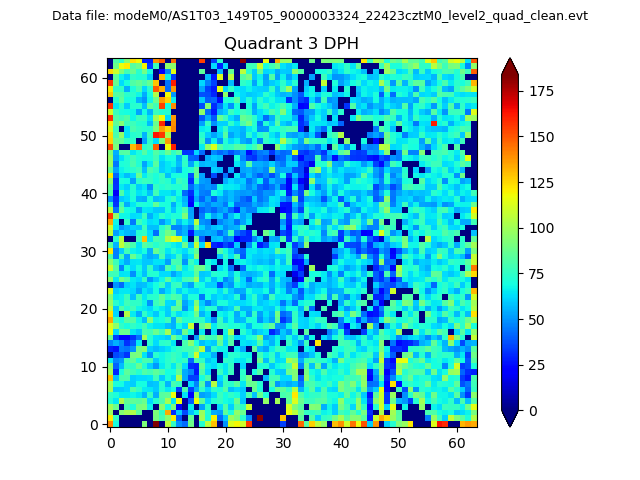 |
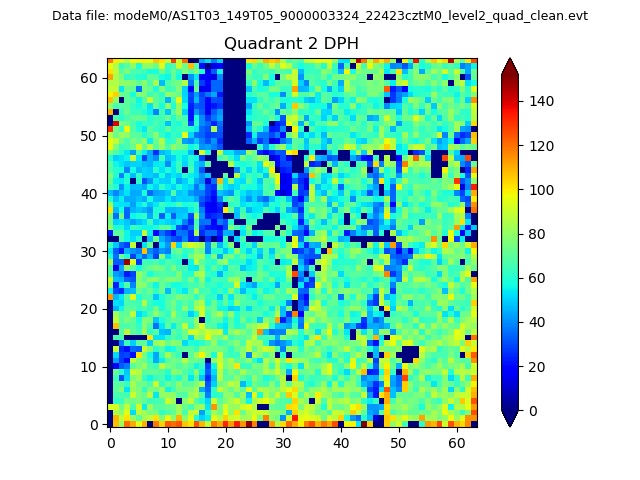 |
Quadrant C |
| Plot type | Count rate plots | Images |
|---|---|---|
| Comparison with Poisson distribution Blue bars denote a histogram of data divided into 1 sec bins. Red curve is a Poisson curve with rate = median count rate of data. |
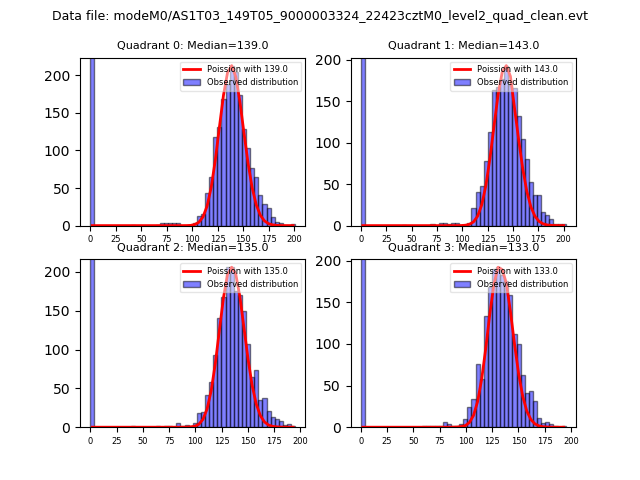 |
 |
| Quadrant-wise count rates Data is divided into 100 sec bins |
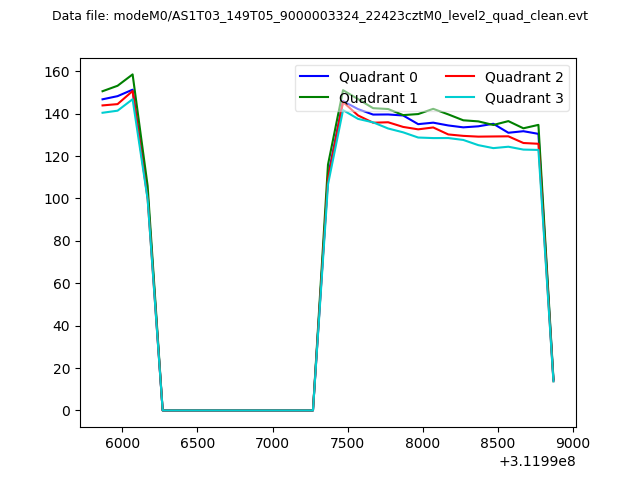 |
|
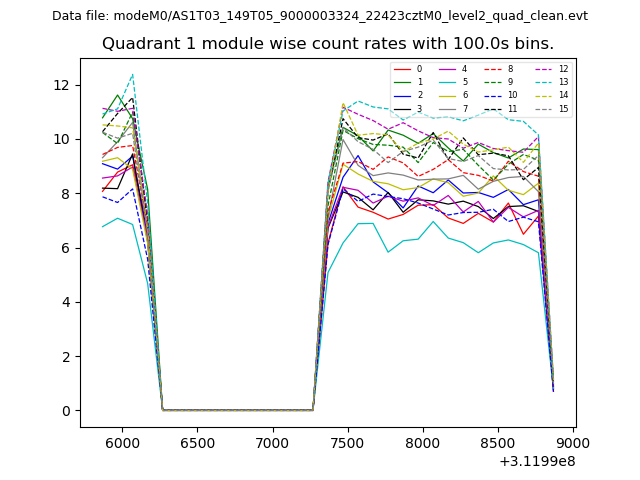
| Module-wise count rates for Quadrant A Data is divided into 100 sec bins |
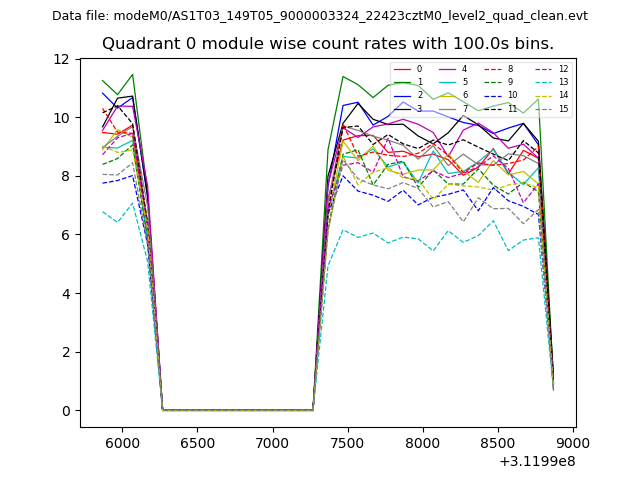 |
 |
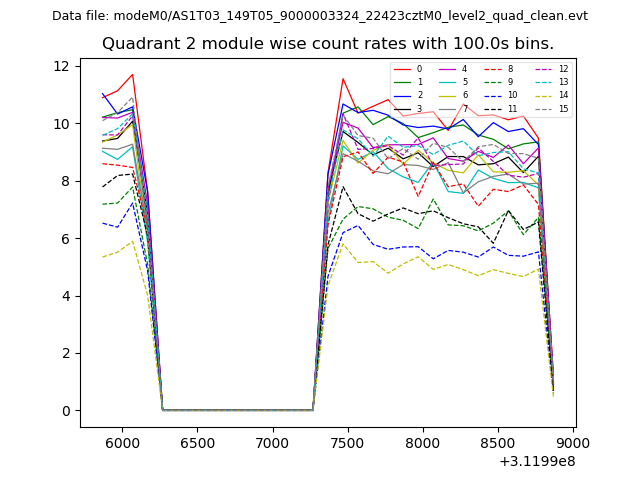
| Module-wise count rates for Quadrant B Data is divided into 100 sec bins |
 |
 |
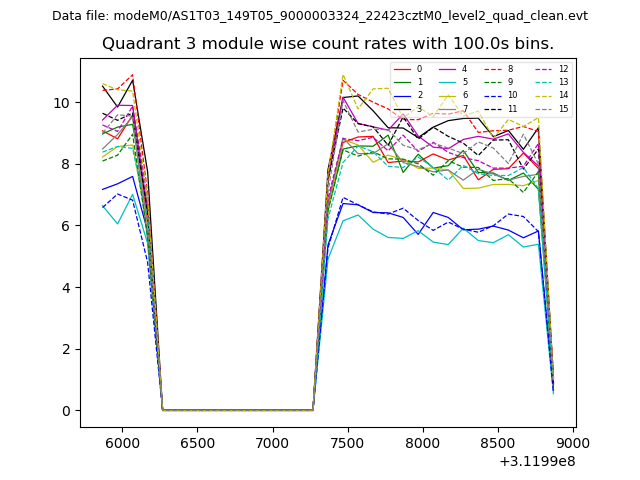
| Module-wise count rates for Quadrant C Data is divided into 100 sec bins |
 |
 |
| Module-wise count rates for Quadrant D Data is divided into 100 sec bins |
 |
 |
| Parameter | Plot |
|---|---|
| CZT HV Monitor | 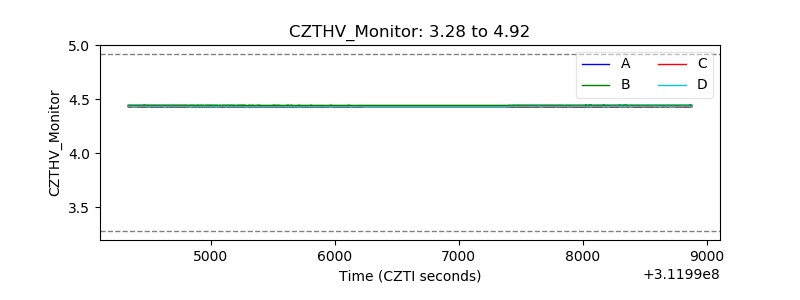 |
| D_VDD | 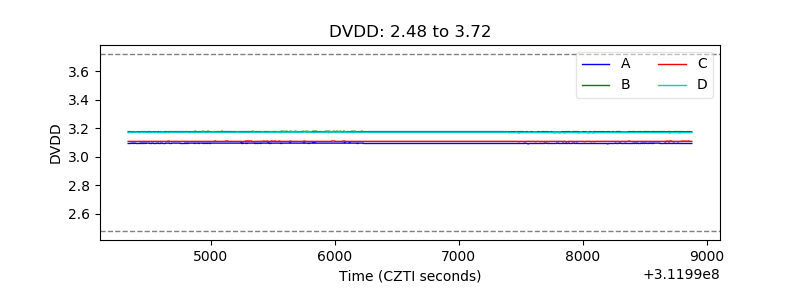 |
| Temperature 1 | 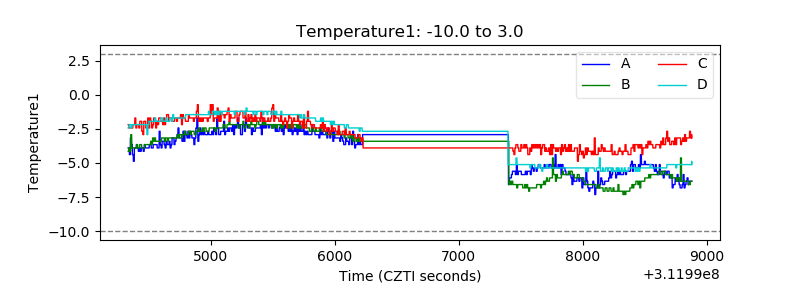 |
| Veto HV Monitor |  |
| Veto LLD | 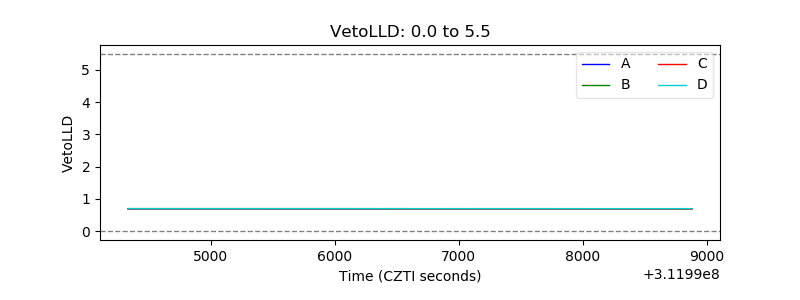 |
| Alpha Counter | 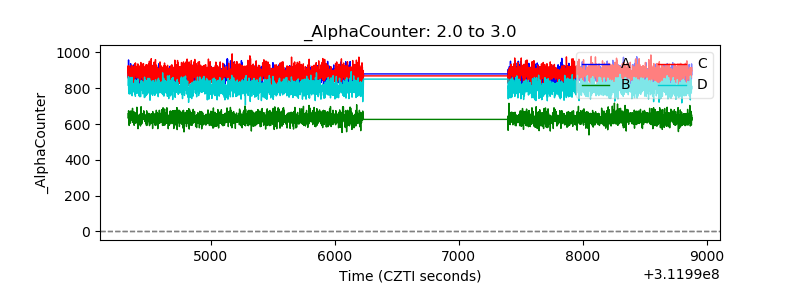 |
| _CPM_Rate | 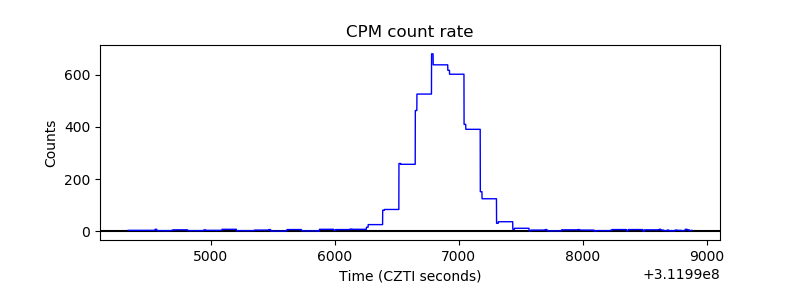 |
| CZT Counter | 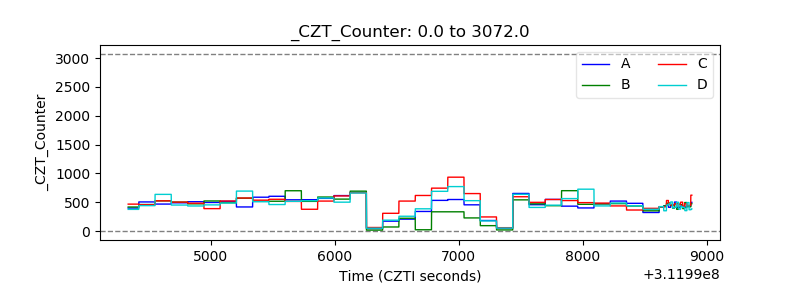 |
| +2.5 Volts monitor |  |
| +5 Volts monitor |  |
| _ROLL_ROT | 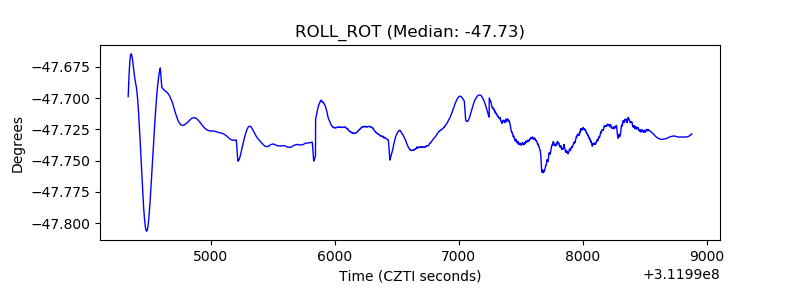 |
| _Roll_DEC | 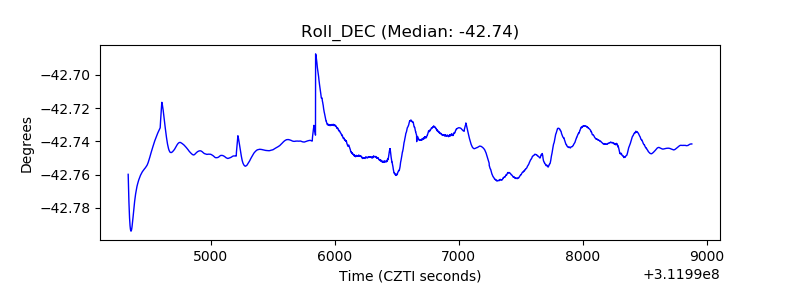 |
| _Roll_RA |  |
| Veto Counter | 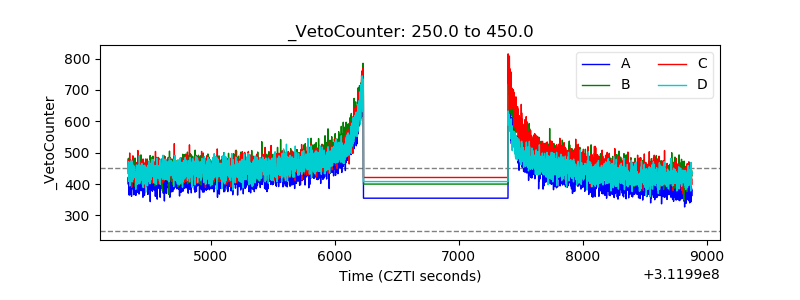 |