| Param | Original file | Final file |
|---|---|---|
| Filename | modeM0/AS1T03_149T05_9000003324_22425cztM0_level2.evt | modeM0/AS1T03_149T05_9000003324_22425cztM0_level2_quad_clean.evt |
| Size (bytes) | 316,995,840 | 60,978,240 |
| Size | 302.3 MB | 58.2 MB |
| Events in quadrant A | 2,249,419 | 381,602 |
| Events in quadrant B | 2,491,021 | 388,699 |
| Events in quadrant C | 2,295,085 | 368,521 |
| Events in quadrant D | 2,231,448 | 364,551 |
| Mode SS | |||
|---|---|---|---|
| Quadrant | BADHDUFLAG | Total packets | Discarded packets |
| A | 0 | 100 | 0 |
| B | 0 | 100 | 0 |
| C | 0 | 100 | 0 |
| D | 0 | 100 | 0 |
| Mode M9 | |||
|---|---|---|---|
| Quadrant | BADHDUFLAG | Total packets | Discarded packets |
| A | 0 | 8 | 0 |
| B | 0 | 8 | 0 |
| C | 0 | 8 | 0 |
| D | 0 | 8 | 0 |
| Mode M0 | |||
|---|---|---|---|
| Quadrant | BADHDUFLAG | Total packets | Discarded packets |
| A | 0 | 9947 | 1 |
| B | 0 | 10424 | 1 |
| C | 0 | 9975 | 1 |
| D | 0 | 10064 | 1 |
| Quadrant | Total seconds | Saturated seconds | Saturation percentage |
|---|---|---|---|
| A | 4885 | 9 | 0.184237% |
| B | 4885 | 30 | 0.614125% |
| C | 4885 | 64 | 1.310133% |
| D | 4885 | 15 | 0.307062% |
Noise dominated data is calculated using 1-second bins in cleaned event files. If a bin has >2000 counts, and if more than 50% of those come from <1% of pixels, then it is considered to be noise-dominated and hence unusable.
| Quadrant | # 1 sec bins | Bins with >0 counts | Bins with >2000 counts | High rate bins dominated by noise | Noise dominated (total time) | Noise dominated (detector-on time) | Marked lightcurve |
|---|---|---|---|---|---|---|---|
| A | 5700 | 4886 | 0 | 0 | 0.00% | 0.00% | 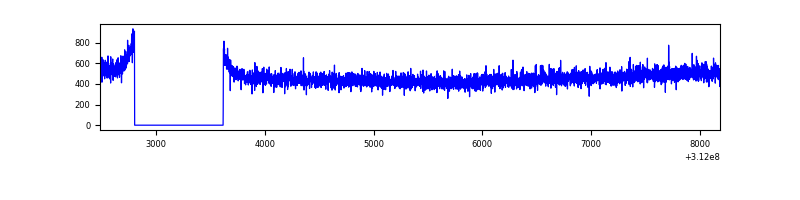 |
| B | 5700 | 4886 | 2 | 2 | 0.04% | 0.04% | 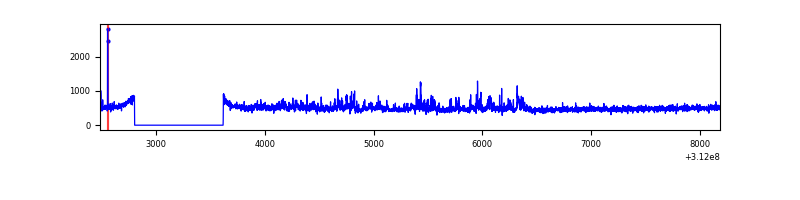 |
| C | 5700 | 4886 | 0 | 0 | 0.00% | 0.00% | 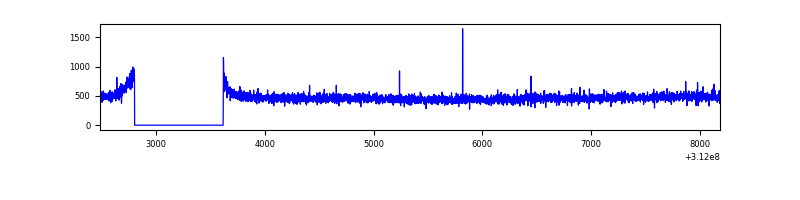 |
| D | 5700 | 4886 | 6 | 6 | 0.11% | 0.12% | 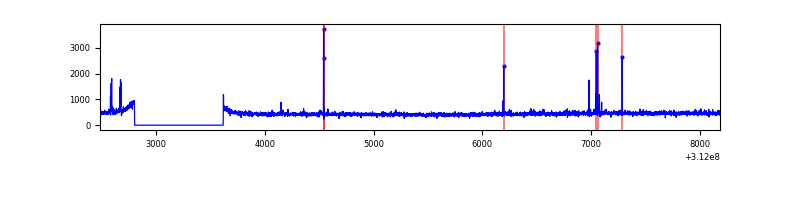 |
Top three noisy pixels from each quadrant. If the there are fewer than three noisy pixels in the level2.evt file, extra rows are filled as -1
| Pixel properties | Quadrant properties | ||||||
|---|---|---|---|---|---|---|---|
| Quadrant | DetID | PixID | Counts | Sigma | Mean | Median | Sigma |
| A | 15 | 174 | 13545 | 109.84 | 579 | 566 | 118.2 |
| A | 13 | 254 | 7344 | 57.36 | 579 | 566 | 118.2 |
| A | 3 | 1 | 5119 | 38.53 | 579 | 566 | 118.2 |
| B | 0 | 244 | 209942 | 1897.14 | 578 | 563 | 110.4 |
| B | 12 | 111 | 13416 | 116.46 | 578 | 563 | 110.4 |
| B | 11 | 111 | 12076 | 104.32 | 578 | 563 | 110.4 |
| C | 14 | 238 | 88372 | 655.71 | 564 | 565 | 133.9 |
| C | 13 | 61 | 3860 | 24.61 | 564 | 565 | 133.9 |
| C | 1 | 16 | 3475 | 21.73 | 564 | 565 | 133.9 |
| D | 13 | 172 | 29310 | 208.03 | 568 | 549 | 138.3 |
| D | 2 | 234 | 20332 | 143.09 | 568 | 549 | 138.3 |
| D | 12 | 218 | 12432 | 85.95 | 568 | 549 | 138.3 |
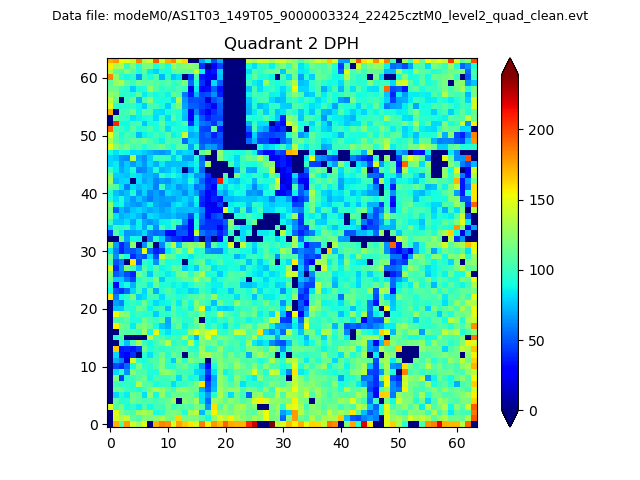
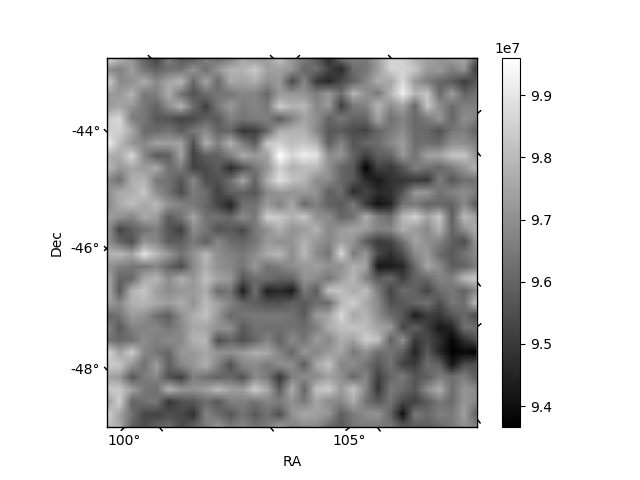
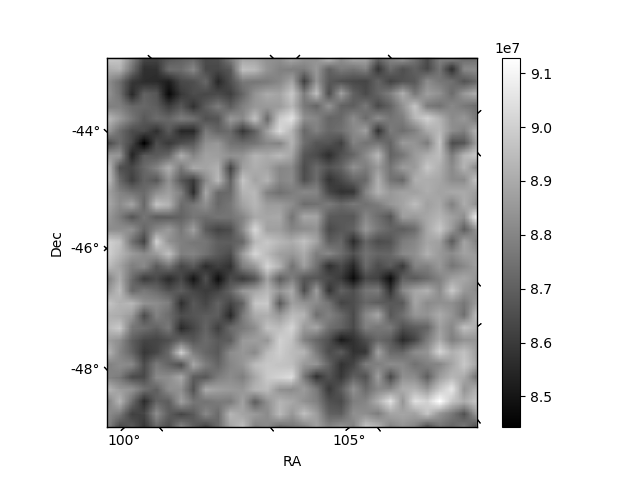
Histogram calculated using DETX and DETY for each event in the final _common_clean file
| Quadrant A | 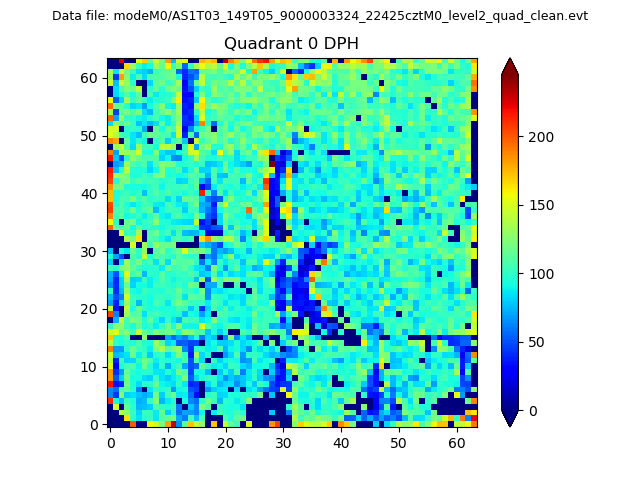 |
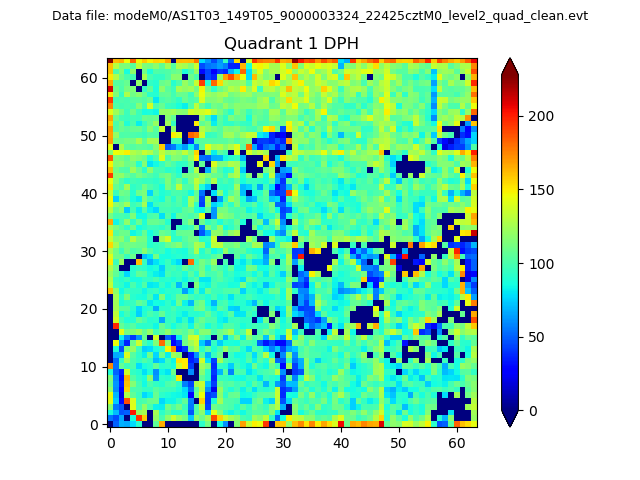 |
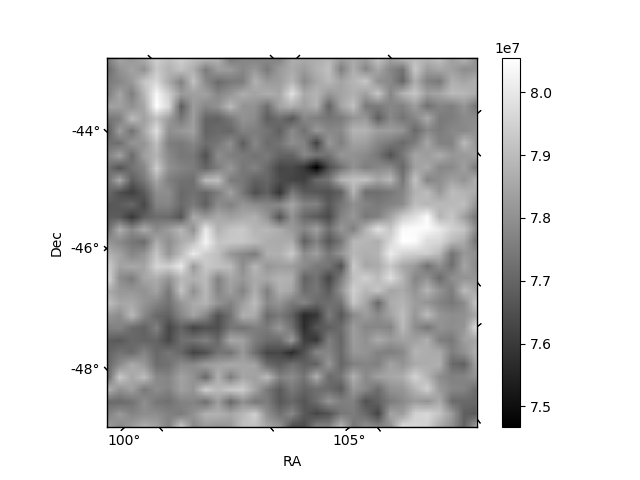
Quadrant B |
|---|---|---|---|
| Quadrant D | 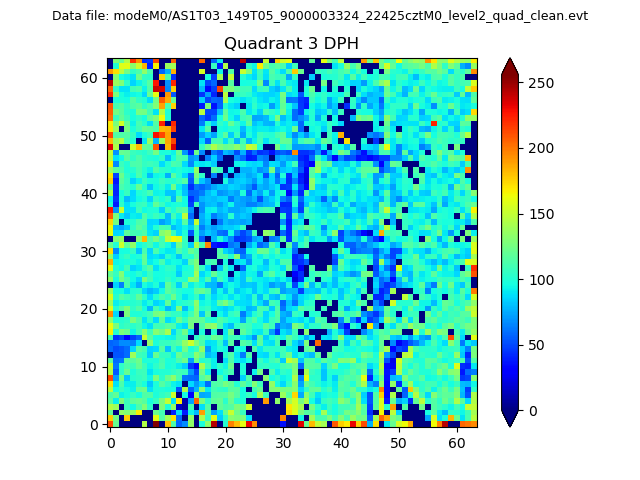 |
 |
Quadrant C |
| Plot type | Count rate plots | Images |
|---|---|---|
| Comparison with Poisson distribution Blue bars denote a histogram of data divided into 1 sec bins. Red curve is a Poisson curve with rate = median count rate of data. |
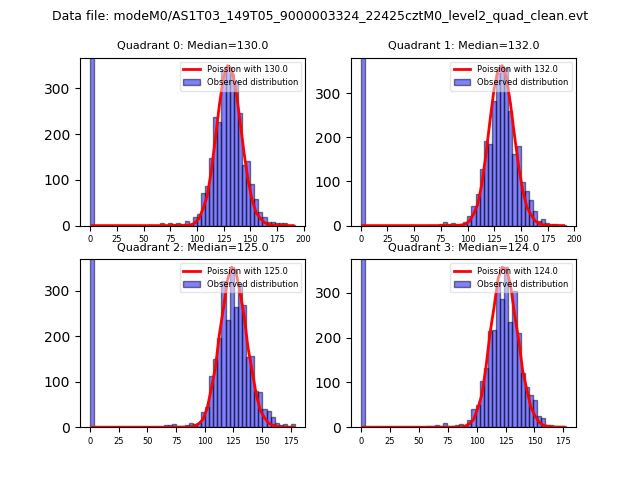 |
 |
| Quadrant-wise count rates Data is divided into 100 sec bins |
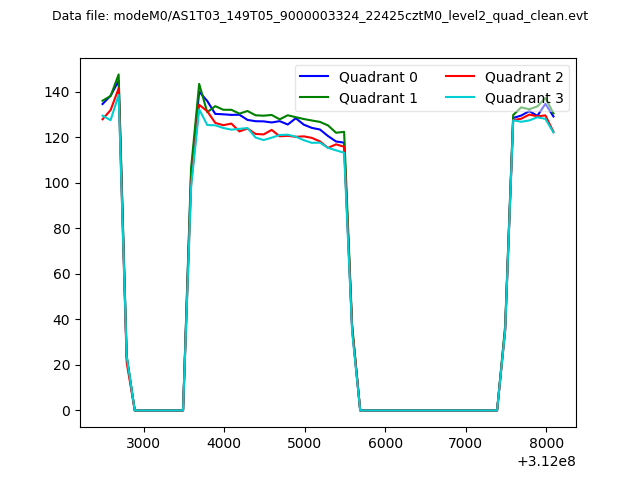 |
|
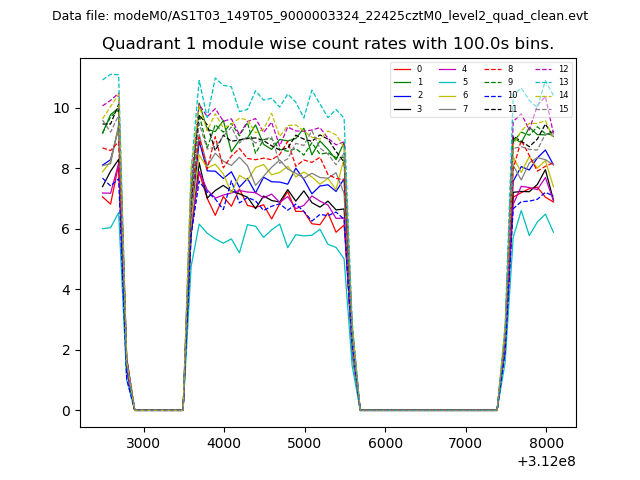
| Module-wise count rates for Quadrant A Data is divided into 100 sec bins |
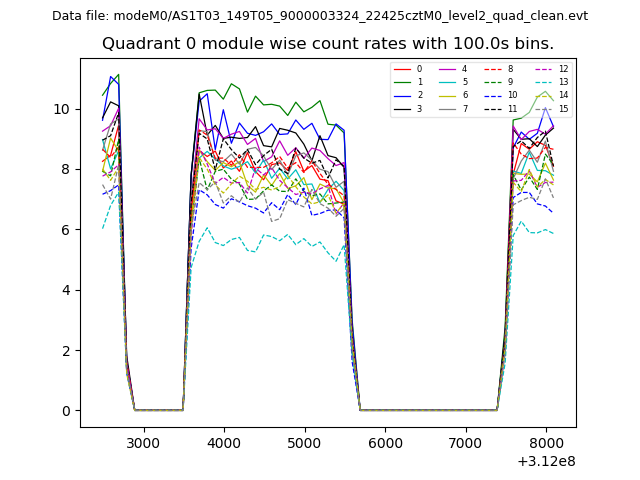 |
 |
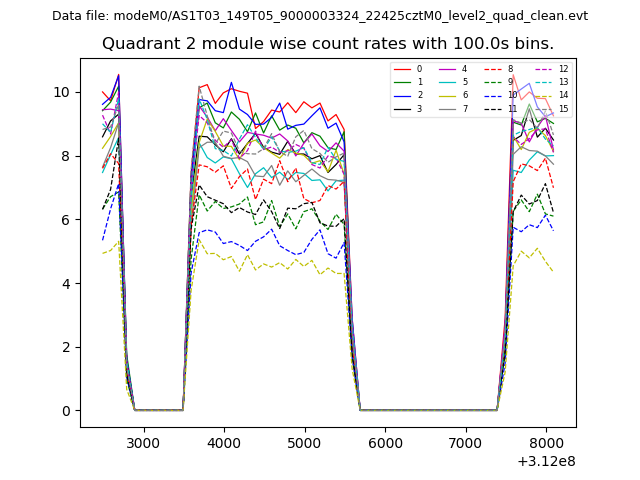
| Module-wise count rates for Quadrant B Data is divided into 100 sec bins |
 |
 |
| Module-wise count rates for Quadrant C Data is divided into 100 sec bins |
 |
 |
| Module-wise count rates for Quadrant D Data is divided into 100 sec bins |
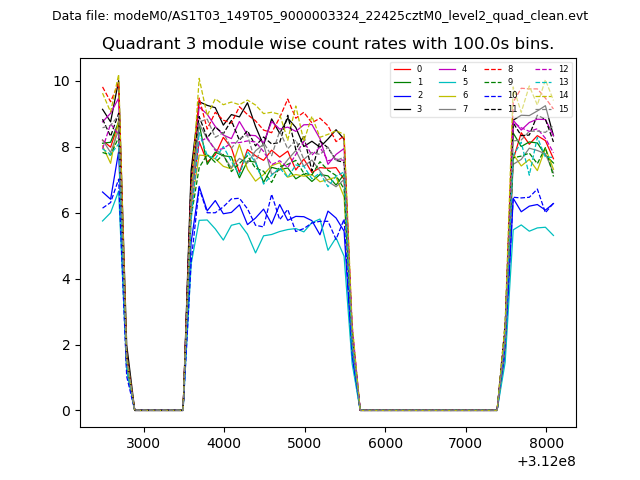 |
 |
| Parameter | Plot |
|---|---|
| CZT HV Monitor | 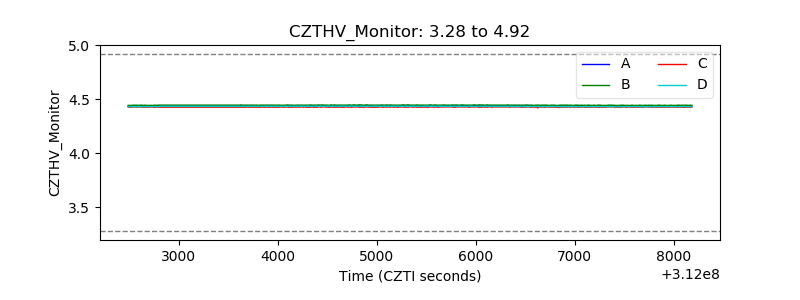 |
| D_VDD | 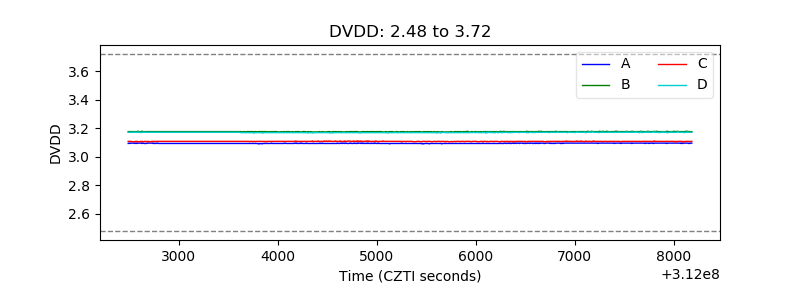 |
| Temperature 1 | 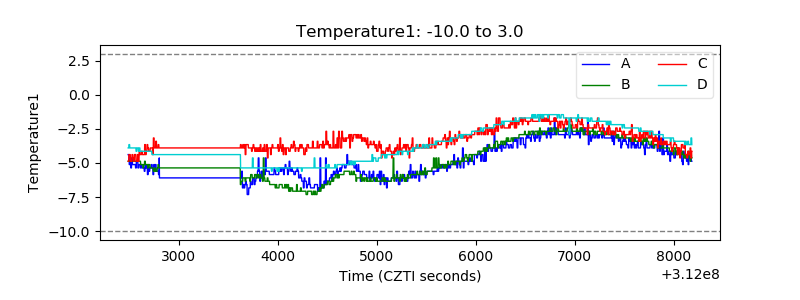 |
| Veto HV Monitor | 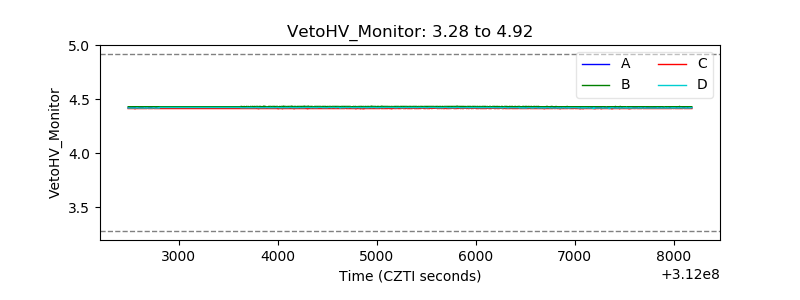 |
| Veto LLD | 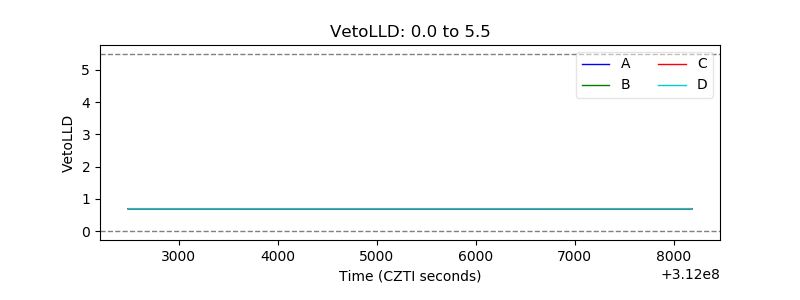 |
| Alpha Counter | 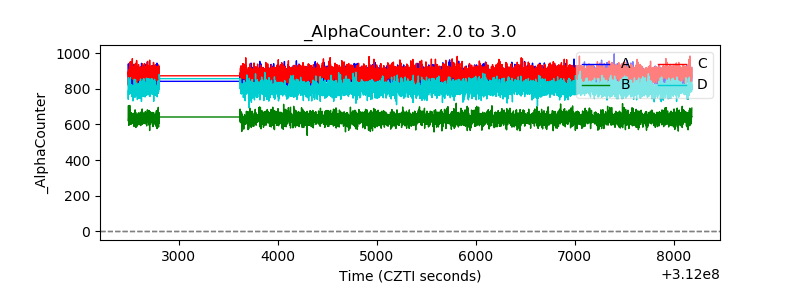 |
| _CPM_Rate | 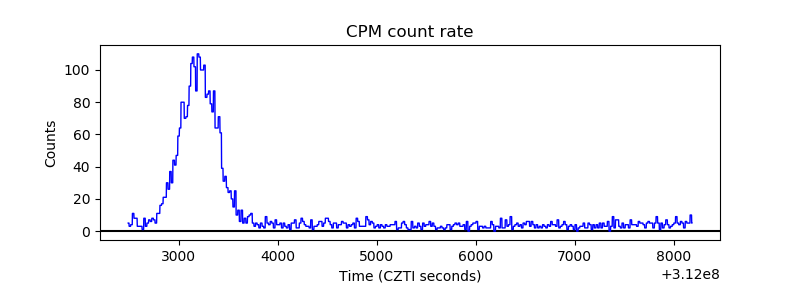 |
| CZT Counter | 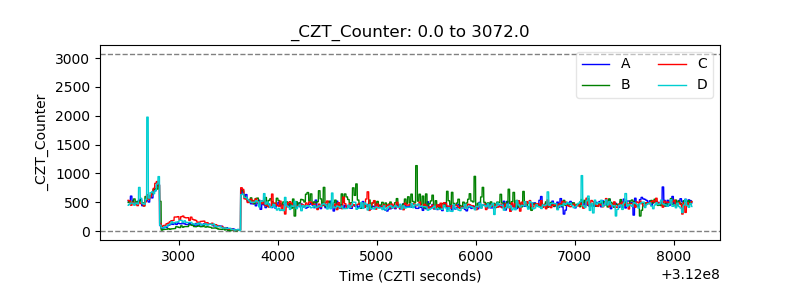 |
| +2.5 Volts monitor |  |
| +5 Volts monitor |  |
| _ROLL_ROT | 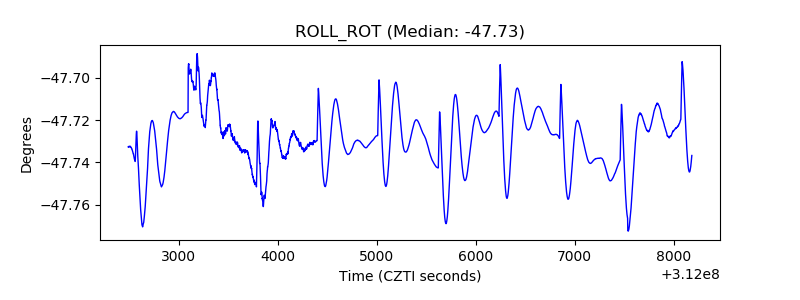 |
| _Roll_DEC | 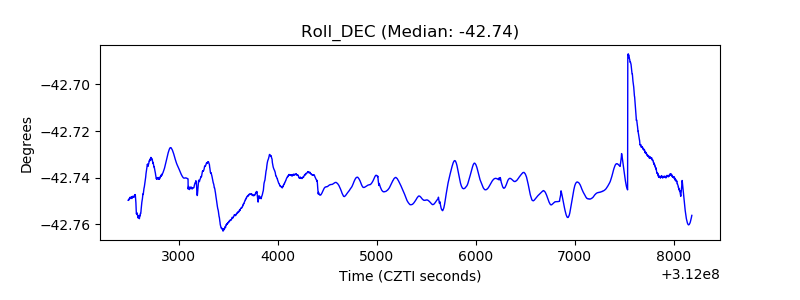 |
| _Roll_RA | 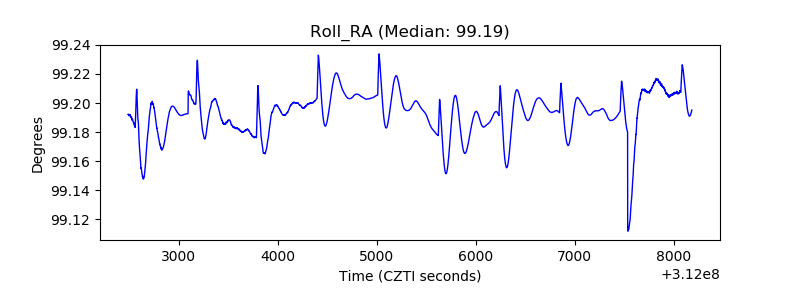 |
| Veto Counter | 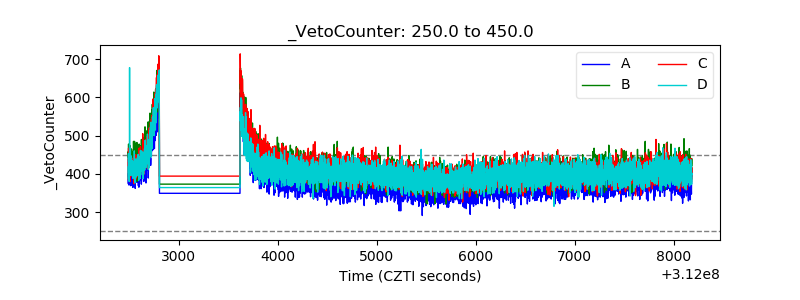 |