| Param | Original file | Final file |
|---|---|---|
| Filename | modeM0/AS1T03_149T06_9000003326_22426cztM0_level2.evt | modeM0/AS1T03_149T06_9000003326_22426cztM0_level2_quad_clean.evt |
| Size (bytes) | 295,819,200 | 54,702,720 |
| Size | 282.1 MB | 52.2 MB |
| Events in quadrant A | 2,113,712 | 337,738 |
| Events in quadrant B | 2,175,292 | 345,204 |
| Events in quadrant C | 2,130,384 | 327,864 |
| Events in quadrant D | 2,225,943 | 322,565 |
| Mode SS | |||
|---|---|---|---|
| Quadrant | BADHDUFLAG | Total packets | Discarded packets |
| A | 0 | 94 | 0 |
| B | 0 | 94 | 0 |
| C | 0 | 94 | 0 |
| D | 0 | 94 | 0 |
| Mode M0 | |||
|---|---|---|---|
| Quadrant | BADHDUFLAG | Total packets | Discarded packets |
| A | 0 | 9372 | 1 |
| B | 0 | 9469 | 1 |
| C | 0 | 9382 | 1 |
| D | 0 | 9838 | 1 |
| Mode M9 | |||
|---|---|---|---|
| Quadrant | BADHDUFLAG | Total packets | Discarded packets |
| A | 0 | 4 | 0 |
| B | 0 | 4 | 0 |
| C | 0 | 4 | 0 |
| D | 0 | 4 | 0 |
| Quadrant | Total seconds | Saturated seconds | Saturation percentage |
|---|---|---|---|
| A | 4591 | 39 | 0.849488% |
| B | 4592 | 55 | 1.197735% |
| C | 4592 | 81 | 1.763937% |
| D | 4592 | 38 | 0.827526% |
Noise dominated data is calculated using 1-second bins in cleaned event files. If a bin has >2000 counts, and if more than 50% of those come from <1% of pixels, then it is considered to be noise-dominated and hence unusable.
| Quadrant | # 1 sec bins | Bins with >0 counts | Bins with >2000 counts | High rate bins dominated by noise | Noise dominated (total time) | Noise dominated (detector-on time) | Marked lightcurve |
|---|---|---|---|---|---|---|---|
| A | 4976 | 4592 | 0 | 0 | 0.00% | 0.00% | 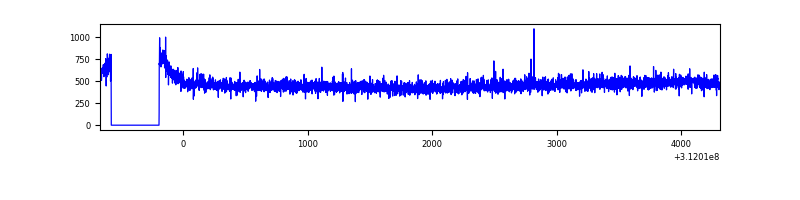 |
| B | 4977 | 4593 | 0 | 0 | 0.00% | 0.00% | 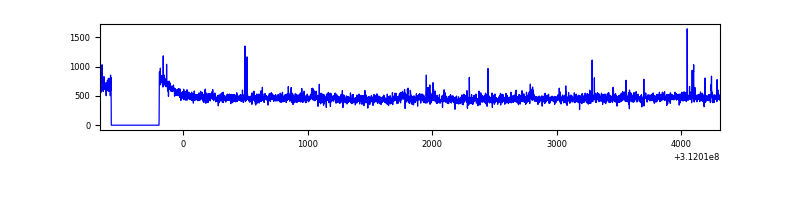 |
| C | 4977 | 4593 | 0 | 0 | 0.00% | 0.00% | 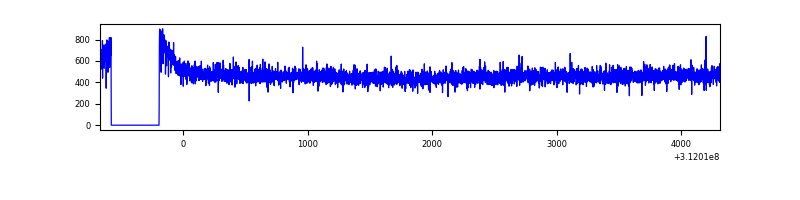 |
| D | 4977 | 4593 | 15 | 15 | 0.30% | 0.33% | 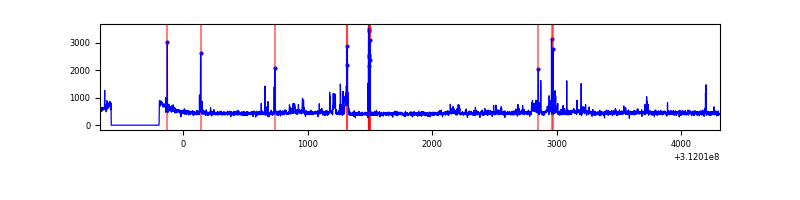 |
Top three noisy pixels from each quadrant. If the there are fewer than three noisy pixels in the level2.evt file, extra rows are filled as -1
| Pixel properties | Quadrant properties | ||||||
|---|---|---|---|---|---|---|---|
| Quadrant | DetID | PixID | Counts | Sigma | Mean | Median | Sigma |
| A | 15 | 174 | 19182 | 168.68 | 542 | 528 | 110.6 |
| A | 13 | 254 | 6141 | 50.76 | 542 | 528 | 110.6 |
| A | 3 | 137 | 4779 | 38.44 | 542 | 528 | 110.6 |
| B | 0 | 244 | 43970 | 414.86 | 538 | 523 | 104.7 |
| B | 3 | 64 | 14767 | 136.01 | 538 | 523 | 104.7 |
| B | 12 | 111 | 12676 | 116.04 | 538 | 523 | 104.7 |
| C | 14 | 238 | 84373 | 674.17 | 525 | 526 | 124.4 |
| C | 13 | 61 | 3511 | 24.0 | 525 | 526 | 124.4 |
| C | 15 | 78 | 1312 | 6.32 | 525 | 526 | 124.4 |
| D | 13 | 104 | 91223 | 696.41 | 533 | 515 | 130.3 |
| D | 1 | 52 | 51071 | 388.14 | 533 | 515 | 130.3 |
| D | 2 | 153 | 26915 | 202.69 | 533 | 515 | 130.3 |
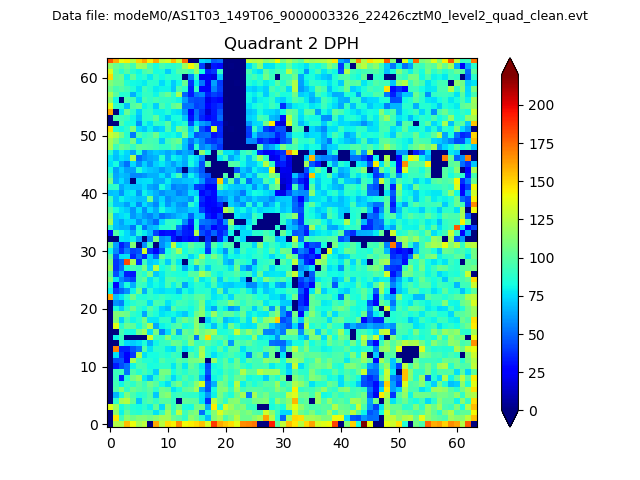
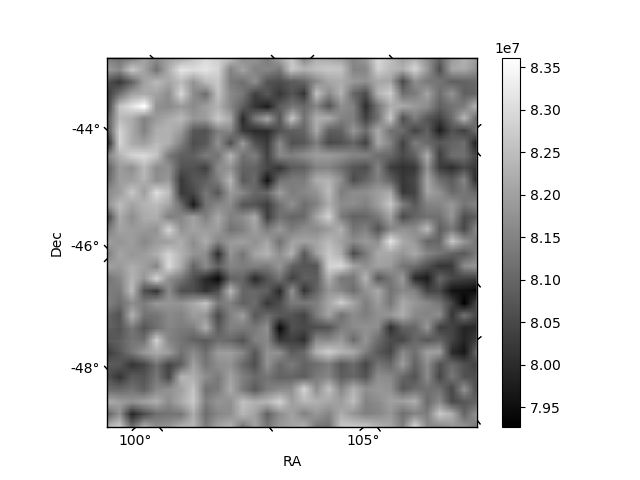
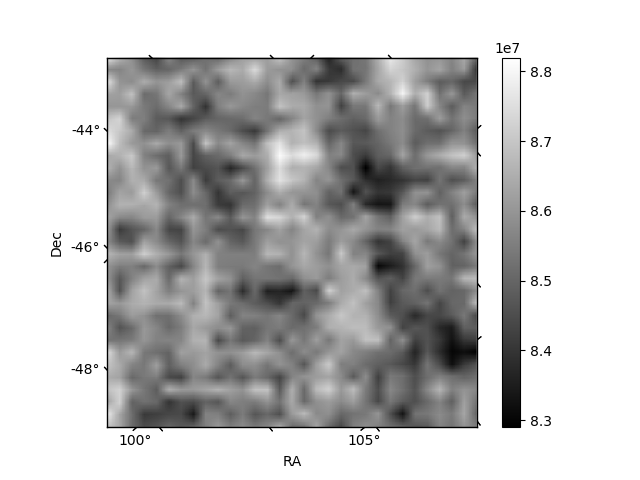
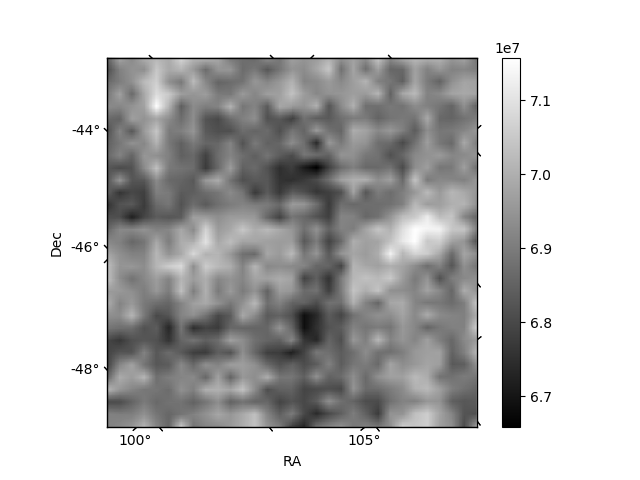
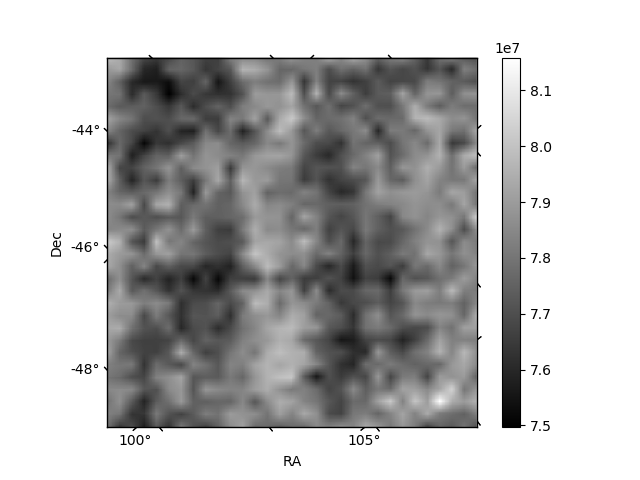
Histogram calculated using DETX and DETY for each event in the final _common_clean file
| Quadrant A |  |
 |
Quadrant B |
|---|---|---|---|
| Quadrant D | 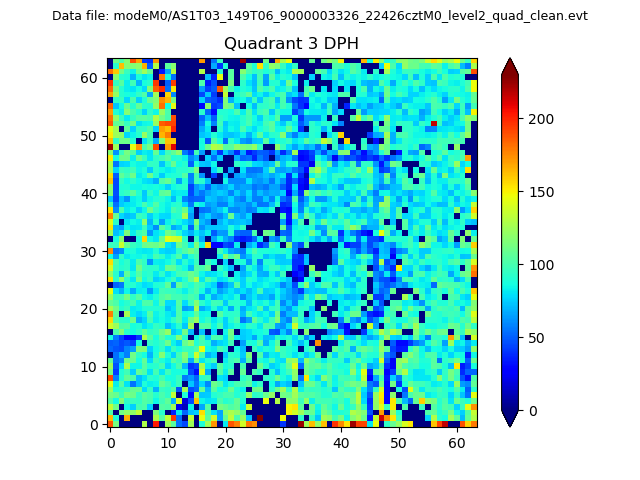 |
 |
Quadrant C |
| Plot type | Count rate plots | Images |
|---|---|---|
| Comparison with Poisson distribution Blue bars denote a histogram of data divided into 1 sec bins. Red curve is a Poisson curve with rate = median count rate of data. |
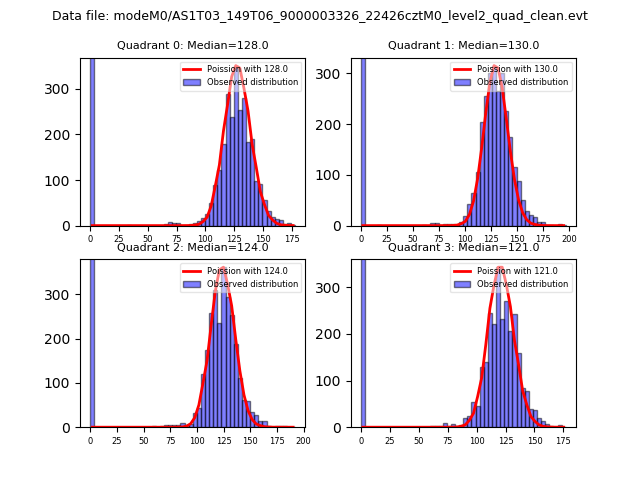 |
 |
| Quadrant-wise count rates Data is divided into 100 sec bins |
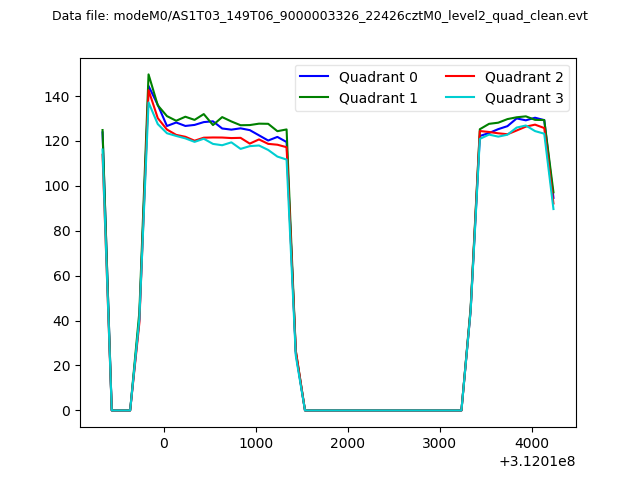 |
|
| Module-wise count rates for Quadrant A Data is divided into 100 sec bins |
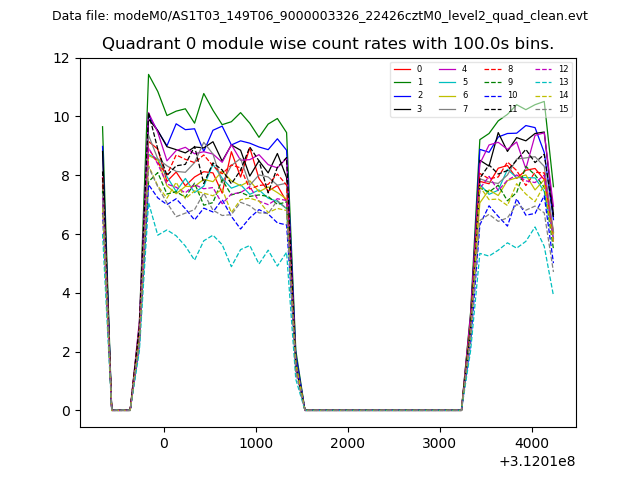 |
 |
| Module-wise count rates for Quadrant B Data is divided into 100 sec bins |
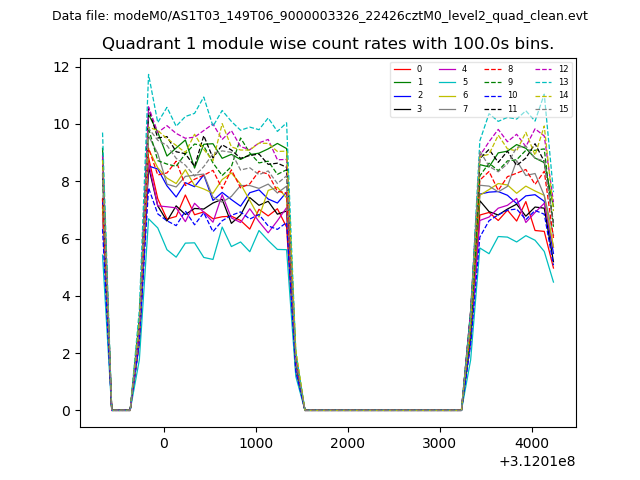 |
 |
| Module-wise count rates for Quadrant C Data is divided into 100 sec bins |
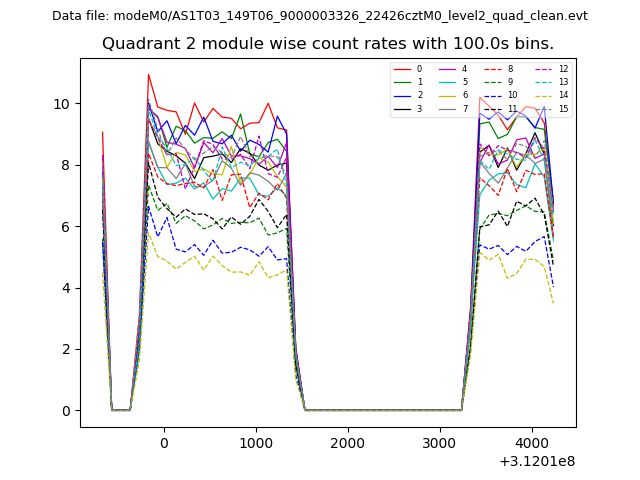 |
 |
| Module-wise count rates for Quadrant D Data is divided into 100 sec bins |
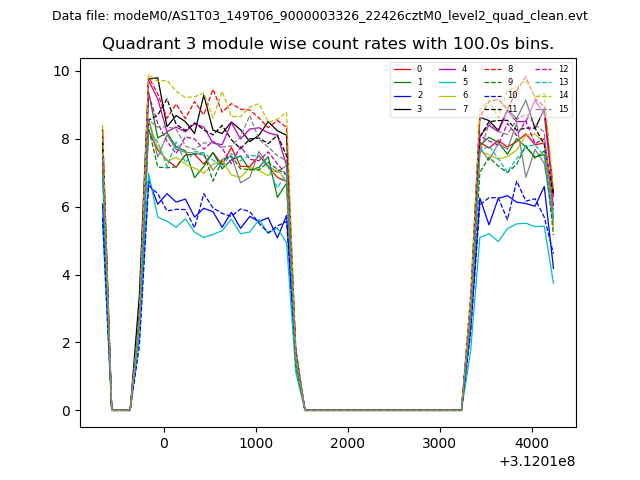 |
 |
| Parameter | Plot |
|---|---|
| CZT HV Monitor | 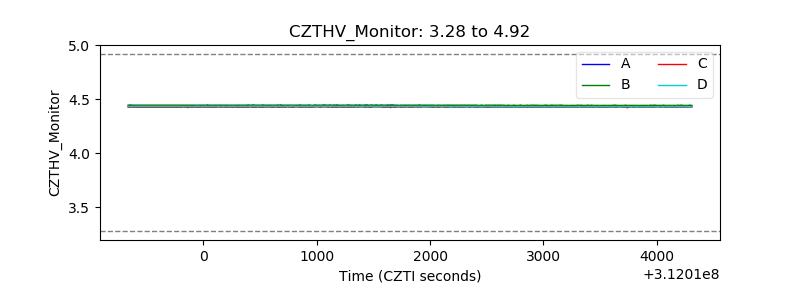 |
| D_VDD | 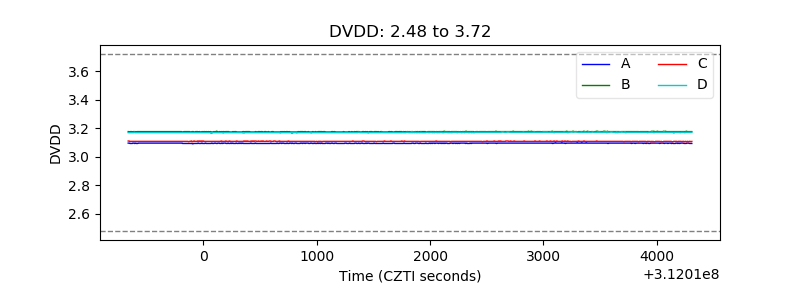 |
| Temperature 1 | 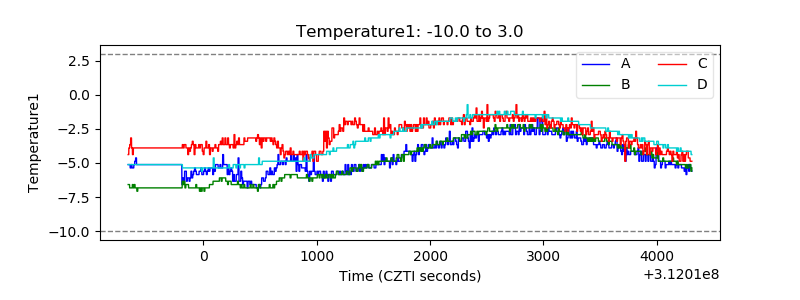 |
| Veto HV Monitor | 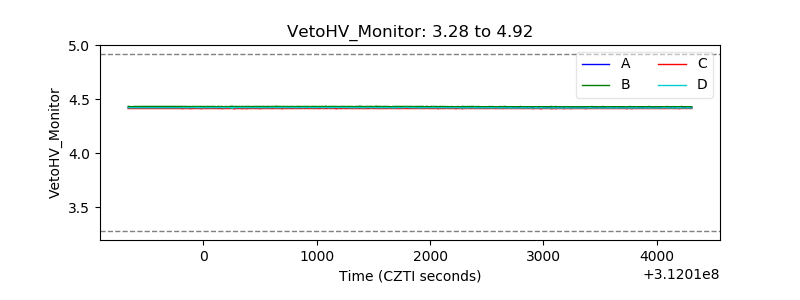 |
| Veto LLD |  |
| Alpha Counter | 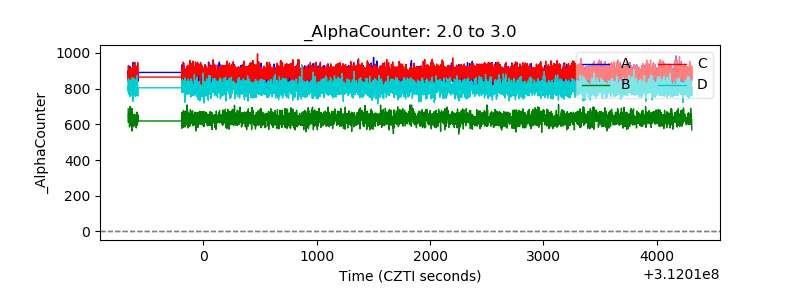 |
| _CPM_Rate | 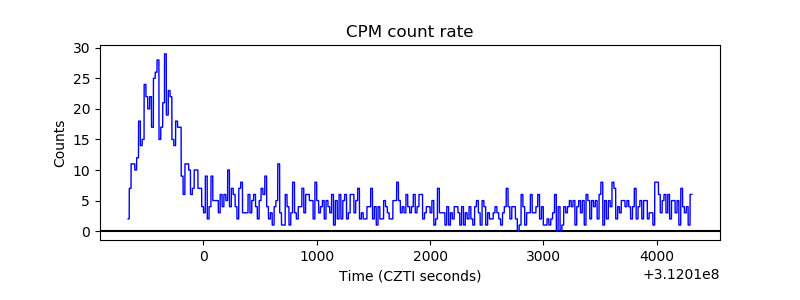 |
| CZT Counter | 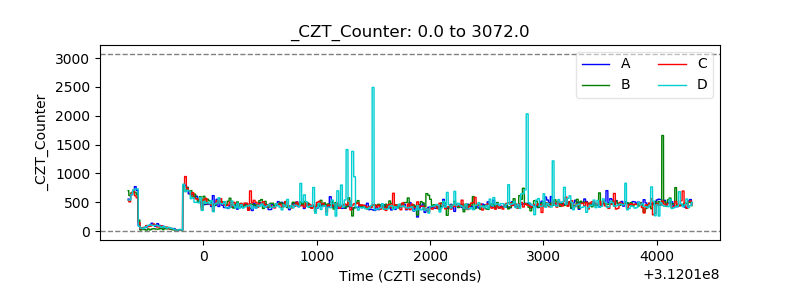 |
| +2.5 Volts monitor |  |
| +5 Volts monitor | 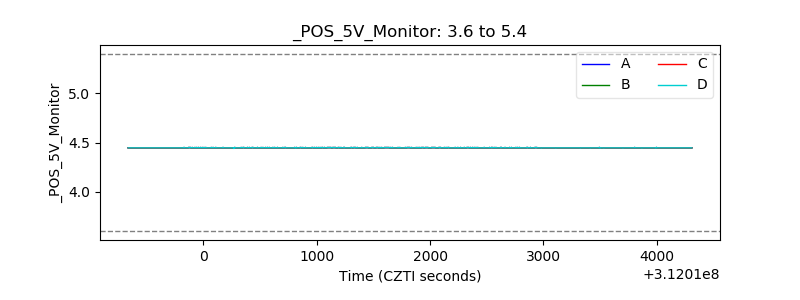 |
| _ROLL_ROT | 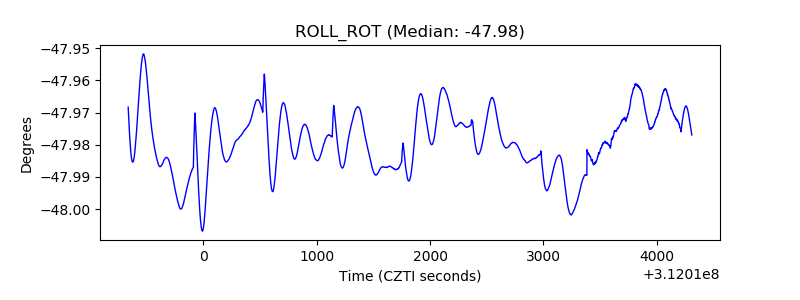 |
| _Roll_DEC | 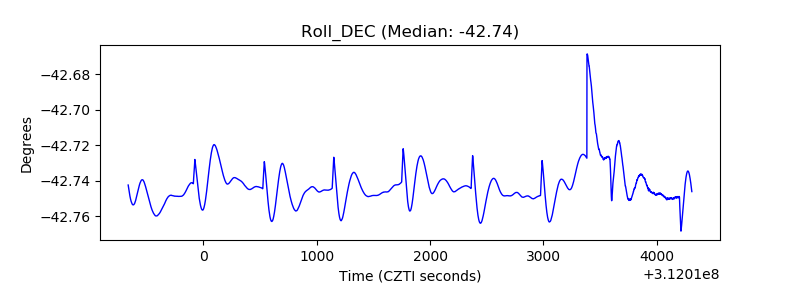 |
| _Roll_RA | 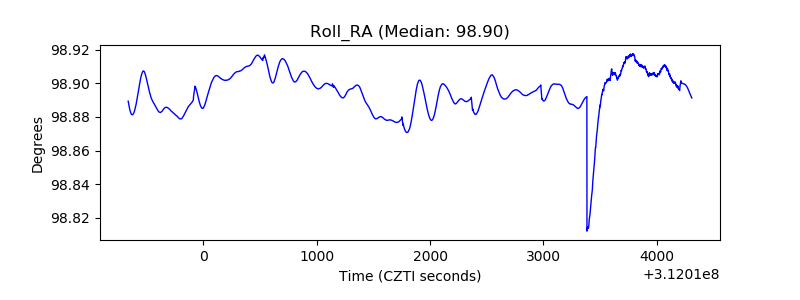 |
| Veto Counter | 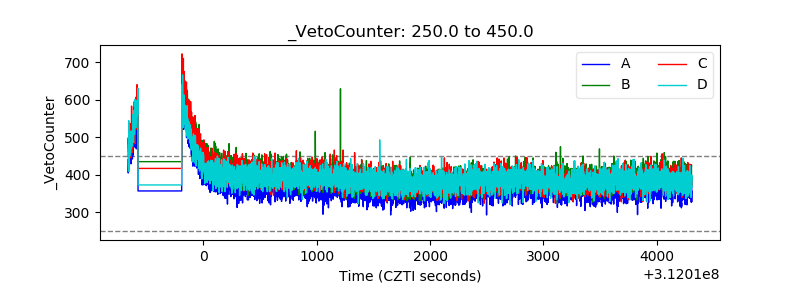 |