| Param | Original file | Final file |
|---|---|---|
| Filename | modeM0/AS1T03_159T01_9000003328cztM0_level2.fits | modeM0/AS1T03_159T01_9000003328cztM0_level2_quad_clean.evt |
| Size (bytes) | 497,522,880 | 469,275,840 |
| Size | 474.5 MB | 447.5 MB |
| Events in quadrant A | 3,068,638 | 2,820,146 |
| Events in quadrant B | 2,958,880 | 2,837,714 |
| Events in quadrant C | 2,982,904 | 2,643,932 |
| Events in quadrant D | 2,613,206 | 2,465,914 |
| Mode M9 | |||
|---|---|---|---|
| Quadrant | BADHDUFLAG | Total packets | Discarded packets |
| A | 0 | 86 | 0 |
| B | 0 | 86 | 0 |
| C | 0 | 86 | 0 |
| D | 0 | 86 | 0 |
| Mode SS | |||
|---|---|---|---|
| Quadrant | BADHDUFLAG | Total packets | Discarded packets |
| A | 0 | 952 | 0 |
| B | 0 | 952 | 0 |
| C | 0 | 952 | 0 |
| D | 0 | 952 | 0 |
| Mode M0 | |||
|---|---|---|---|
| Quadrant | BADHDUFLAG | Total packets | Discarded packets |
| A | 0 | 105372 | 0 |
| B | 0 | 108275 | 0 |
| C | 0 | 105079 | 0 |
| D | 0 | 109717 | 0 |
| Quadrant | Total seconds | Saturated seconds | Saturation percentage |
|---|---|---|---|
| A | 50426 | 654 | 1.296950% |
| B | 50426 | 841 | 1.667790% |
| C | 50426 | 921 | 1.826439% |
| D | 50426 | 691 | 1.370325% |
Noise dominated data is calculated using 1-second bins in cleaned event files. If a bin has >2000 counts, and if more than 50% of those come from <1% of pixels, then it is considered to be noise-dominated and hence unusable.
| Quadrant | # 1 sec bins | Bins with >0 counts | Bins with >2000 counts | High rate bins dominated by noise | Noise dominated (total time) | Noise dominated (detector-on time) | Marked lightcurve |
|---|---|---|---|---|---|---|---|
| A | 59201 | 50419 | 0 | 0 | 0.00% | 0.00% |  |
| B | 59201 | 50419 | 0 | 0 | 0.00% | 0.00% |  |
| C | 59201 | 50420 | 0 | 0 | 0.00% | 0.00% |  |
| D | 59201 | 50423 | 0 | 0 | 0.00% | 0.00% |  |
Top three noisy pixels from each quadrant. If the there are fewer than three noisy pixels in the level2.evt file, extra rows are filled as -1
| Pixel properties | Quadrant properties | ||||||
|---|---|---|---|---|---|---|---|
| Quadrant | DetID | PixID | Counts | Sigma | Mean | Median | Sigma |
| A | 0 | 29 | 2870 | 10.66 | 798 | 749 | 198.9 |
| A | 7 | 110 | 2482 | 8.71 | 798 | 749 | 198.9 |
| A | 9 | 19 | 2302 | 7.81 | 798 | 749 | 198.9 |
| B | 2 | 9 | 2366 | 10.54 | 782 | 746 | 153.6 |
| B | 2 | 8 | 1998 | 8.15 | 782 | 746 | 153.6 |
| B | 5 | 128 | 1921 | 7.65 | 782 | 746 | 153.6 |
| C | 1 | 80 | 2246 | 7.44 | 787 | 736 | 202.9 |
| C | 1 | 81 | 2236 | 7.39 | 787 | 736 | 202.9 |
| C | 3 | 234 | 2127 | 6.86 | 787 | 736 | 202.9 |
| D | 3 | 14 | 1899 | 6.21 | 744 | 677 | 196.8 |
| D | 13 | 238 | 1877 | 6.09 | 744 | 677 | 196.8 |
| D | 6 | 231 | 1854 | 5.98 | 744 | 677 | 196.8 |
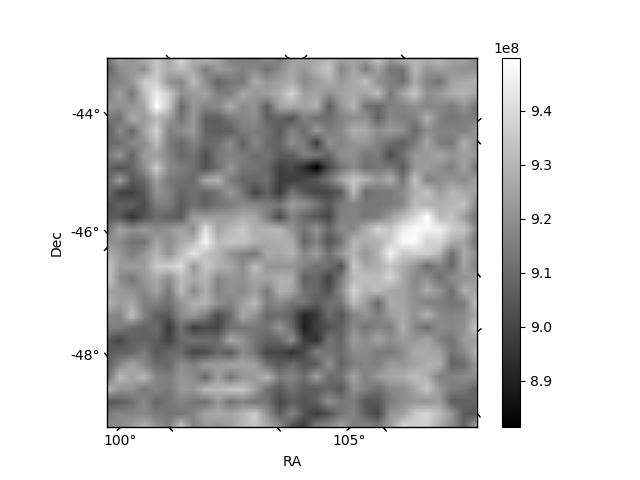
Histogram calculated using DETX and DETY for each event in the final _common_clean file
| Quadrant A | 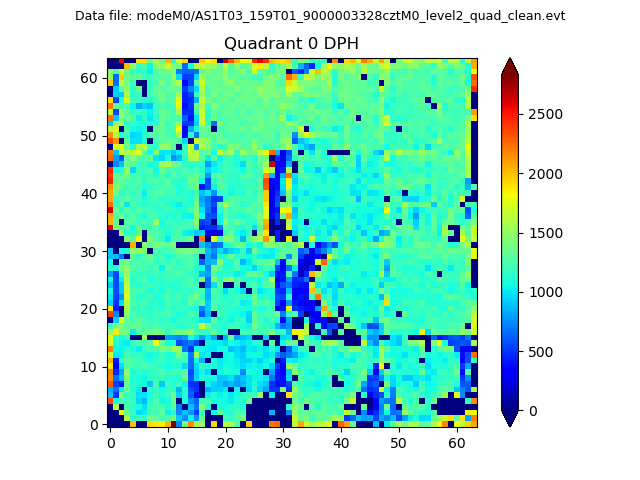 |
 |
Quadrant B |
|---|---|---|---|
| Quadrant D |  |
 |
Quadrant C |
| Plot type | Count rate plots | Images |
|---|---|---|
| Comparison with Poisson distribution Blue bars denote a histogram of data divided into 1 sec bins. Red curve is a Poisson curve with rate = median count rate of data. |
 |
 |
| Quadrant-wise count rates Data is divided into 100 sec bins |
 |
|
| Module-wise count rates for Quadrant A Data is divided into 100 sec bins |
 |
 |
| Module-wise count rates for Quadrant B Data is divided into 100 sec bins |
 |
 |
| Module-wise count rates for Quadrant C Data is divided into 100 sec bins |
 |
 |
| Module-wise count rates for Quadrant D Data is divided into 100 sec bins |
 |
 |
| Parameter | Plot |
|---|---|
| CZT HV Monitor | 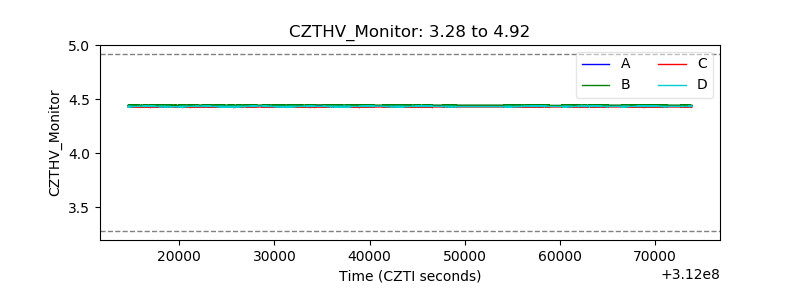 |
| D_VDD |  |
| Temperature 1 | 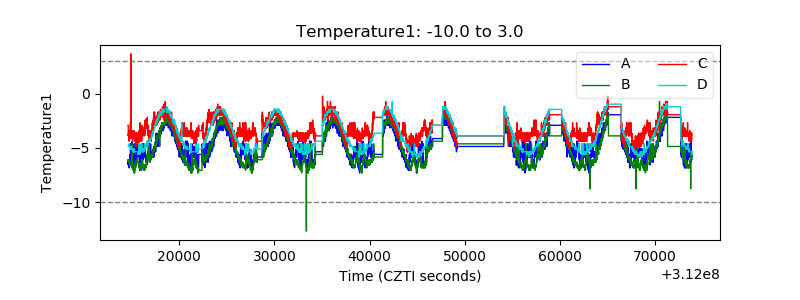 |
| Veto HV Monitor | 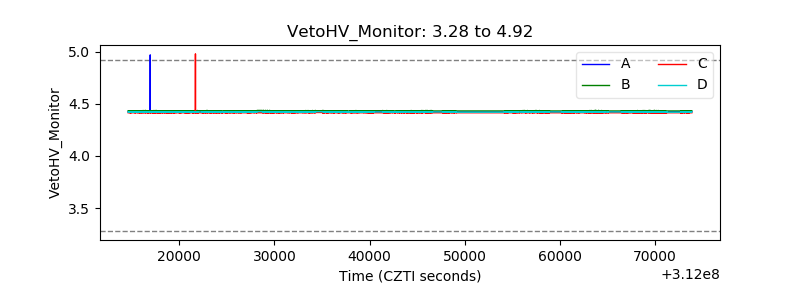 |
| Veto LLD |  |
| Alpha Counter |  |
| _CPM_Rate | 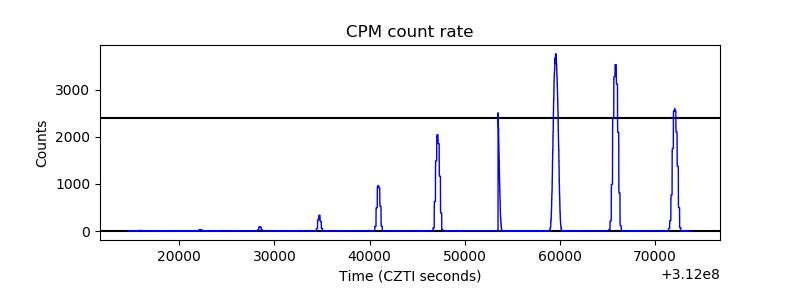 |
| CZT Counter |  |
| +2.5 Volts monitor |  |
| +5 Volts monitor | 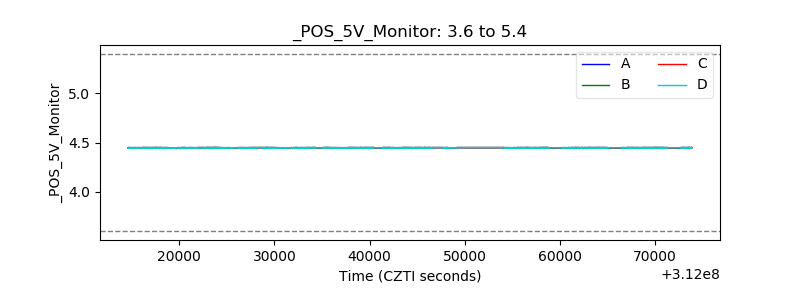 |
| _ROLL_ROT |  |
| _Roll_DEC |  |
| _Roll_RA |  |
| Veto Counter | 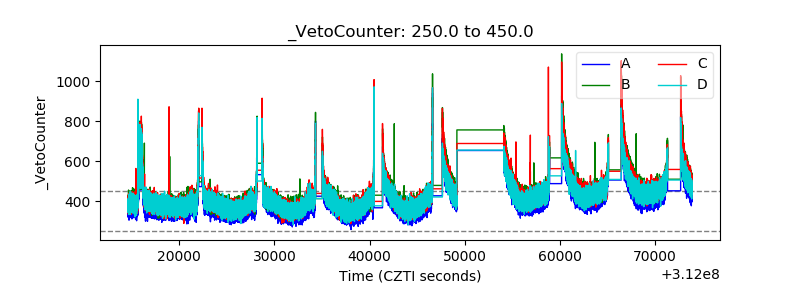 |