| Param | Original file | Final file |
|---|---|---|
| Filename | modeM0/AS1T03_159T01_9000003328_22426cztM0_level2.evt | modeM0/AS1T03_159T01_9000003328_22426cztM0_level2_quad_clean.evt |
| Size (bytes) | 196,387,200 | 48,954,240 |
| Size | 187.3 MB | 46.7 MB |
| Events in quadrant A | 1,401,945 | 325,441 |
| Events in quadrant B | 1,510,381 | 331,468 |
| Events in quadrant C | 1,437,923 | 312,780 |
| Events in quadrant D | 1,402,210 | 309,678 |
| Mode M9 | |||
|---|---|---|---|
| Quadrant | BADHDUFLAG | Total packets | Discarded packets |
| A | 0 | 1 | 0 |
| B | 0 | 1 | 0 |
| C | 0 | 1 | 0 |
| D | 0 | 1 | 0 |
| Mode SS | |||
|---|---|---|---|
| Quadrant | BADHDUFLAG | Total packets | Discarded packets |
| A | 0 | 60 | 0 |
| B | 0 | 60 | 0 |
| C | 0 | 60 | 0 |
| D | 0 | 60 | 0 |
| Mode M0 | |||
|---|---|---|---|
| Quadrant | BADHDUFLAG | Total packets | Discarded packets |
| A | 0 | 6050 | 1 |
| B | 0 | 6311 | 1 |
| C | 0 | 6070 | 1 |
| D | 0 | 6159 | 1 |
| Quadrant | Total seconds | Saturated seconds | Saturation percentage |
|---|---|---|---|
| A | 2829 | 189 | 6.680806% |
| B | 2829 | 212 | 7.493814% |
| C | 2829 | 214 | 7.564510% |
| D | 2829 | 163 | 5.761753% |
Noise dominated data is calculated using 1-second bins in cleaned event files. If a bin has >2000 counts, and if more than 50% of those come from <1% of pixels, then it is considered to be noise-dominated and hence unusable.
| Quadrant | # 1 sec bins | Bins with >0 counts | Bins with >2000 counts | High rate bins dominated by noise | Noise dominated (total time) | Noise dominated (detector-on time) | Marked lightcurve |
|---|---|---|---|---|---|---|---|
| A | 2964 | 2829 | 0 | 0 | 0.00% | 0.00% | 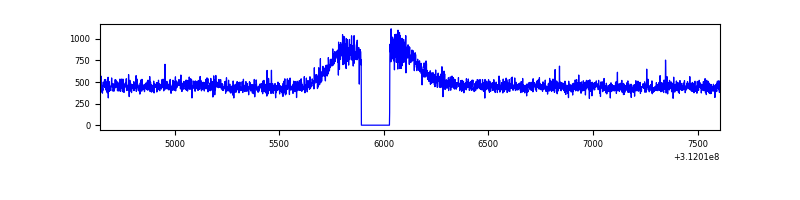 |
| B | 2964 | 2829 | 1 | 1 | 0.03% | 0.04% | 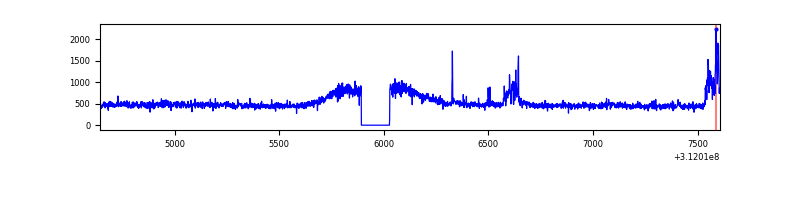 |
| C | 2964 | 2829 | 0 | 0 | 0.00% | 0.00% | 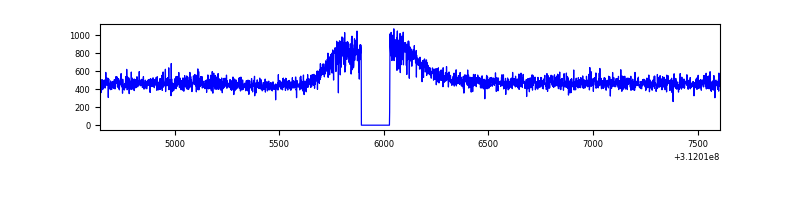 |
| D | 2964 | 2830 | 3 | 3 | 0.10% | 0.11% | 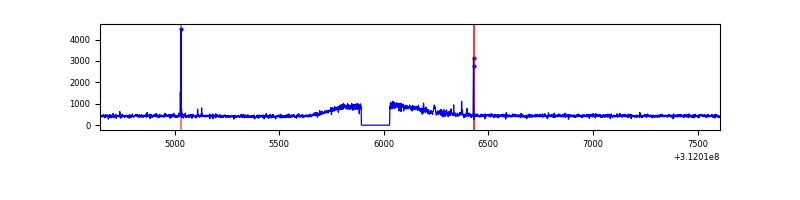 |
Top three noisy pixels from each quadrant. If the there are fewer than three noisy pixels in the level2.evt file, extra rows are filled as -1
| Pixel properties | Quadrant properties | ||||||
|---|---|---|---|---|---|---|---|
| Quadrant | DetID | PixID | Counts | Sigma | Mean | Median | Sigma |
| A | 13 | 254 | 4012 | 48.32 | 363 | 354 | 75.7 |
| A | 3 | 137 | 3386 | 40.05 | 363 | 354 | 75.7 |
| A | 0 | 226 | 2952 | 34.32 | 363 | 354 | 75.7 |
| B | 0 | 244 | 90939 | 1230.33 | 361 | 349 | 73.6 |
| B | 12 | 111 | 9168 | 119.77 | 361 | 349 | 73.6 |
| B | 11 | 111 | 7830 | 101.6 | 361 | 349 | 73.6 |
| C | 14 | 238 | 53304 | 621.46 | 353 | 353 | 85.2 |
| C | 8 | 128 | 4545 | 49.2 | 353 | 353 | 85.2 |
| C | 13 | 61 | 2487 | 25.05 | 353 | 353 | 85.2 |
| D | 7 | 223 | 28365 | 315.98 | 359 | 347 | 88.7 |
| D | 2 | 234 | 11162 | 121.97 | 359 | 347 | 88.7 |
| D | 5 | 32 | 8795 | 95.27 | 359 | 347 | 88.7 |
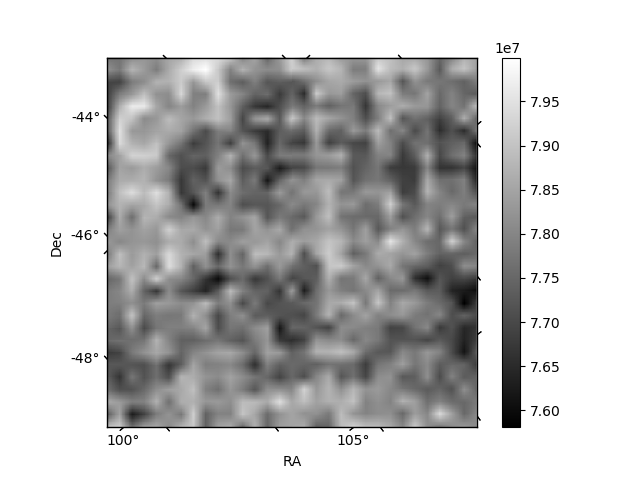
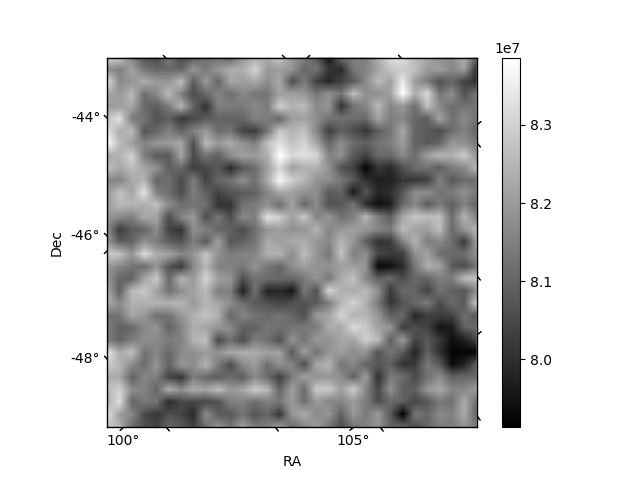
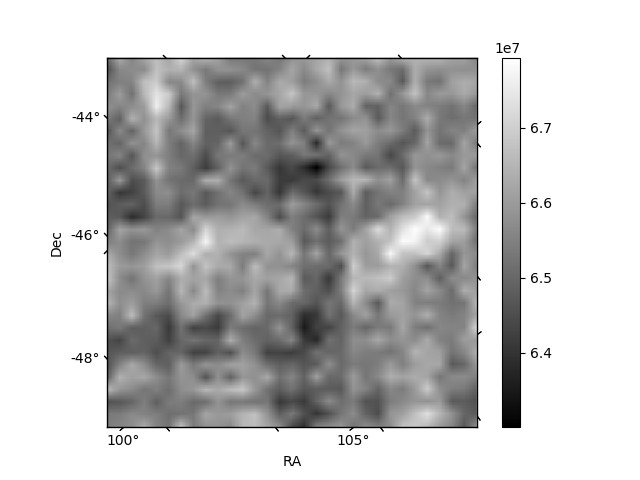
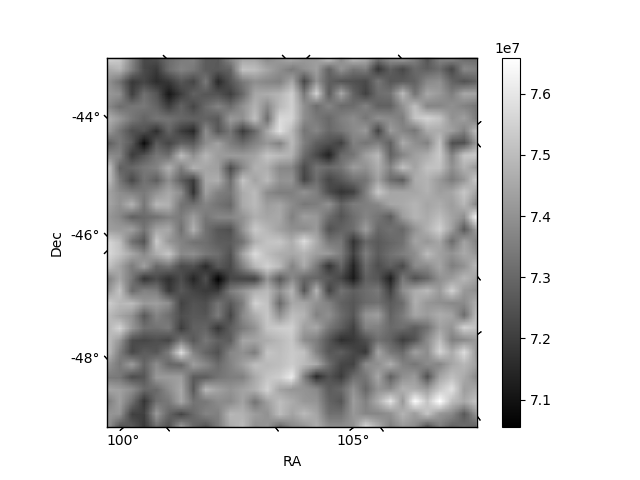
Histogram calculated using DETX and DETY for each event in the final _common_clean file
| Quadrant A | 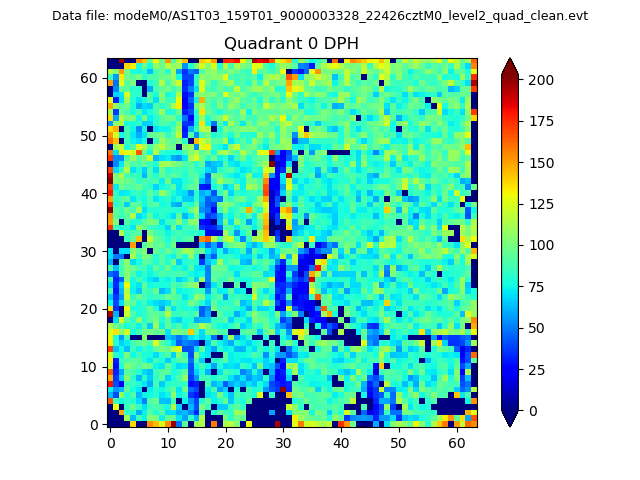 |
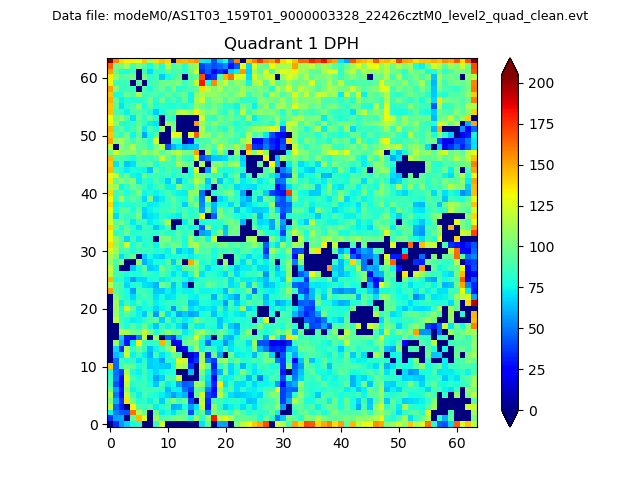 |
Quadrant B |
|---|---|---|---|
| Quadrant D |  |
 |
Quadrant C |
| Plot type | Count rate plots | Images |
|---|---|---|
| Comparison with Poisson distribution Blue bars denote a histogram of data divided into 1 sec bins. Red curve is a Poisson curve with rate = median count rate of data. |
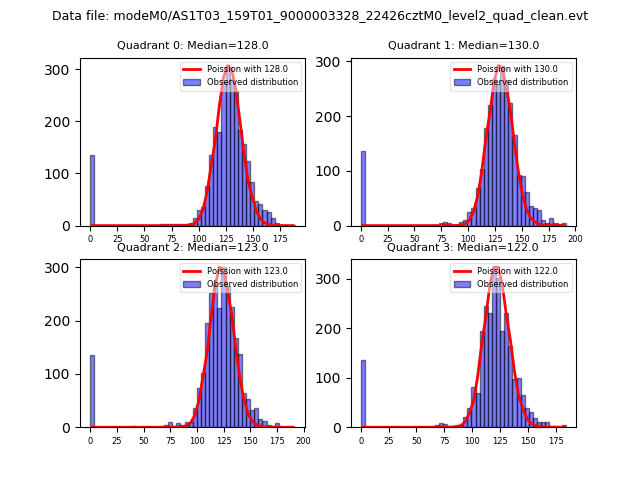 |
 |
| Quadrant-wise count rates Data is divided into 100 sec bins |
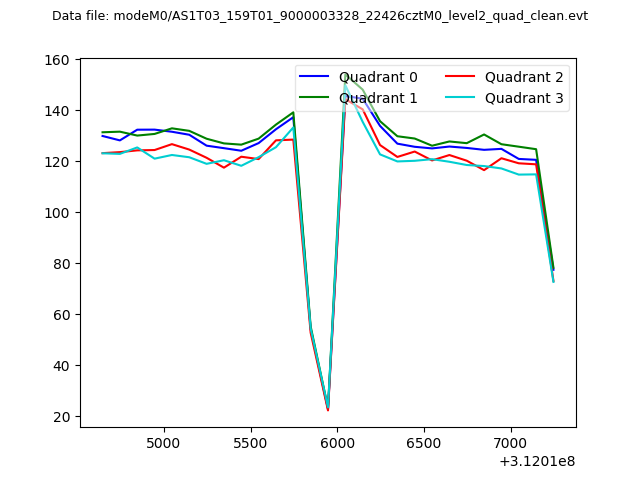 |
|
| Module-wise count rates for Quadrant A Data is divided into 100 sec bins |
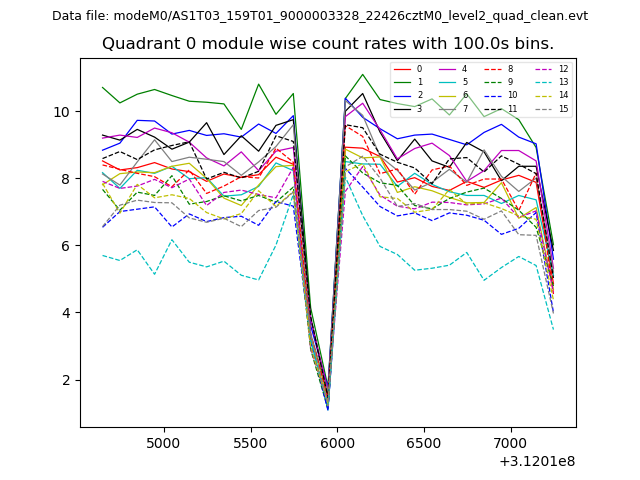 |
 |
| Module-wise count rates for Quadrant B Data is divided into 100 sec bins |
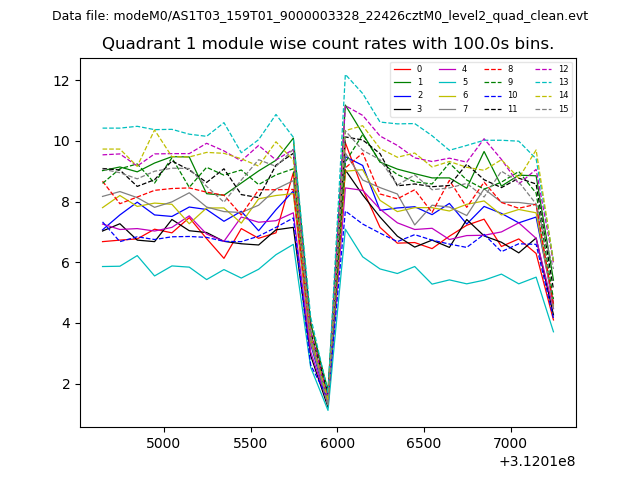 |
 |
| Module-wise count rates for Quadrant C Data is divided into 100 sec bins |
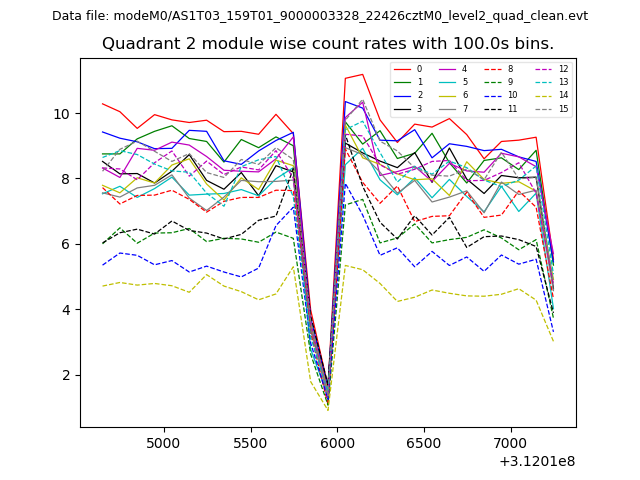 |
 |
| Module-wise count rates for Quadrant D Data is divided into 100 sec bins |
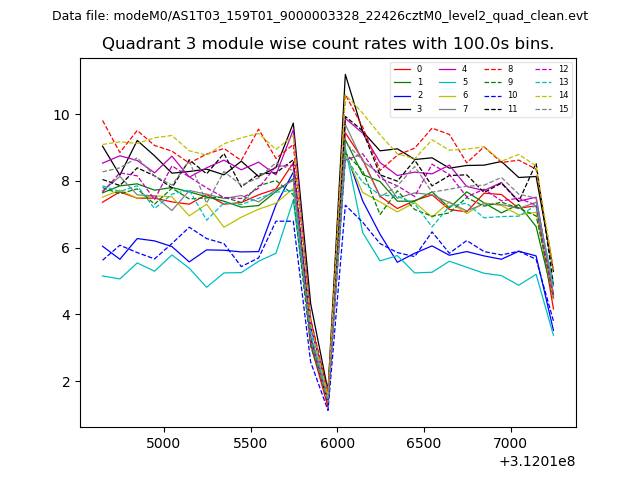 |
 |
| Parameter | Plot |
|---|---|
| CZT HV Monitor | 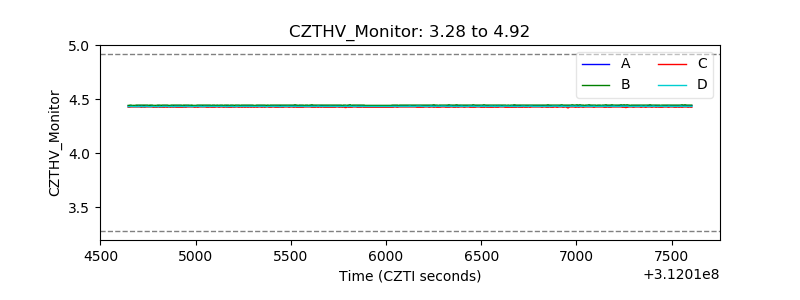 |
| D_VDD | 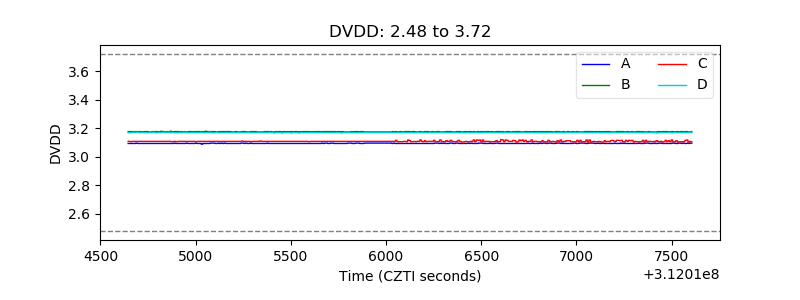 |
| Temperature 1 | 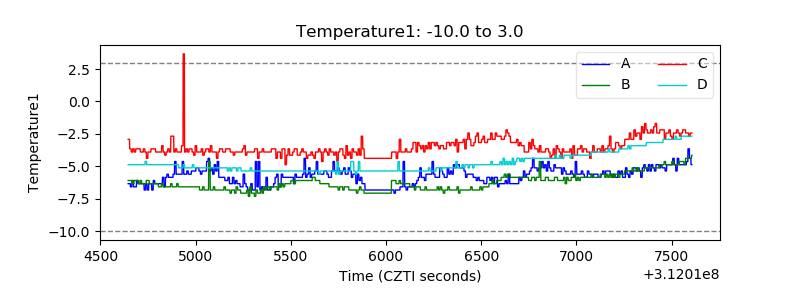 |
| Veto HV Monitor | 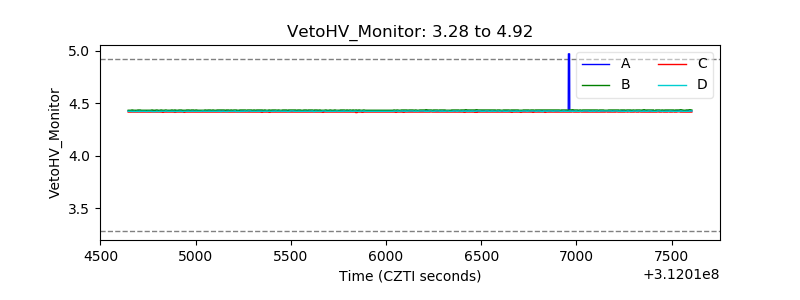 |
| Veto LLD | 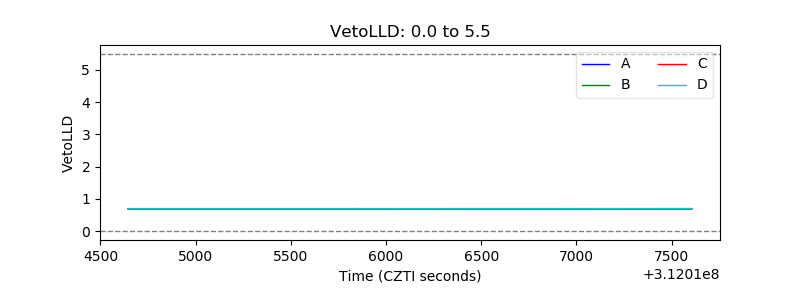 |
| Alpha Counter | 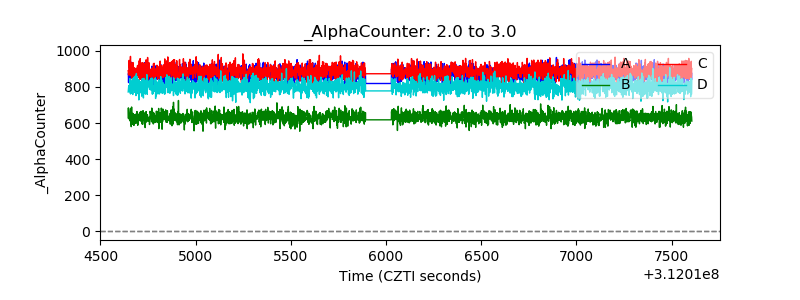 |
| _CPM_Rate | 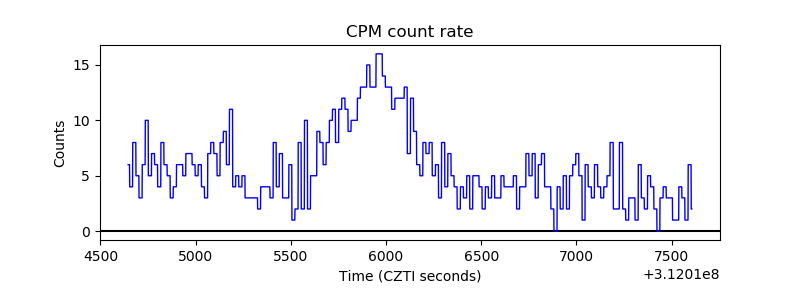 |
| CZT Counter |  |
| +2.5 Volts monitor |  |
| +5 Volts monitor |  |
| _ROLL_ROT | 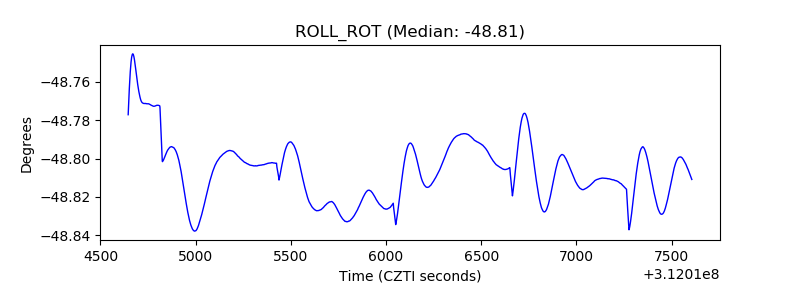 |
| _Roll_DEC | 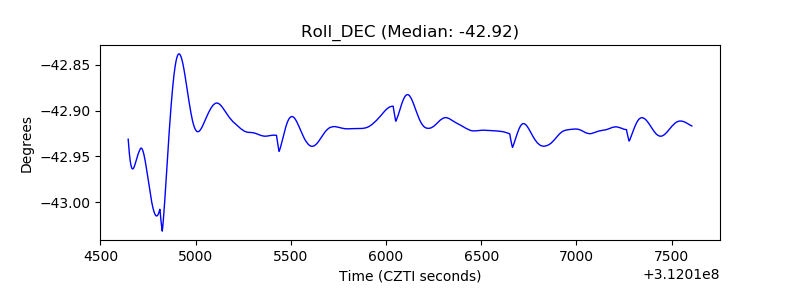 |
| _Roll_RA | 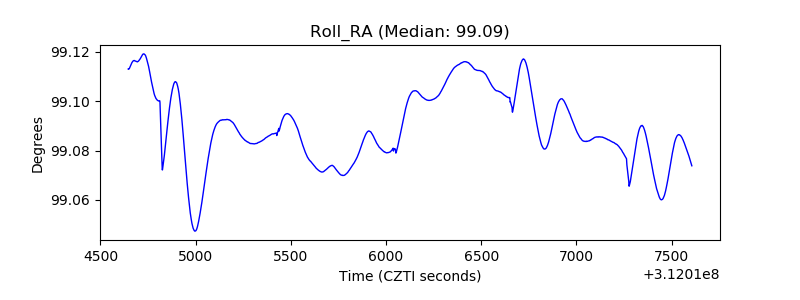 |
| Veto Counter | 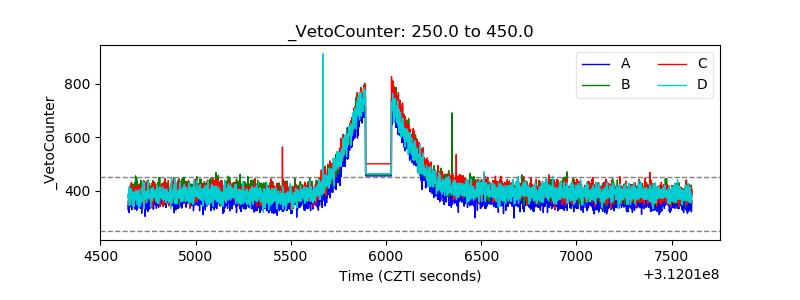 |