| Param | Original file | Final file |
|---|---|---|
| Filename | modeM0/AS1T03_159T01_9000003328_22427cztM0_level2.evt | modeM0/AS1T03_159T01_9000003328_22427cztM0_level2_quad_clean.evt |
| Size (bytes) | 519,370,560 | 98,058,240 |
| Size | 495.3 MB | 93.5 MB |
| Events in quadrant A | 3,612,472 | 616,814 |
| Events in quadrant B | 4,085,803 | 629,473 |
| Events in quadrant C | 3,699,195 | 597,992 |
| Events in quadrant D | 3,810,725 | 591,652 |
| Mode M9 | |||
|---|---|---|---|
| Quadrant | BADHDUFLAG | Total packets | Discarded packets |
| A | 0 | 4 | 0 |
| B | 0 | 4 | 0 |
| C | 0 | 4 | 0 |
| D | 0 | 4 | 0 |
| Mode SS | |||
|---|---|---|---|
| Quadrant | BADHDUFLAG | Total packets | Discarded packets |
| A | 0 | 154 | 0 |
| B | 0 | 154 | 0 |
| C | 0 | 154 | 0 |
| D | 0 | 154 | 0 |
| Mode M0 | |||
|---|---|---|---|
| Quadrant | BADHDUFLAG | Total packets | Discarded packets |
| A | 0 | 15858 | 2 |
| B | 0 | 17137 | 2 |
| C | 0 | 15899 | 2 |
| D | 0 | 16540 | 2 |
| Quadrant | Total seconds | Saturated seconds | Saturation percentage |
|---|---|---|---|
| A | 7672 | 187 | 2.437435% |
| B | 7673 | 236 | 3.075720% |
| C | 7673 | 217 | 2.828099% |
| D | 7673 | 160 | 2.085234% |
Noise dominated data is calculated using 1-second bins in cleaned event files. If a bin has >2000 counts, and if more than 50% of those come from <1% of pixels, then it is considered to be noise-dominated and hence unusable.
| Quadrant | # 1 sec bins | Bins with >0 counts | Bins with >2000 counts | High rate bins dominated by noise | Noise dominated (total time) | Noise dominated (detector-on time) | Marked lightcurve |
|---|---|---|---|---|---|---|---|
| A | 8007 | 7672 | 0 | 0 | 0.00% | 0.00% | 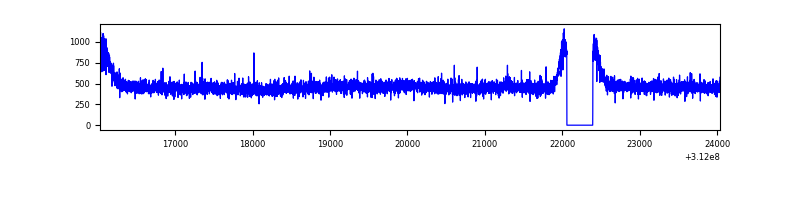 |
| B | 8008 | 7673 | 7 | 7 | 0.09% | 0.09% | 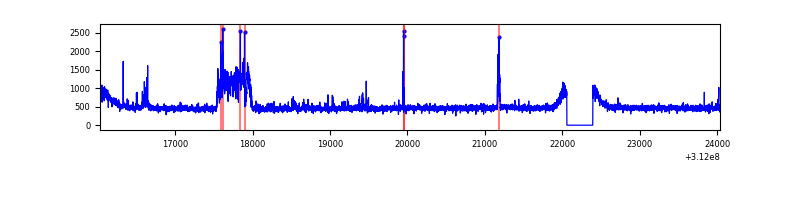 |
| C | 8008 | 7673 | 0 | 0 | 0.00% | 0.00% | 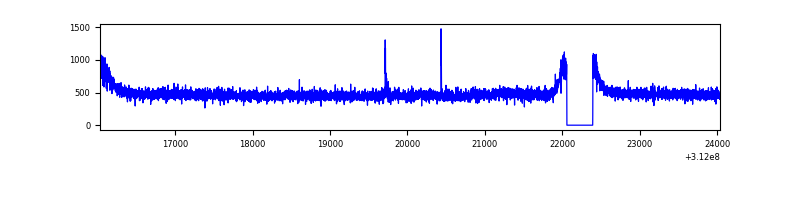 |
| D | 8008 | 7673 | 10 | 10 | 0.12% | 0.13% | 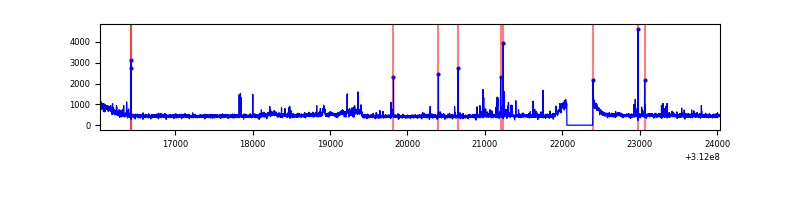 |
Top three noisy pixels from each quadrant. If the there are fewer than three noisy pixels in the level2.evt file, extra rows are filled as -1
| Pixel properties | Quadrant properties | ||||||
|---|---|---|---|---|---|---|---|
| Quadrant | DetID | PixID | Counts | Sigma | Mean | Median | Sigma |
| A | 15 | 174 | 15827 | 79.17 | 932 | 909 | 188.4 |
| A | 13 | 254 | 10767 | 52.32 | 932 | 909 | 188.4 |
| A | 3 | 137 | 8576 | 40.69 | 932 | 909 | 188.4 |
| B | 0 | 244 | 376135 | 2066.46 | 927 | 899 | 181.6 |
| B | 4 | 173 | 35359 | 189.77 | 927 | 899 | 181.6 |
| B | 12 | 111 | 22437 | 118.61 | 927 | 899 | 181.6 |
| C | 14 | 238 | 139550 | 652.17 | 903 | 906 | 212.6 |
| C | 9 | 54 | 15241 | 67.43 | 903 | 906 | 212.6 |
| C | 8 | 128 | 13936 | 61.29 | 903 | 906 | 212.6 |
| D | 12 | 218 | 145180 | 649.29 | 916 | 888 | 222.2 |
| D | 2 | 136 | 51369 | 227.16 | 916 | 888 | 222.2 |
| D | 13 | 104 | 46890 | 207.0 | 916 | 888 | 222.2 |
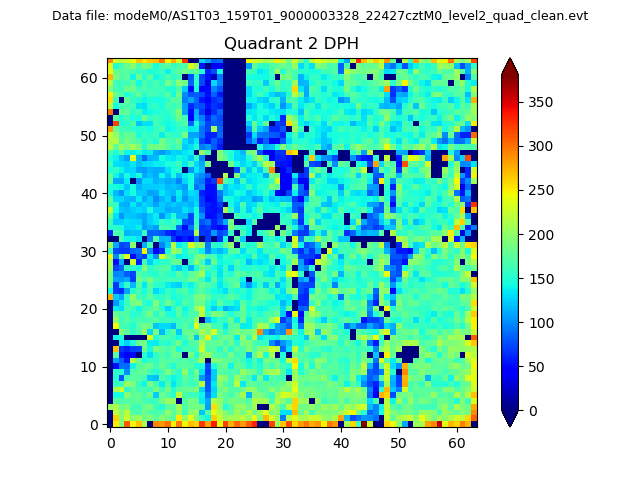
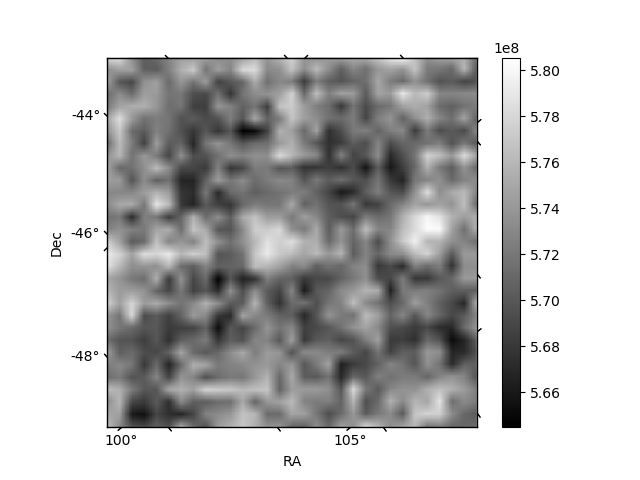
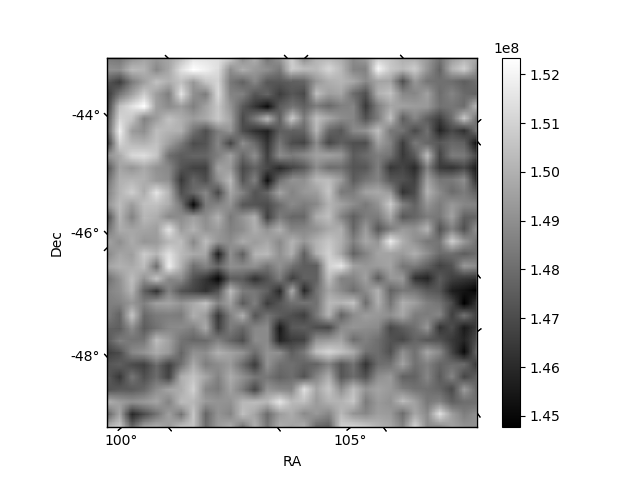
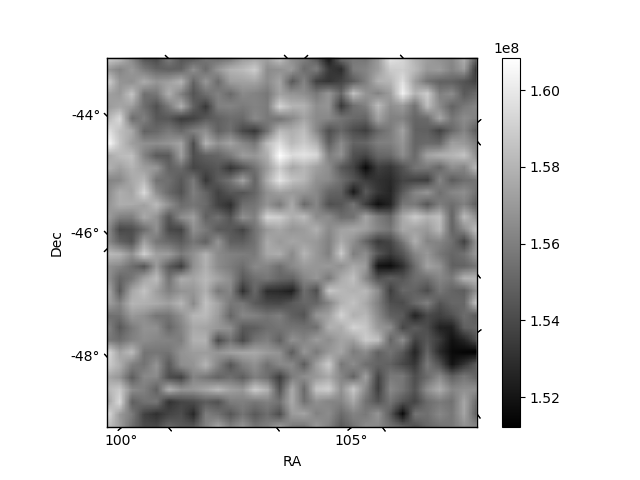
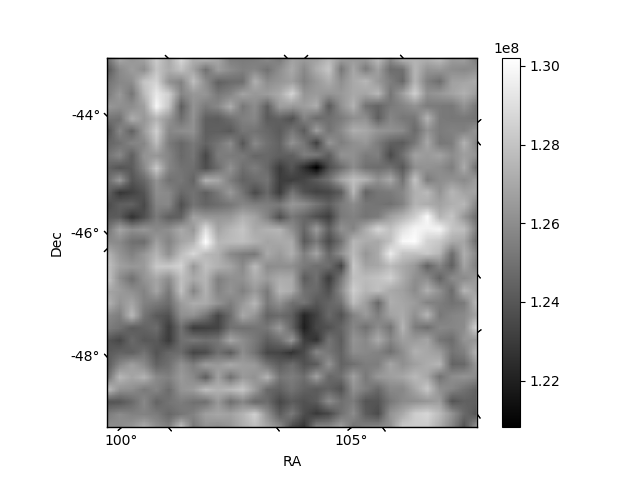
Histogram calculated using DETX and DETY for each event in the final _common_clean file
| Quadrant A | 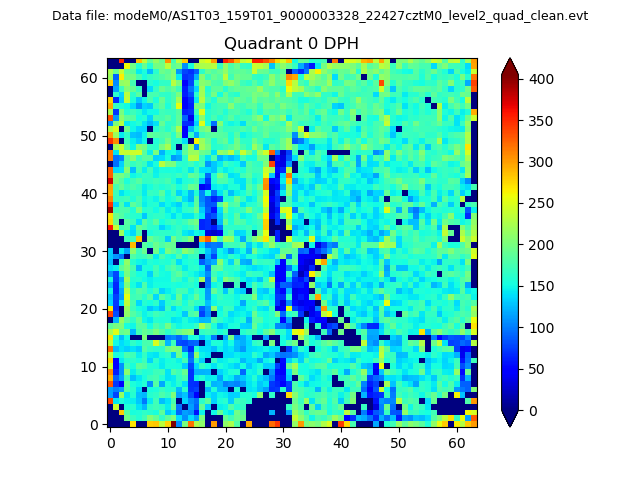 |
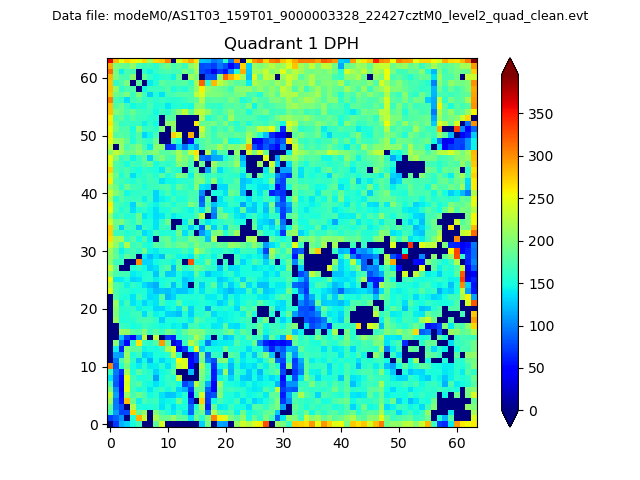 |
Quadrant B |
|---|---|---|---|
| Quadrant D | 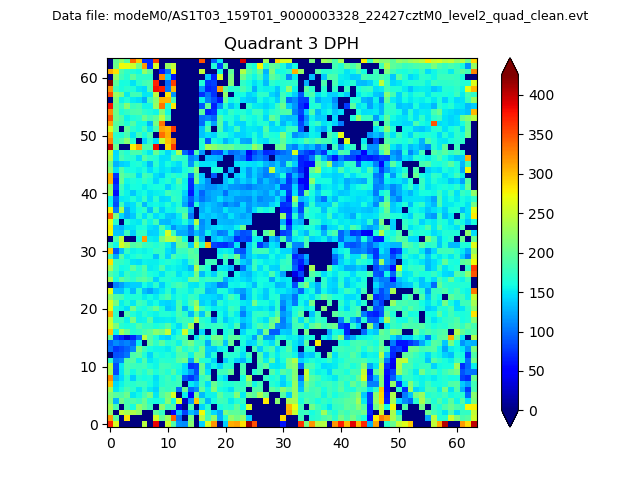 |
 |
Quadrant C |
| Plot type | Count rate plots | Images |
|---|---|---|
| Comparison with Poisson distribution Blue bars denote a histogram of data divided into 1 sec bins. Red curve is a Poisson curve with rate = median count rate of data. |
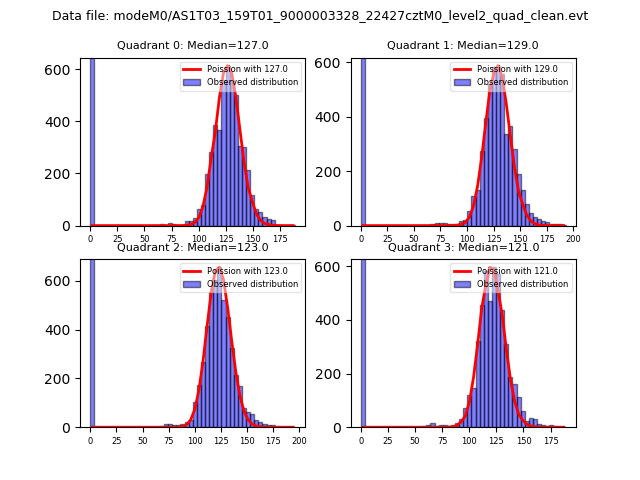 |
 |
| Quadrant-wise count rates Data is divided into 100 sec bins |
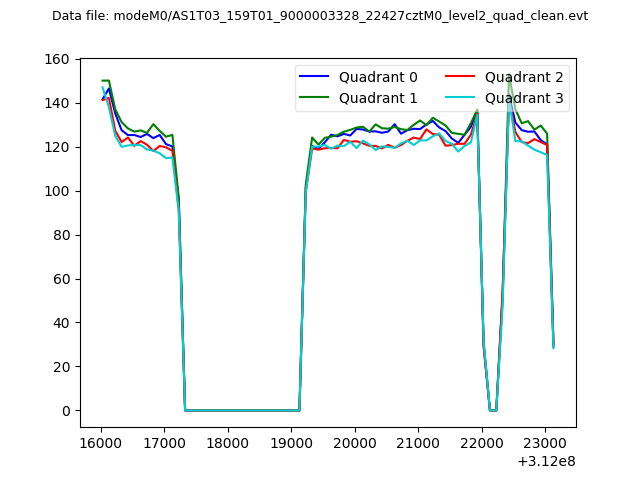 |
|
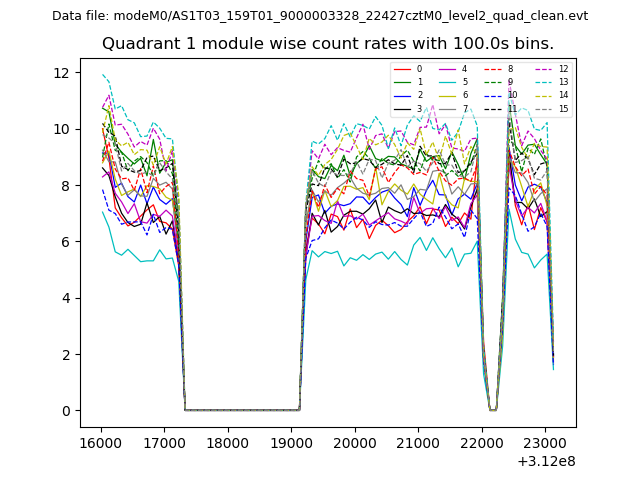
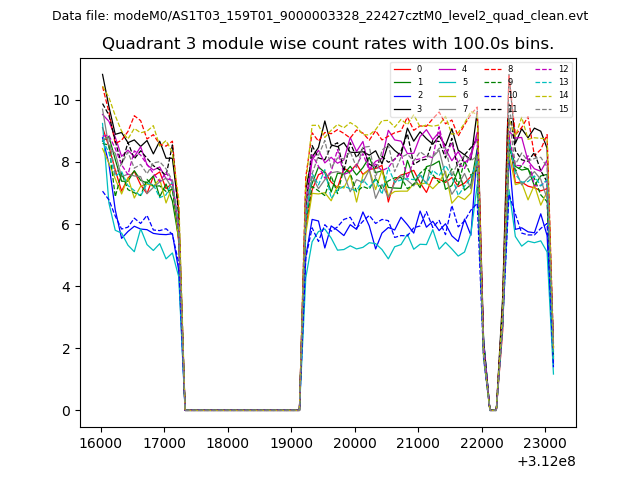
| Module-wise count rates for Quadrant A Data is divided into 100 sec bins |
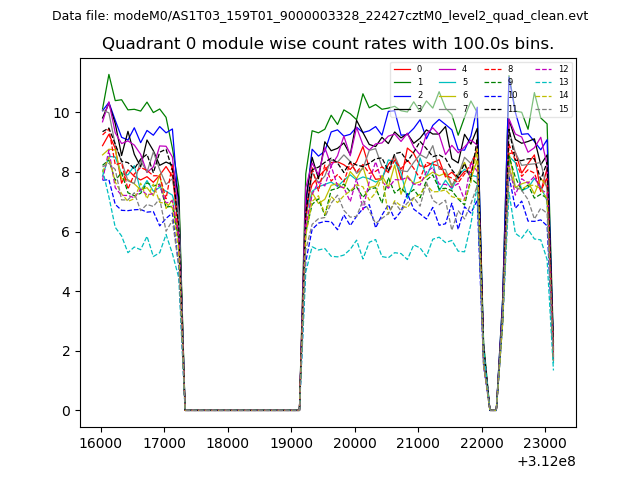 |
 |
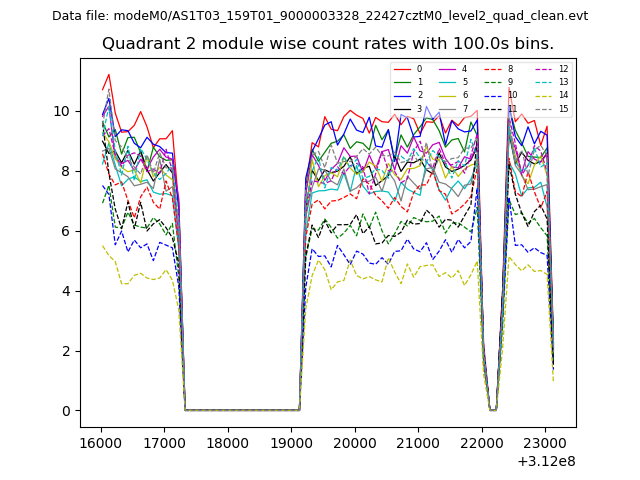
| Module-wise count rates for Quadrant B Data is divided into 100 sec bins |
 |
 |
| Module-wise count rates for Quadrant C Data is divided into 100 sec bins |
 |
 |
| Module-wise count rates for Quadrant D Data is divided into 100 sec bins |
 |
 |
| Parameter | Plot |
|---|---|
| CZT HV Monitor | 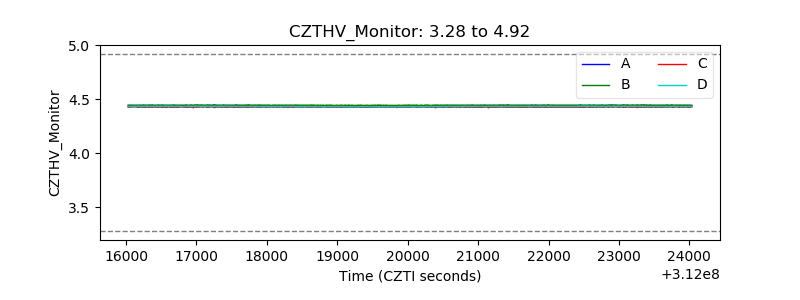 |
| D_VDD | 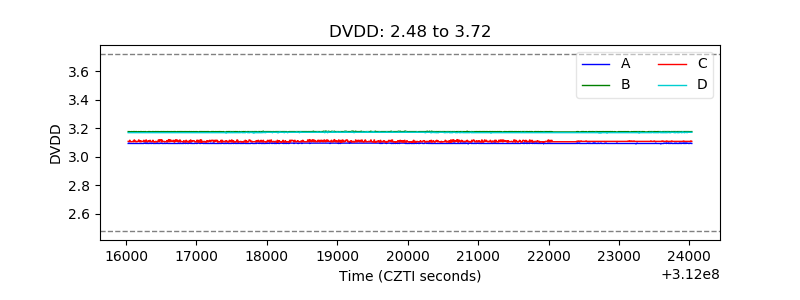 |
| Temperature 1 | 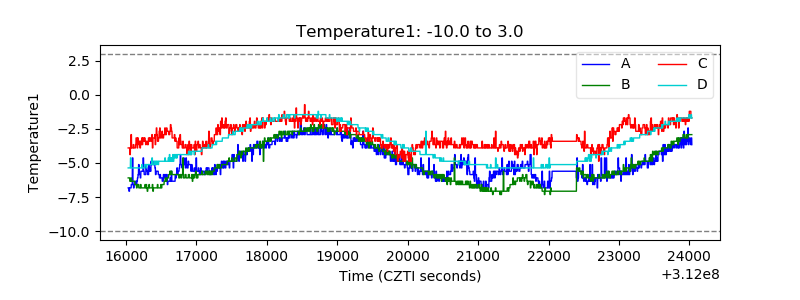 |
| Veto HV Monitor | 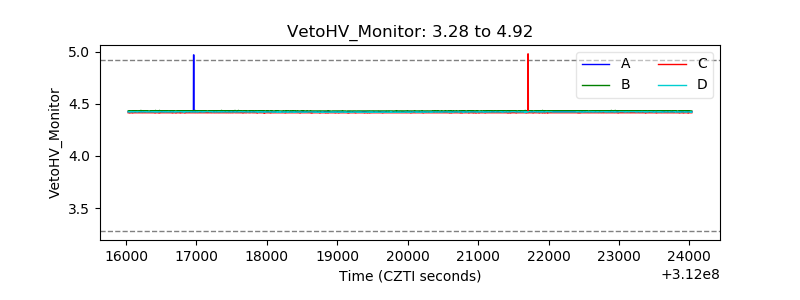 |
| Veto LLD | 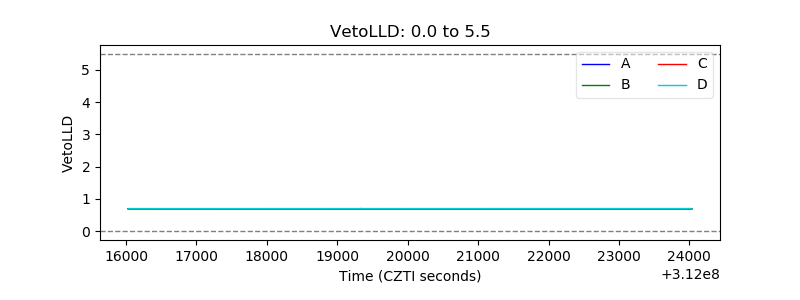 |
| Alpha Counter | 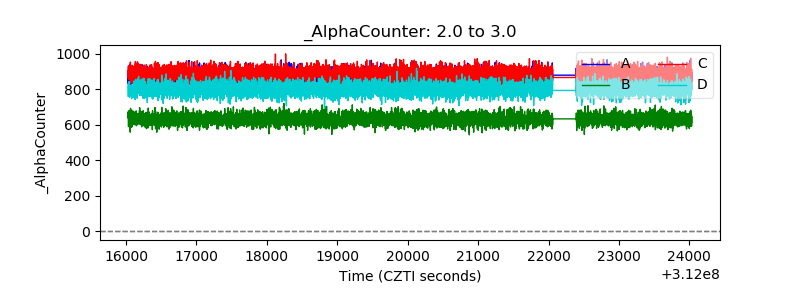 |
| _CPM_Rate | 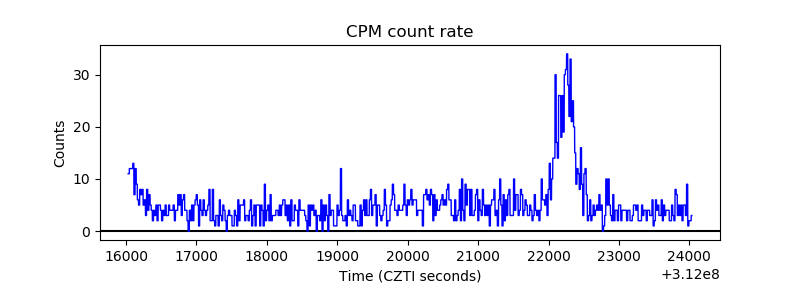 |
| CZT Counter | 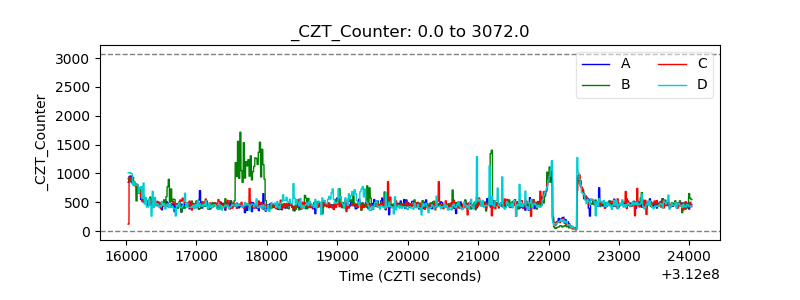 |
| +2.5 Volts monitor |  |
| +5 Volts monitor |  |
| _ROLL_ROT | 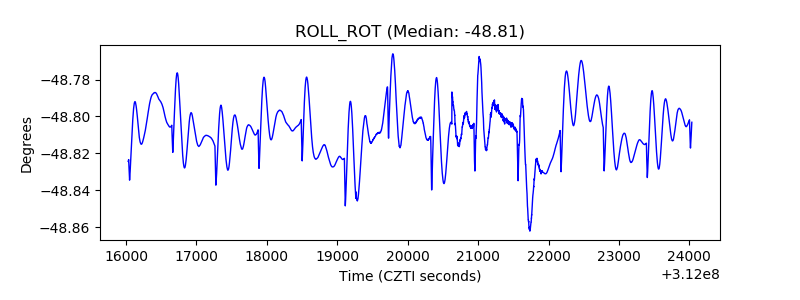 |
| _Roll_DEC | 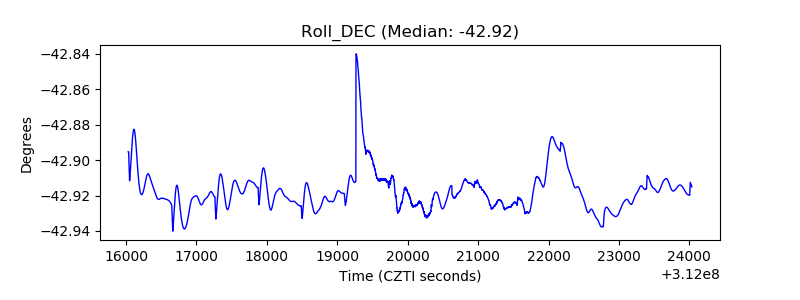 |
| _Roll_RA | 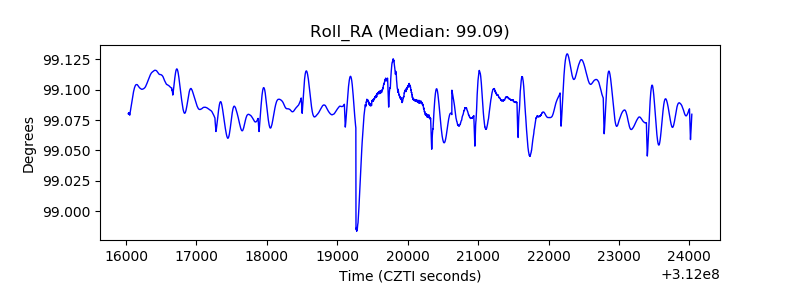 |
| Veto Counter | 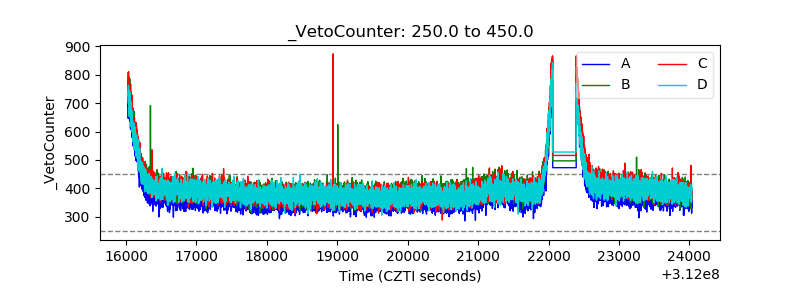 |