| Param | Original file | Final file |
|---|---|---|
| Filename | modeM0/AS1T03_159T01_9000003328_22430cztM0_level2.evt | modeM0/AS1T03_159T01_9000003328_22430cztM0_level2_quad_clean.evt |
| Size (bytes) | 880,297,920 | 154,010,880 |
| Size | 839.5 MB | 146.9 MB |
| Events in quadrant A | 6,158,033 | 953,194 |
| Events in quadrant B | 6,602,082 | 965,180 |
| Events in quadrant C | 6,208,425 | 921,552 |
| Events in quadrant D | 6,797,726 | 912,264 |
| Mode M9 | |||
|---|---|---|---|
| Quadrant | BADHDUFLAG | Total packets | Discarded packets |
| A | 0 | 14 | 0 |
| B | 0 | 15 | 0 |
| C | 0 | 15 | 0 |
| D | 0 | 15 | 0 |
| Mode SS | |||
|---|---|---|---|
| Quadrant | BADHDUFLAG | Total packets | Discarded packets |
| A | 0 | 268 | 0 |
| B | 0 | 268 | 0 |
| C | 0 | 268 | 0 |
| D | 0 | 268 | 0 |
| Mode M0 | |||
|---|---|---|---|
| Quadrant | BADHDUFLAG | Total packets | Discarded packets |
| A | 0 | 27004 | 3 |
| B | 0 | 28068 | 3 |
| C | 0 | 27025 | 3 |
| D | 0 | 29034 | 7 |
| Quadrant | Total seconds | Saturated seconds | Saturation percentage |
|---|---|---|---|
| A | 13197 | 162 | 1.227552% |
| B | 13197 | 218 | 1.651891% |
| C | 13197 | 213 | 1.614003% |
| D | 13196 | 150 | 1.136708% |
Noise dominated data is calculated using 1-second bins in cleaned event files. If a bin has >2000 counts, and if more than 50% of those come from <1% of pixels, then it is considered to be noise-dominated and hence unusable.
| Quadrant | # 1 sec bins | Bins with >0 counts | Bins with >2000 counts | High rate bins dominated by noise | Noise dominated (total time) | Noise dominated (detector-on time) | Marked lightcurve |
|---|---|---|---|---|---|---|---|
| A | 14437 | 13197 | 0 | 0 | 0.00% | 0.00% | 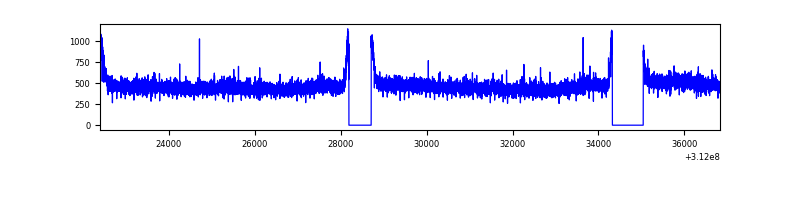 |
| B | 14437 | 13198 | 29 | 29 | 0.20% | 0.22% | 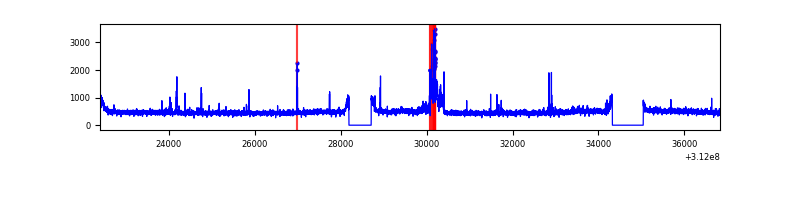 |
| C | 14437 | 13198 | 0 | 0 | 0.00% | 0.00% | 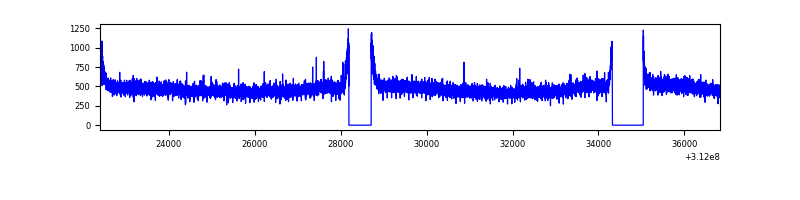 |
| D | 14436 | 13198 | 16 | 16 | 0.11% | 0.12% | 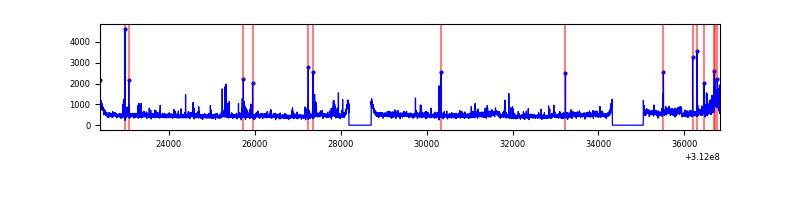 |
Top three noisy pixels from each quadrant. If the there are fewer than three noisy pixels in the level2.evt file, extra rows are filled as -1
| Pixel properties | Quadrant properties | ||||||
|---|---|---|---|---|---|---|---|
| Quadrant | DetID | PixID | Counts | Sigma | Mean | Median | Sigma |
| A | 6 | 240 | 27739 | 82.29 | 1581 | 1544 | 318.3 |
| A | 15 | 174 | 27710 | 82.2 | 1581 | 1544 | 318.3 |
| A | 13 | 254 | 17820 | 51.13 | 1581 | 1544 | 318.3 |
| B | 6 | 36 | 287676 | 946.98 | 1574 | 1529 | 302.2 |
| B | 0 | 244 | 61031 | 196.92 | 1574 | 1529 | 302.2 |
| B | 4 | 173 | 40483 | 128.92 | 1574 | 1529 | 302.2 |
| C | 14 | 238 | 240096 | 670.97 | 1526 | 1537 | 355.5 |
| C | 1 | 16 | 12692 | 31.37 | 1526 | 1537 | 355.5 |
| C | 13 | 61 | 10650 | 25.63 | 1526 | 1537 | 355.5 |
| D | 7 | 223 | 505433 | 1354.0 | 1546 | 1505 | 372.2 |
| D | 1 | 52 | 216475 | 577.6 | 1546 | 1505 | 372.2 |
| D | 13 | 172 | 63075 | 165.43 | 1546 | 1505 | 372.2 |
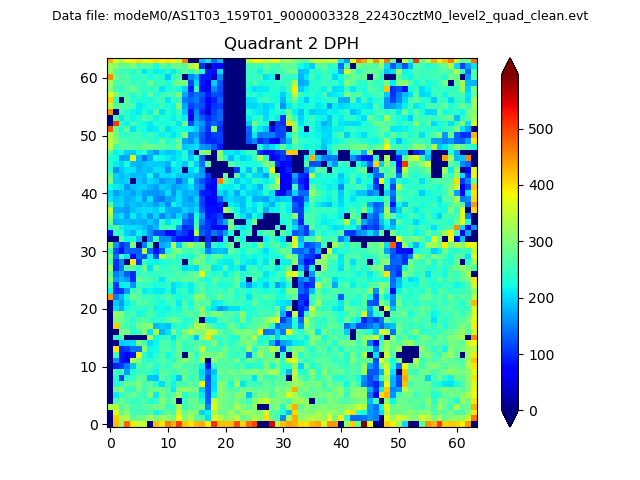
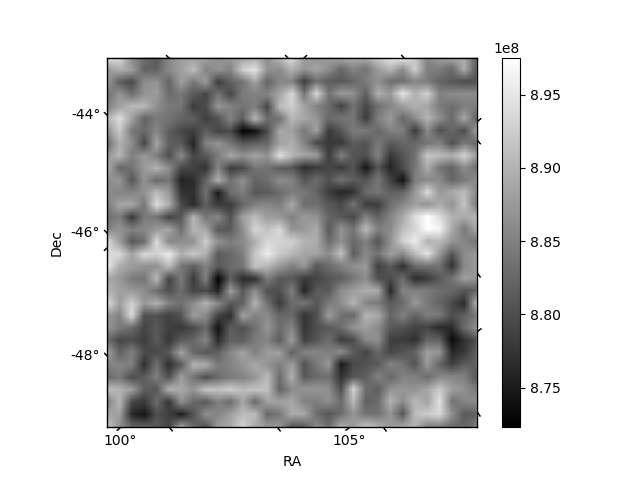
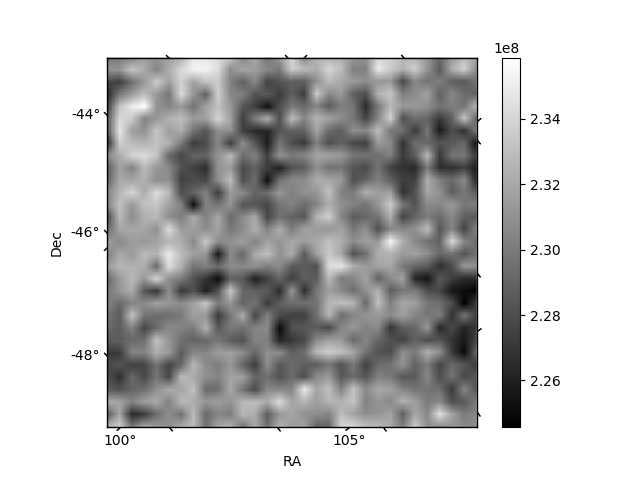
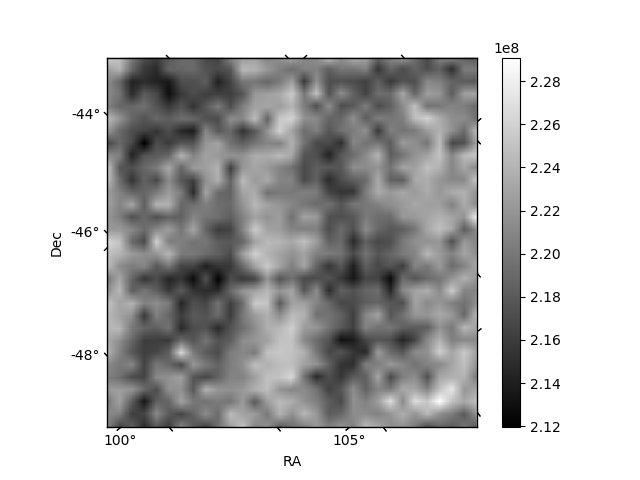
Histogram calculated using DETX and DETY for each event in the final _common_clean file
| Quadrant A | 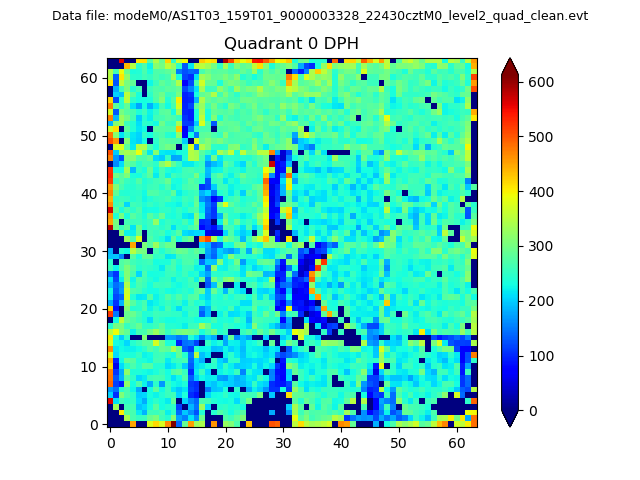 |
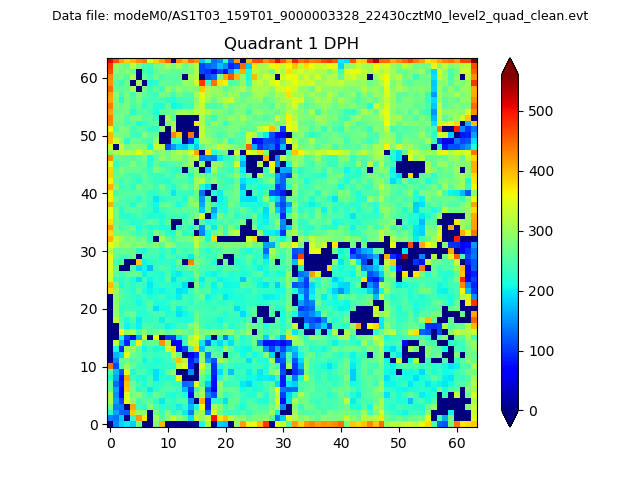 |
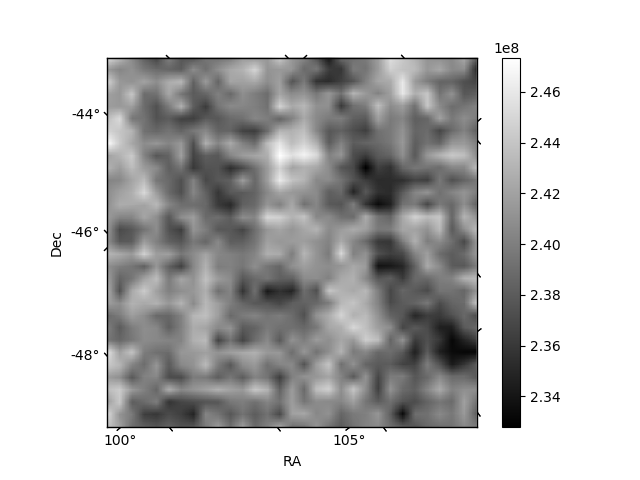
Quadrant B |
|---|---|---|---|
| Quadrant D | 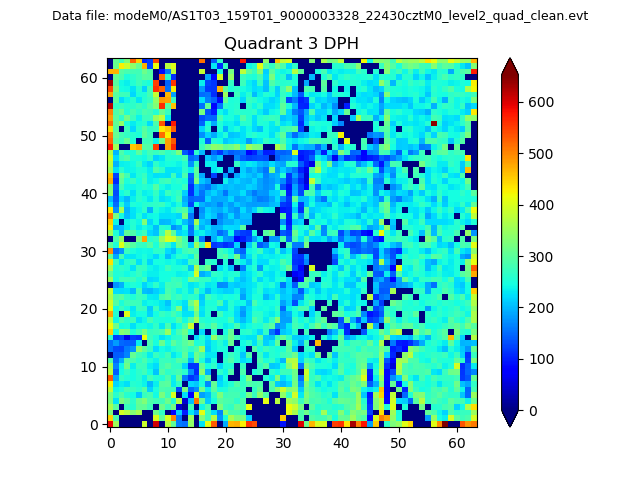 |
 |
Quadrant C |
| Plot type | Count rate plots | Images |
|---|---|---|
| Comparison with Poisson distribution Blue bars denote a histogram of data divided into 1 sec bins. Red curve is a Poisson curve with rate = median count rate of data. |
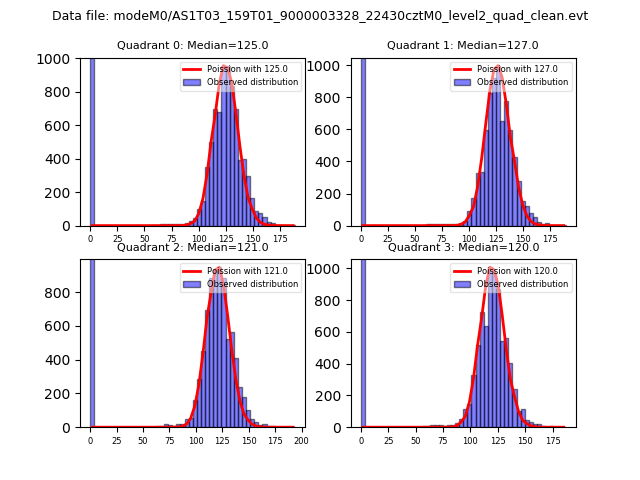 |
 |
| Quadrant-wise count rates Data is divided into 100 sec bins |
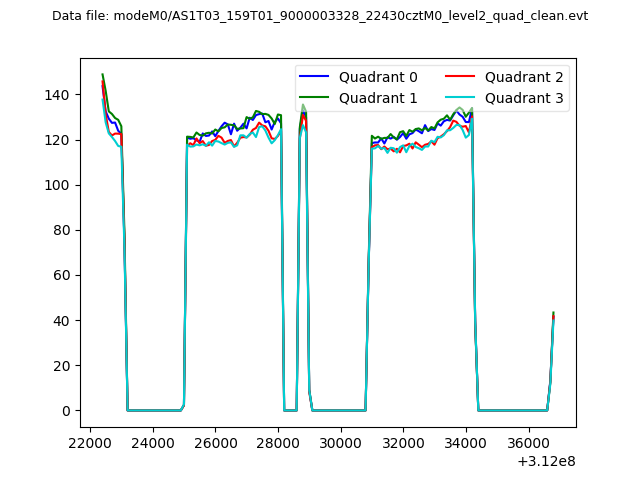 |
|
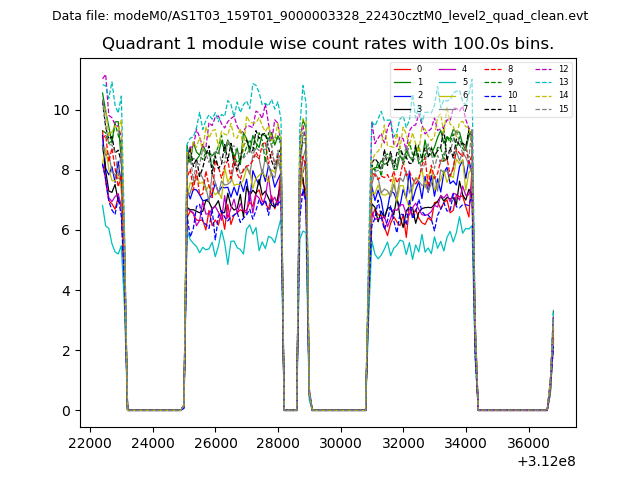
| Module-wise count rates for Quadrant A Data is divided into 100 sec bins |
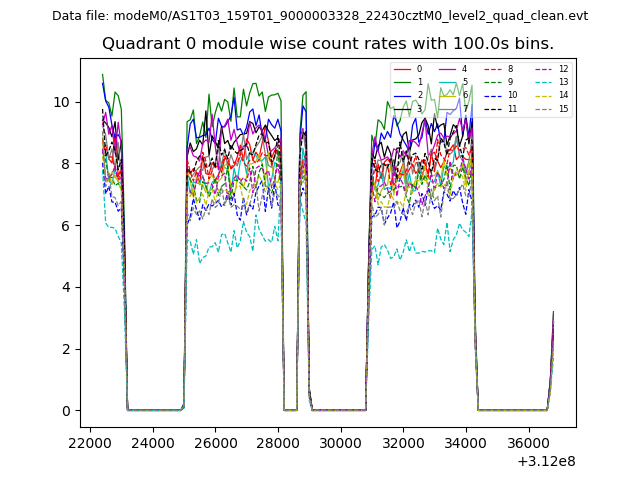 |
 |
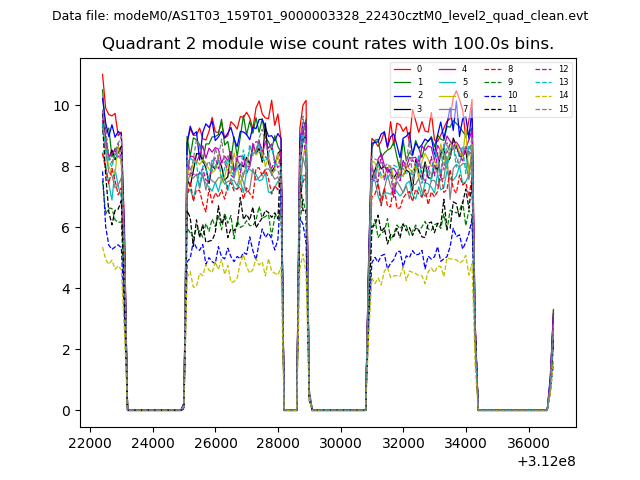
| Module-wise count rates for Quadrant B Data is divided into 100 sec bins |
 |
 |
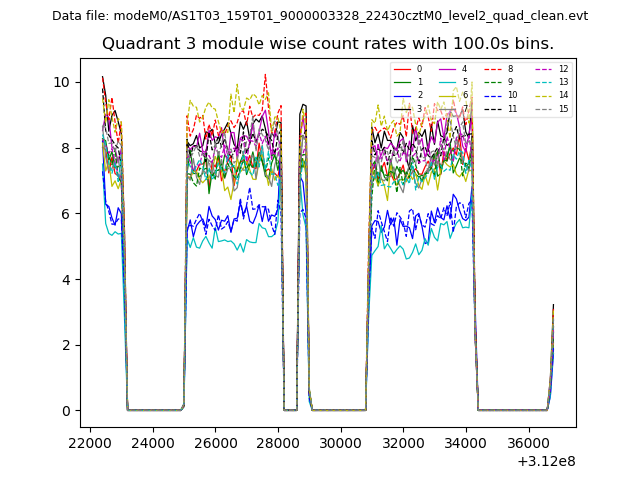
| Module-wise count rates for Quadrant C Data is divided into 100 sec bins |
 |
 |
| Module-wise count rates for Quadrant D Data is divided into 100 sec bins |
 |
 |
| Parameter | Plot |
|---|---|
| CZT HV Monitor | 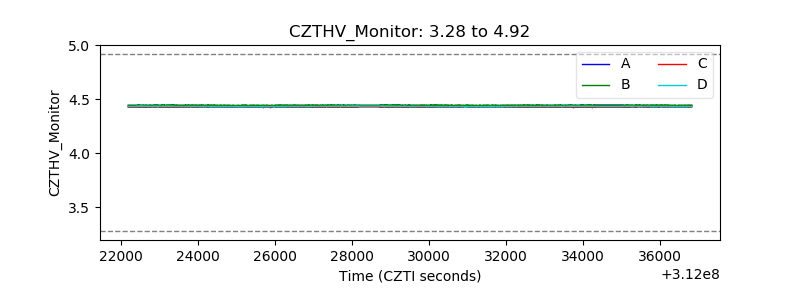 |
| D_VDD | 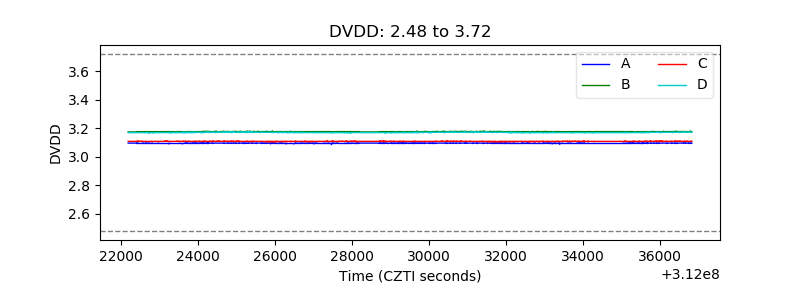 |
| Temperature 1 | 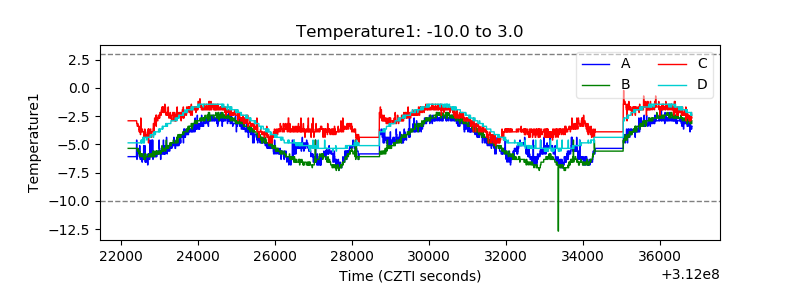 |
| Veto HV Monitor | 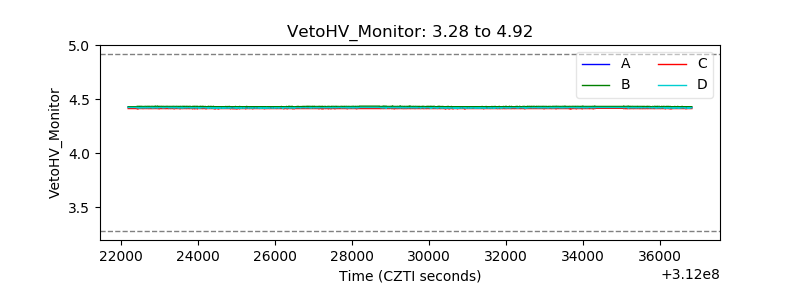 |
| Veto LLD | 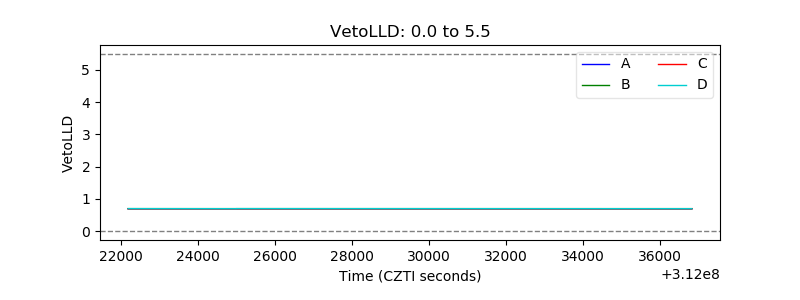 |
| Alpha Counter | 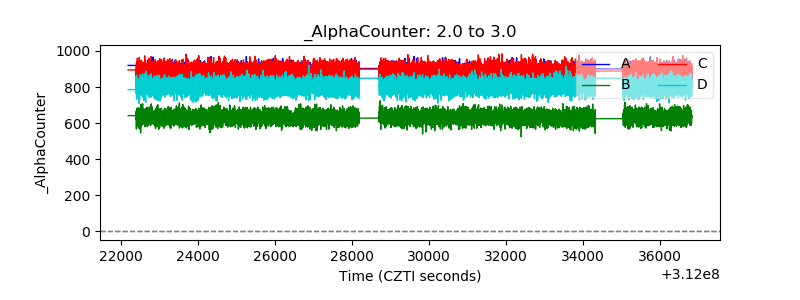 |
| _CPM_Rate | 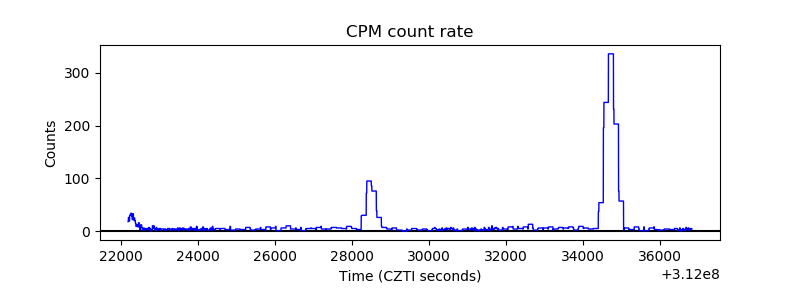 |
| CZT Counter | 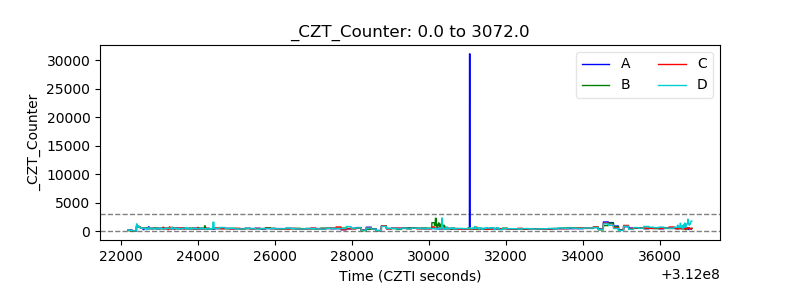 |
| +2.5 Volts monitor |  |
| +5 Volts monitor |  |
| _ROLL_ROT | 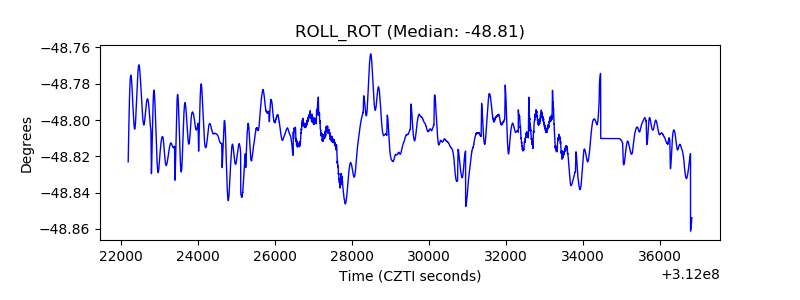 |
| _Roll_DEC | 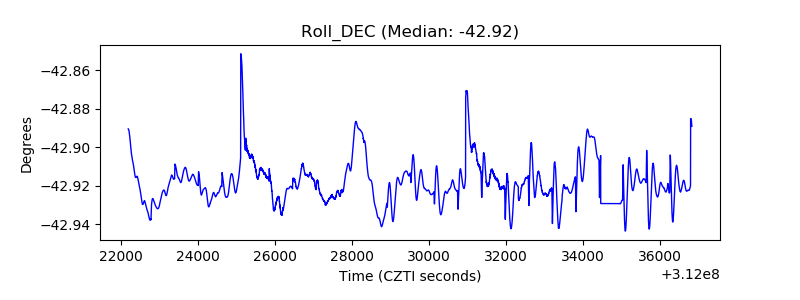 |
| _Roll_RA | 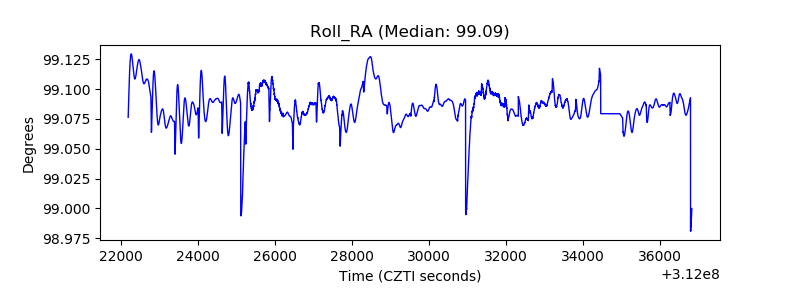 |
| Veto Counter | 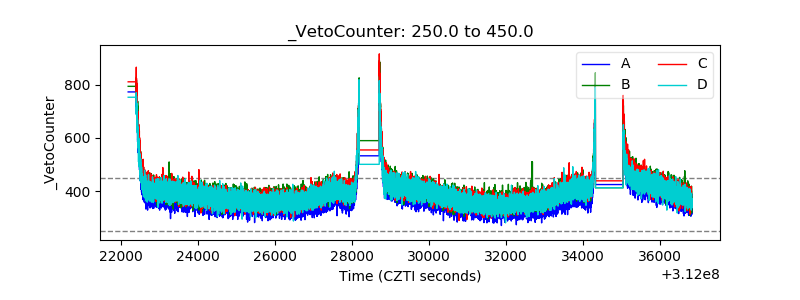 |