| Param | Original file | Final file |
|---|---|---|
| Filename | modeM0/AS1T03_159T01_9000003328_22434cztM0_level2.evt | modeM0/AS1T03_159T01_9000003328_22434cztM0_level2_quad_clean.evt |
| Size (bytes) | 423,400,320 | 113,777,280 |
| Size | 403.8 MB | 108.5 MB |
| Events in quadrant A | 3,111,080 | 770,103 |
| Events in quadrant B | 3,173,250 | 795,151 |
| Events in quadrant C | 3,088,767 | 738,123 |
| Events in quadrant D | 3,033,876 | 715,766 |
| Mode M9 | |||
|---|---|---|---|
| Quadrant | BADHDUFLAG | Total packets | Discarded packets |
| A | 0 | 12 | 0 |
| B | 0 | 12 | 0 |
| C | 0 | 12 | 0 |
| D | 0 | 12 | 0 |
| Mode SS | |||
|---|---|---|---|
| Quadrant | BADHDUFLAG | Total packets | Discarded packets |
| A | 0 | 124 | 0 |
| B | 0 | 124 | 0 |
| C | 0 | 124 | 0 |
| D | 0 | 124 | 0 |
| Mode M0 | |||
|---|---|---|---|
| Quadrant | BADHDUFLAG | Total packets | Discarded packets |
| A | 0 | 13288 | 1 |
| B | 0 | 13347 | 1 |
| C | 0 | 13060 | 1 |
| D | 0 | 13148 | 1 |
| Quadrant | Total seconds | Saturated seconds | Saturation percentage |
|---|---|---|---|
| A | 6114 | 41 | 0.670592% |
| B | 6115 | 55 | 0.899428% |
| C | 6115 | 70 | 1.144726% |
| D | 6115 | 43 | 0.703189% |
Noise dominated data is calculated using 1-second bins in cleaned event files. If a bin has >2000 counts, and if more than 50% of those come from <1% of pixels, then it is considered to be noise-dominated and hence unusable.
| Quadrant | # 1 sec bins | Bins with >0 counts | Bins with >2000 counts | High rate bins dominated by noise | Noise dominated (total time) | Noise dominated (detector-on time) | Marked lightcurve |
|---|---|---|---|---|---|---|---|
| A | 7384 | 6115 | 0 | 0 | 0.00% | 0.00% | 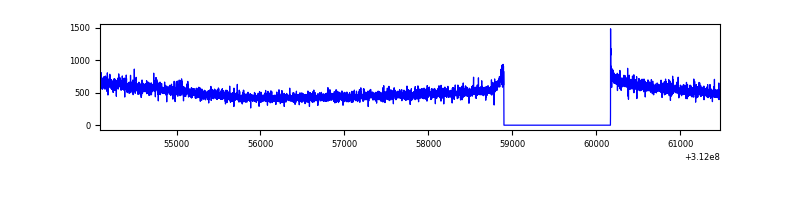 |
| B | 7385 | 6115 | 1 | 1 | 0.01% | 0.02% | 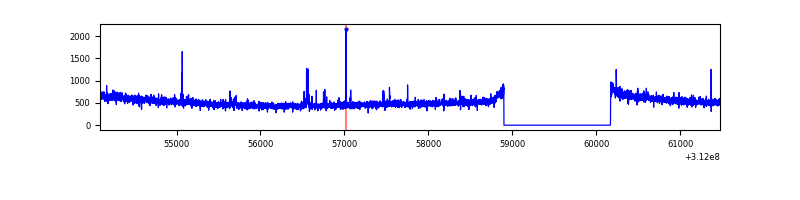 |
| C | 7385 | 6116 | 0 | 0 | 0.00% | 0.00% | 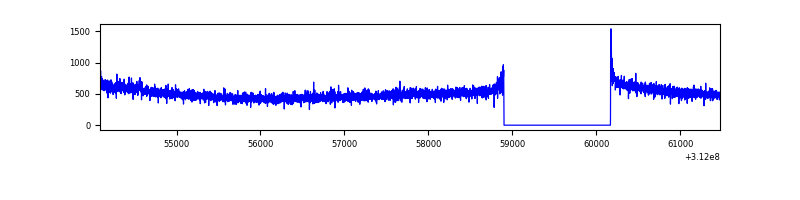 |
| D | 7385 | 6116 | 27 | 27 | 0.37% | 0.44% | 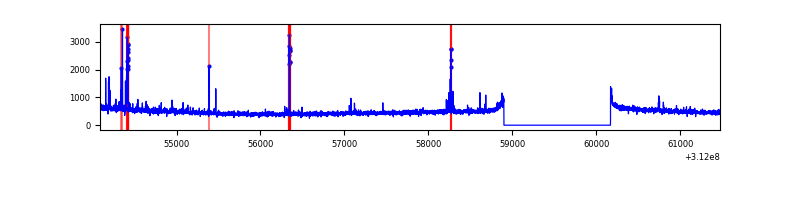 |
Top three noisy pixels from each quadrant. If the there are fewer than three noisy pixels in the level2.evt file, extra rows are filled as -1
| Pixel properties | Quadrant properties | ||||||
|---|---|---|---|---|---|---|---|
| Quadrant | DetID | PixID | Counts | Sigma | Mean | Median | Sigma |
| A | 2 | 79 | 20997 | 128.55 | 794 | 780 | 157.3 |
| A | 15 | 174 | 18720 | 114.08 | 794 | 780 | 157.3 |
| A | 3 | 1 | 12774 | 76.27 | 794 | 780 | 157.3 |
| B | 0 | 244 | 17902 | 116.11 | 800 | 783 | 147.4 |
| B | 12 | 111 | 17355 | 112.4 | 800 | 783 | 147.4 |
| B | 11 | 111 | 15354 | 98.83 | 800 | 783 | 147.4 |
| C | 14 | 238 | 121438 | 684.71 | 756 | 762 | 176.2 |
| C | 1 | 16 | 11684 | 61.97 | 756 | 762 | 176.2 |
| C | 0 | 10 | 7686 | 39.29 | 756 | 762 | 176.2 |
| D | 1 | 52 | 82206 | 445.08 | 758 | 739 | 183.0 |
| D | 7 | 38 | 31687 | 169.08 | 758 | 739 | 183.0 |
| D | 13 | 104 | 26635 | 141.48 | 758 | 739 | 183.0 |
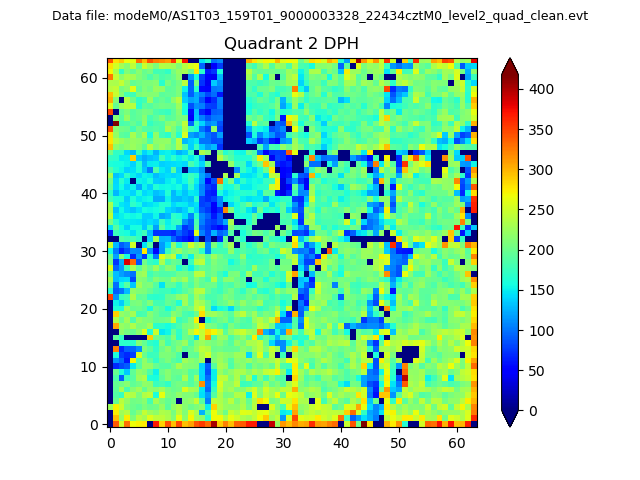
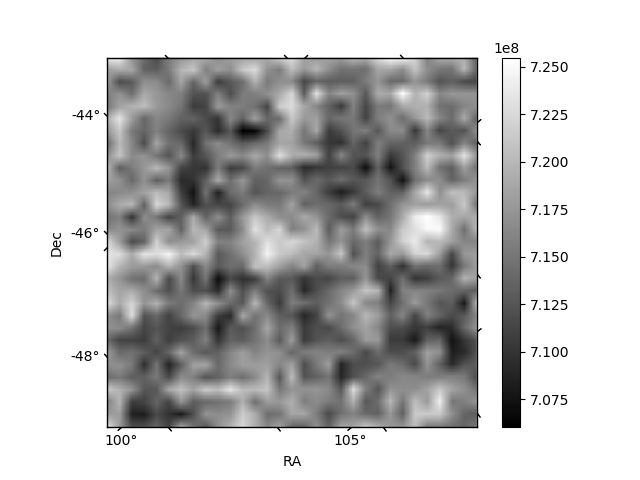
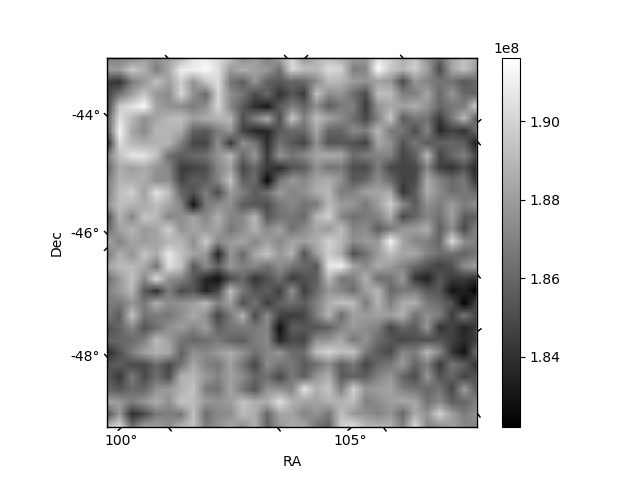
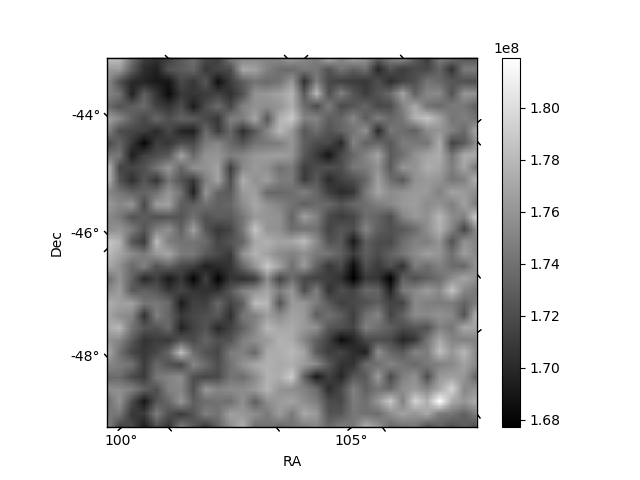
Histogram calculated using DETX and DETY for each event in the final _common_clean file
| Quadrant A | 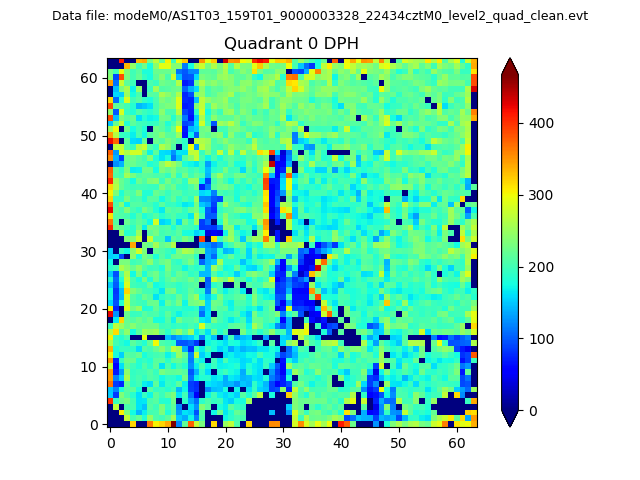 |
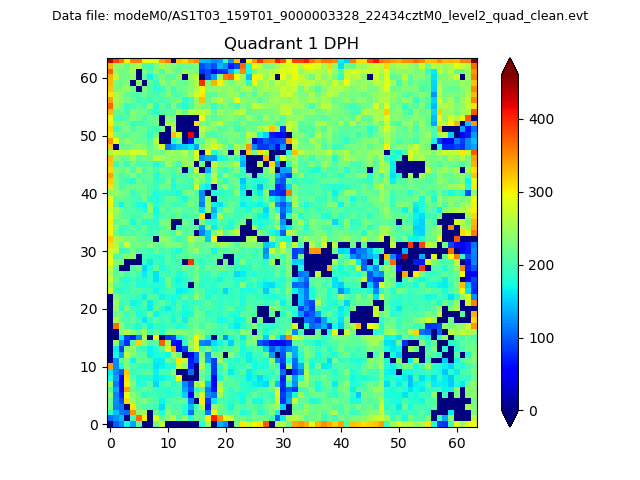 |
Quadrant B |
|---|---|---|---|
| Quadrant D | 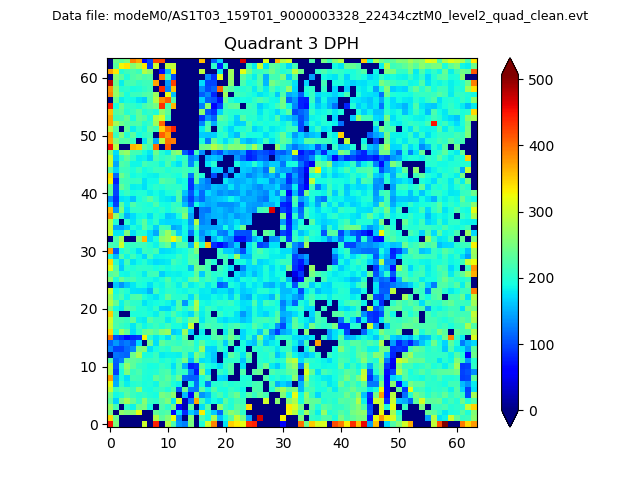 |
 |
Quadrant C |
| Plot type | Count rate plots | Images |
|---|---|---|
| Comparison with Poisson distribution Blue bars denote a histogram of data divided into 1 sec bins. Red curve is a Poisson curve with rate = median count rate of data. |
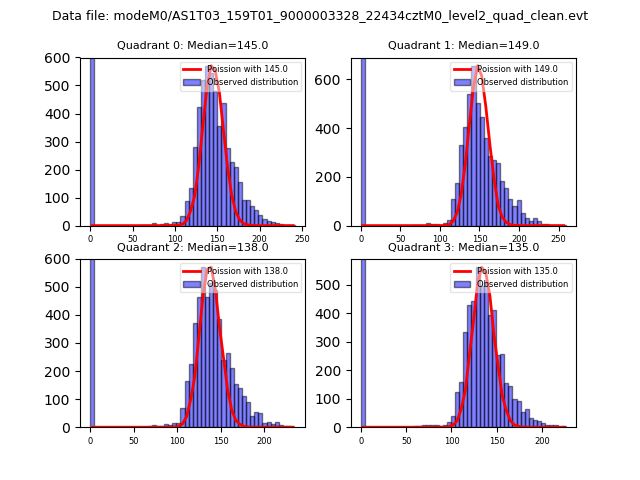 |
 |
| Quadrant-wise count rates Data is divided into 100 sec bins |
 |
|
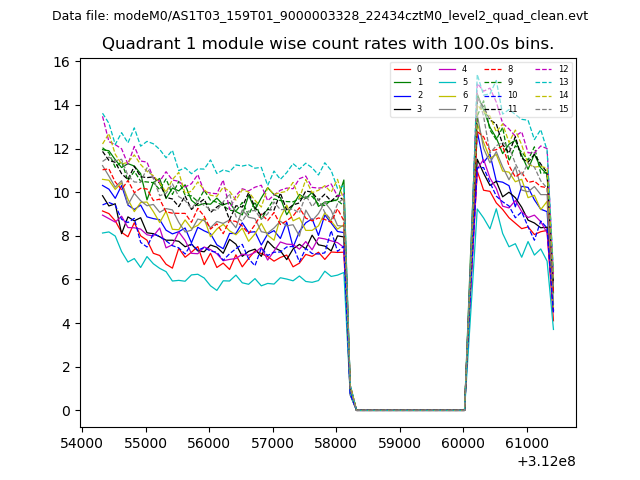
| Module-wise count rates for Quadrant A Data is divided into 100 sec bins |
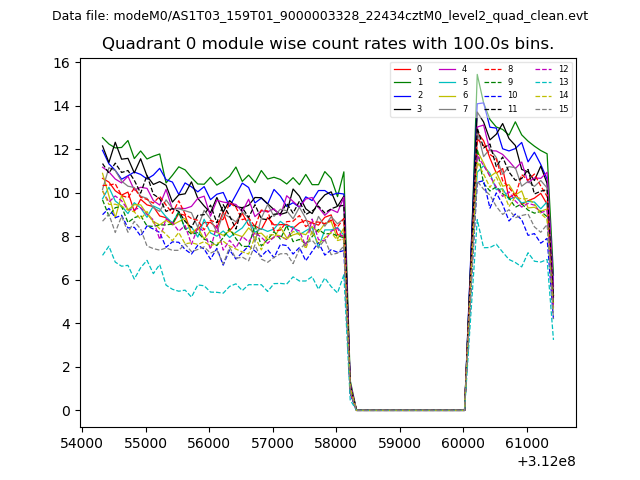 |
 |
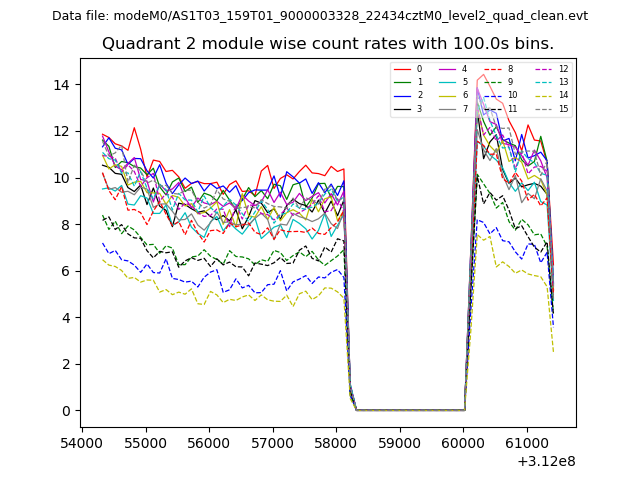
| Module-wise count rates for Quadrant B Data is divided into 100 sec bins |
 |
 |
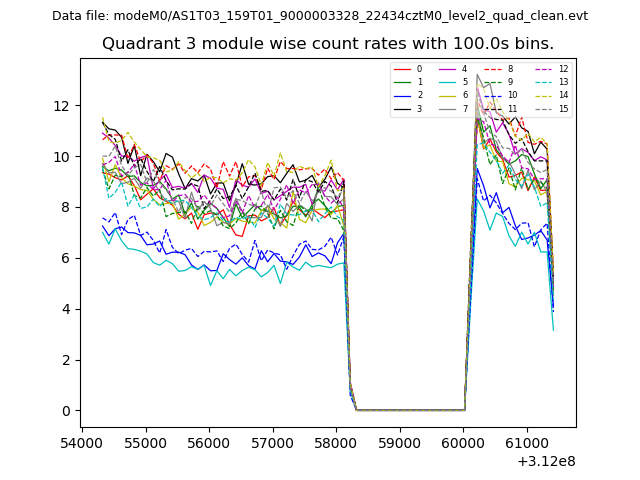
| Module-wise count rates for Quadrant C Data is divided into 100 sec bins |
 |
 |
| Module-wise count rates for Quadrant D Data is divided into 100 sec bins |
 |
 |
| Parameter | Plot |
|---|---|
| CZT HV Monitor | 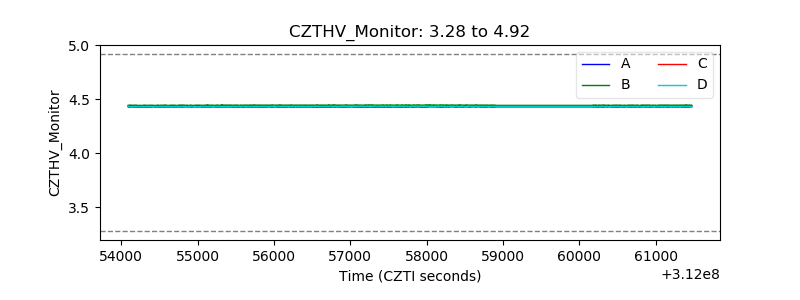 |
| D_VDD | 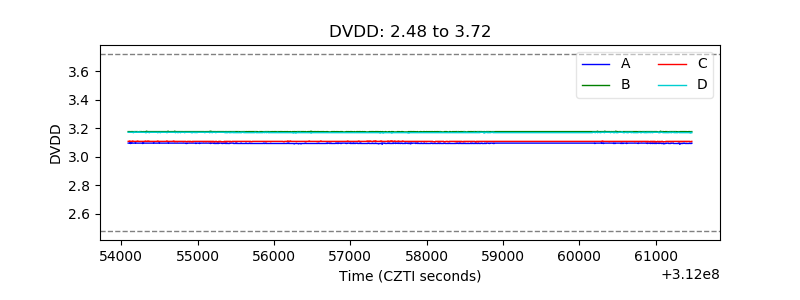 |
| Temperature 1 | 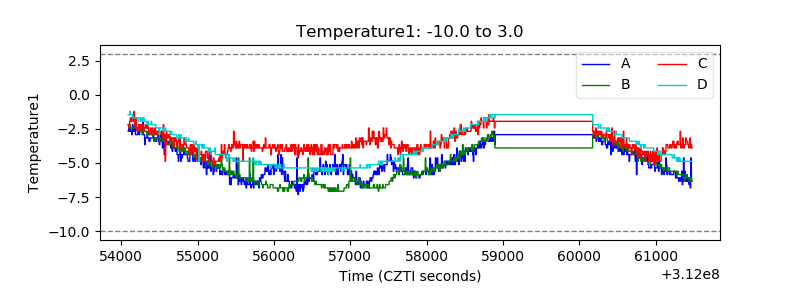 |
| Veto HV Monitor |  |
| Veto LLD | 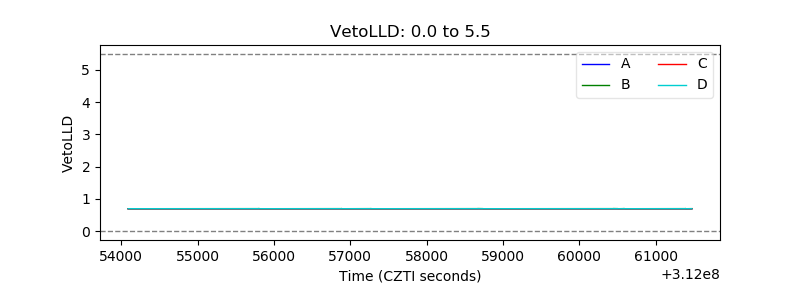 |
| Alpha Counter |  |
| _CPM_Rate | 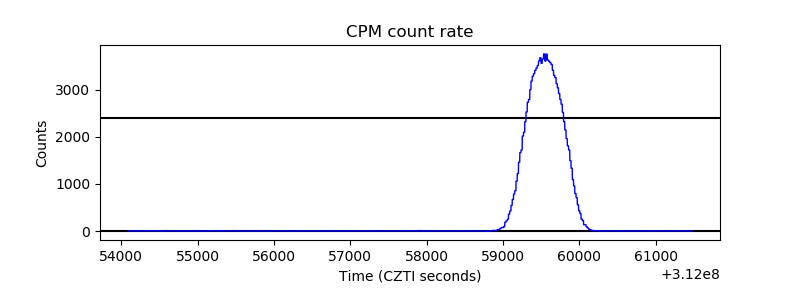 |
| CZT Counter | 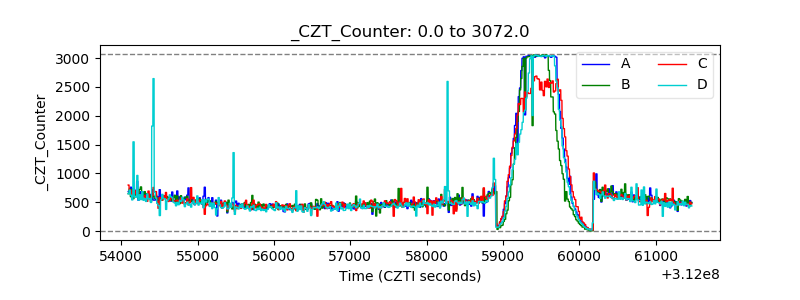 |
| +2.5 Volts monitor |  |
| +5 Volts monitor |  |
| _ROLL_ROT | 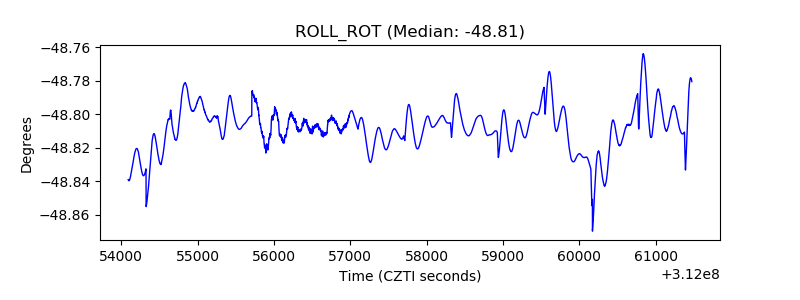 |
| _Roll_DEC | 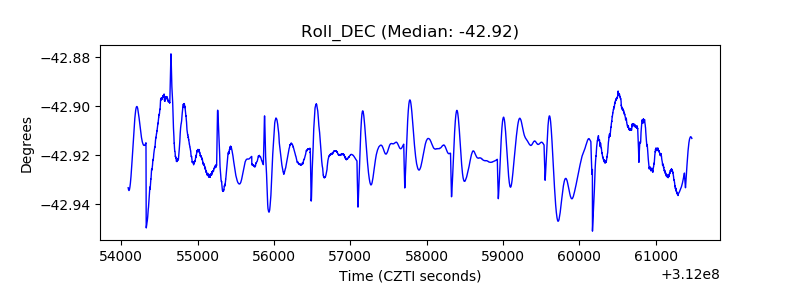 |
| _Roll_RA | 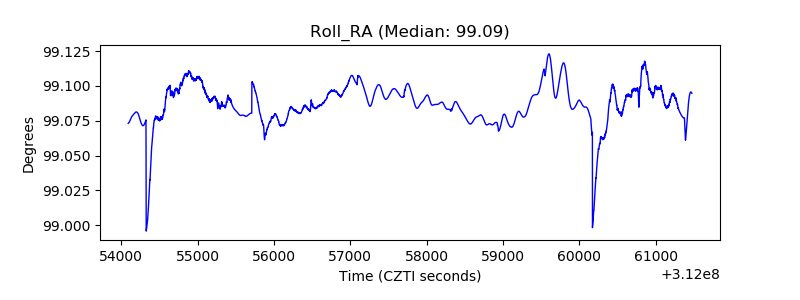 |
| Veto Counter | 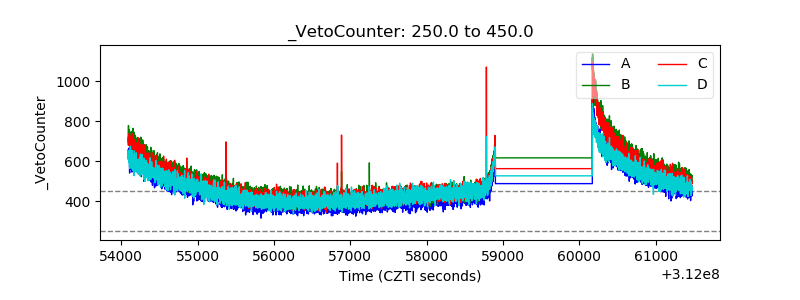 |