| Param | Original file | Final file |
|---|---|---|
| Filename | modeM0/AS1T03_159T01_9000003328_22435cztM0_level2.evt | modeM0/AS1T03_159T01_9000003328_22435cztM0_level2_quad_clean.evt |
| Size (bytes) | 460,296,000 | 120,991,680 |
| Size | 439.0 MB | 115.4 MB |
| Events in quadrant A | 3,365,952 | 813,460 |
| Events in quadrant B | 3,459,663 | 849,293 |
| Events in quadrant C | 3,394,997 | 786,680 |
| Events in quadrant D | 3,274,481 | 758,447 |
| Mode M9 | |||
|---|---|---|---|
| Quadrant | BADHDUFLAG | Total packets | Discarded packets |
| A | 0 | 25 | 0 |
| B | 0 | 25 | 0 |
| C | 0 | 25 | 0 |
| D | 0 | 25 | 0 |
| Mode SS | |||
|---|---|---|---|
| Quadrant | BADHDUFLAG | Total packets | Discarded packets |
| A | 0 | 134 | 0 |
| B | 0 | 134 | 0 |
| C | 0 | 134 | 0 |
| D | 0 | 134 | 0 |
| Mode M0 | |||
|---|---|---|---|
| Quadrant | BADHDUFLAG | Total packets | Discarded packets |
| A | 0 | 14213 | 2 |
| B | 0 | 14401 | 2 |
| C | 0 | 14121 | 2 |
| D | 0 | 14021 | 2 |
| Quadrant | Total seconds | Saturated seconds | Saturation percentage |
|---|---|---|---|
| A | 6545 | 70 | 1.069519% |
| B | 6546 | 92 | 1.405438% |
| C | 6546 | 113 | 1.726245% |
| D | 6546 | 32 | 0.488848% |
Noise dominated data is calculated using 1-second bins in cleaned event files. If a bin has >2000 counts, and if more than 50% of those come from <1% of pixels, then it is considered to be noise-dominated and hence unusable.
| Quadrant | # 1 sec bins | Bins with >0 counts | Bins with >2000 counts | High rate bins dominated by noise | Noise dominated (total time) | Noise dominated (detector-on time) | Marked lightcurve |
|---|---|---|---|---|---|---|---|
| A | 9160 | 6547 | 0 | 0 | 0.00% | 0.00% | 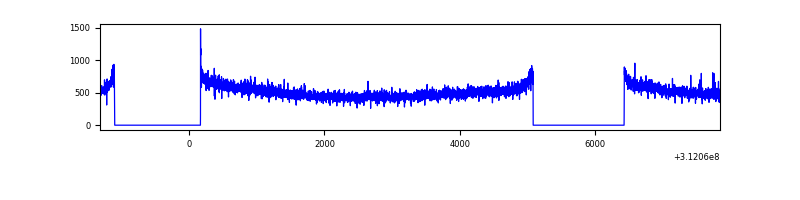 |
| B | 9161 | 6547 | 1 | 1 | 0.01% | 0.02% | 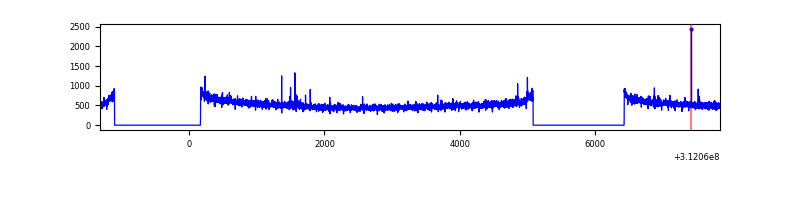 |
| C | 9161 | 6548 | 0 | 0 | 0.00% | 0.00% | 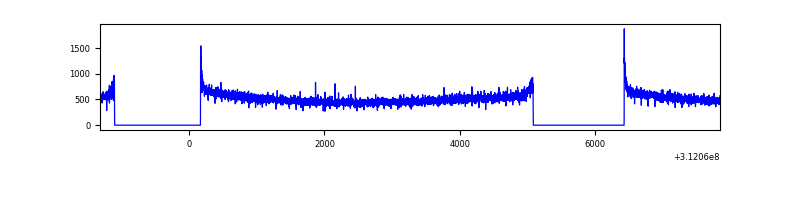 |
| D | 9161 | 6548 | 8 | 8 | 0.09% | 0.12% | 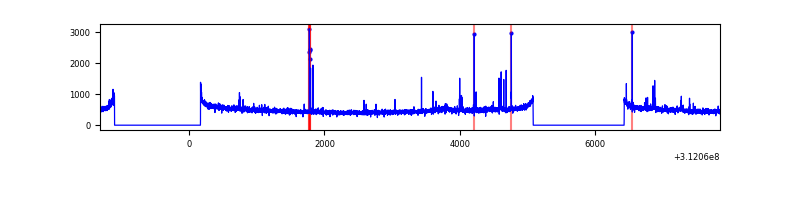 |
Top three noisy pixels from each quadrant. If the there are fewer than three noisy pixels in the level2.evt file, extra rows are filled as -1
| Pixel properties | Quadrant properties | ||||||
|---|---|---|---|---|---|---|---|
| Quadrant | DetID | PixID | Counts | Sigma | Mean | Median | Sigma |
| A | 3 | 1 | 27753 | 156.59 | 864 | 848 | 171.8 |
| A | 15 | 174 | 11605 | 62.61 | 864 | 848 | 171.8 |
| A | 13 | 254 | 8519 | 44.65 | 864 | 848 | 171.8 |
| B | 12 | 111 | 19207 | 114.13 | 875 | 855 | 160.8 |
| B | 0 | 229 | 18187 | 107.79 | 875 | 855 | 160.8 |
| B | 11 | 111 | 16737 | 98.77 | 875 | 855 | 160.8 |
| C | 14 | 238 | 133403 | 688.12 | 833 | 840 | 192.6 |
| C | 0 | 10 | 15872 | 78.03 | 833 | 840 | 192.6 |
| C | 13 | 61 | 5798 | 25.74 | 833 | 840 | 192.6 |
| D | 13 | 104 | 50696 | 251.51 | 829 | 808 | 198.4 |
| D | 1 | 52 | 33841 | 166.54 | 829 | 808 | 198.4 |
| D | 7 | 96 | 29397 | 144.13 | 829 | 808 | 198.4 |
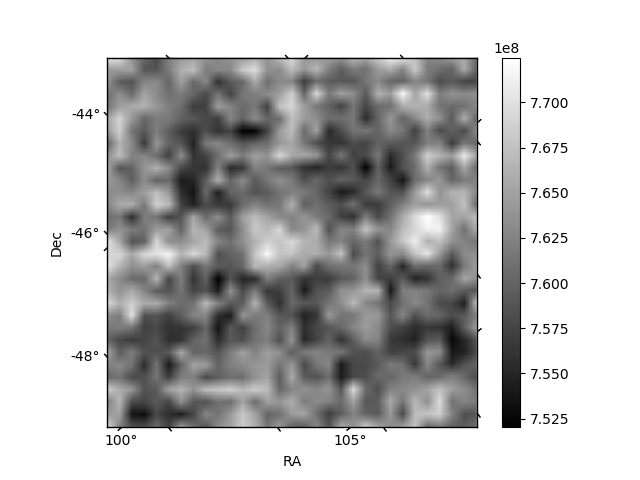
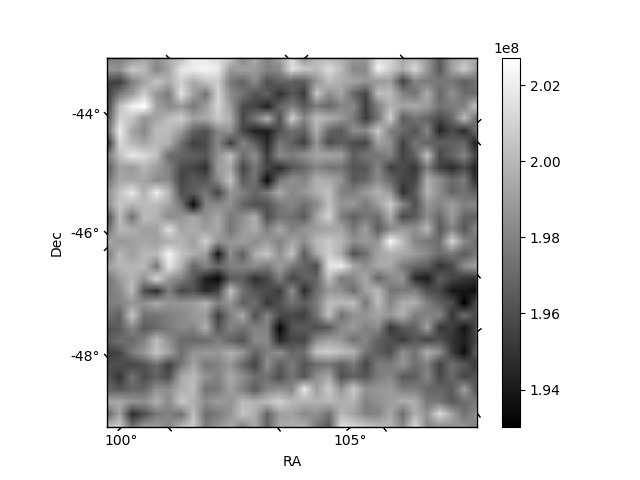
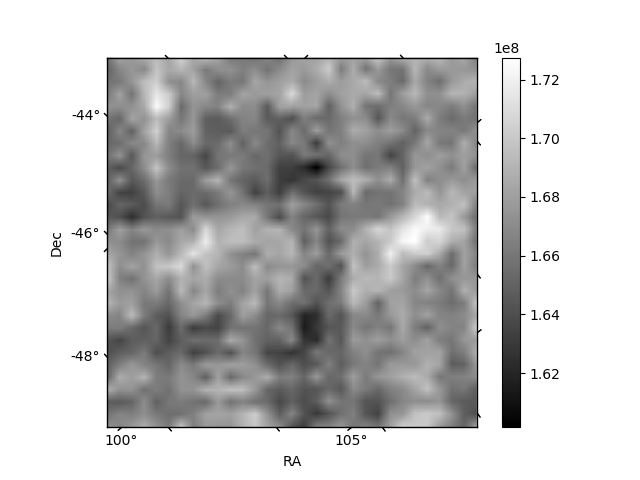
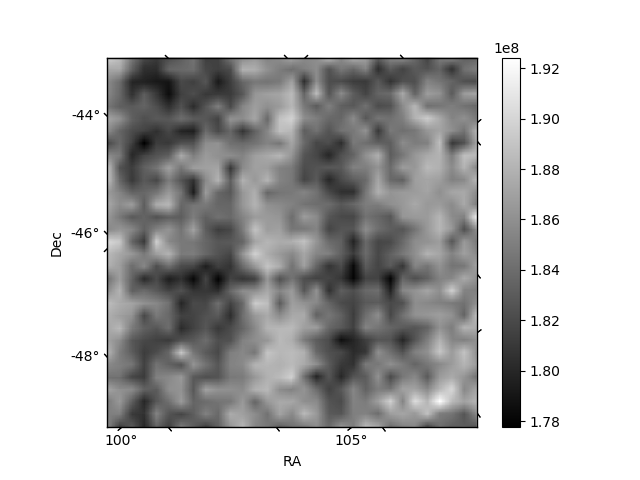
Histogram calculated using DETX and DETY for each event in the final _common_clean file
| Quadrant A | 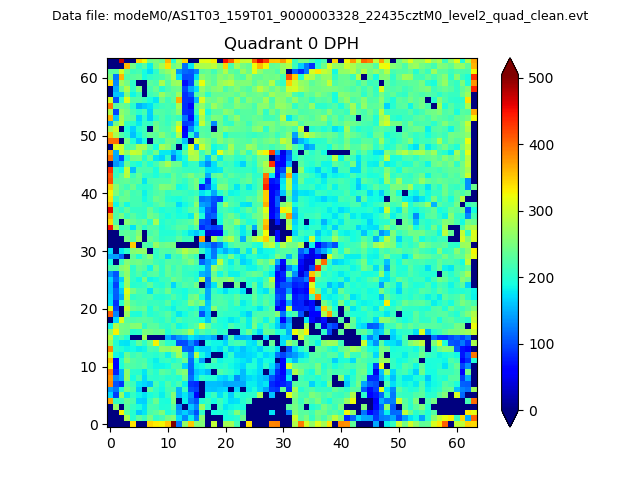 |
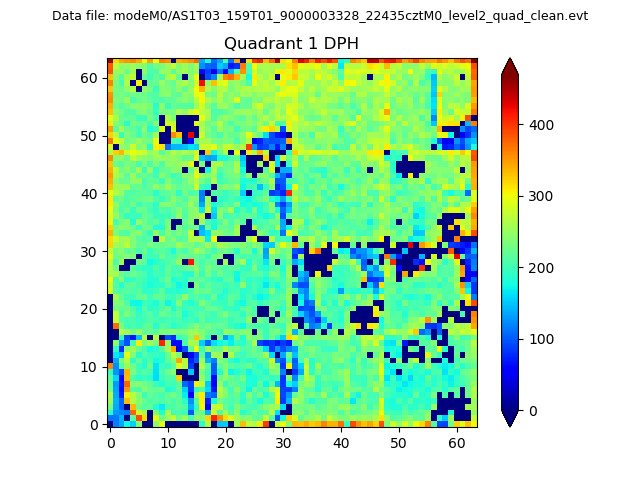 |
Quadrant B |
|---|---|---|---|
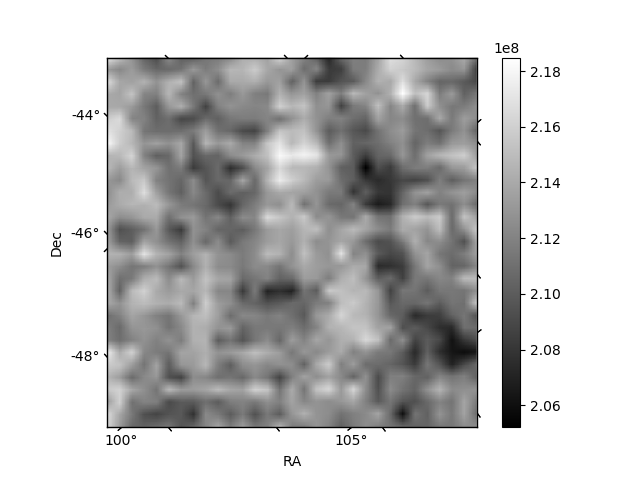
| Quadrant D | 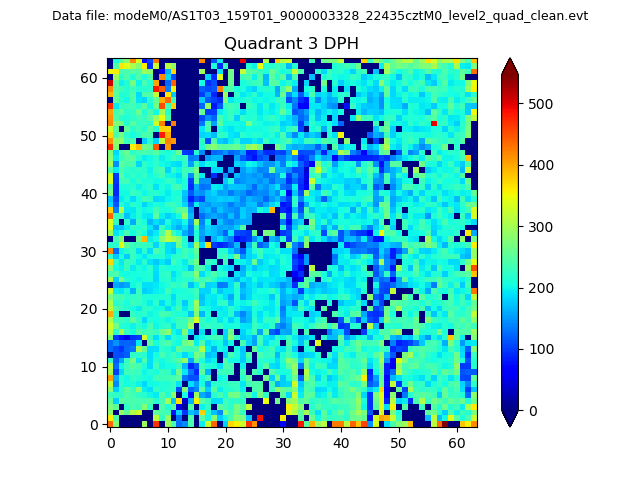 |
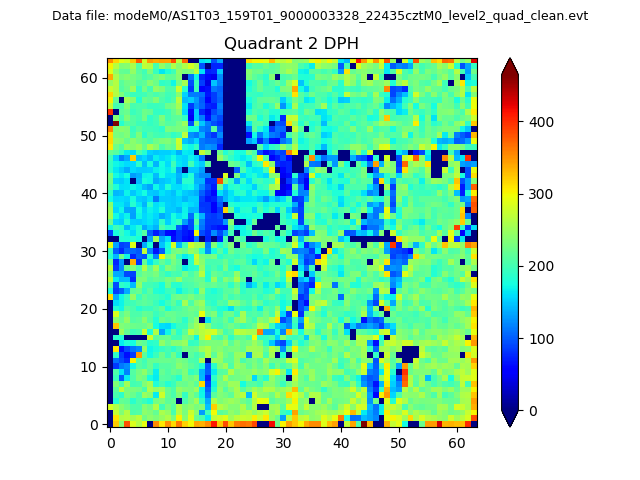 |
Quadrant C |
| Plot type | Count rate plots | Images |
|---|---|---|
| Comparison with Poisson distribution Blue bars denote a histogram of data divided into 1 sec bins. Red curve is a Poisson curve with rate = median count rate of data. |
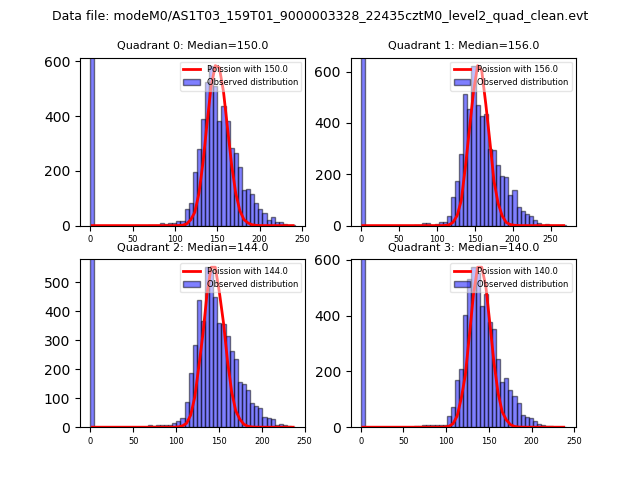 |
 |
| Quadrant-wise count rates Data is divided into 100 sec bins |
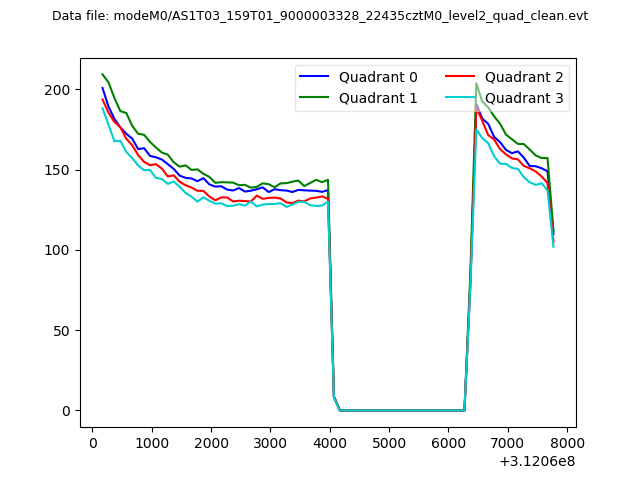 |
|
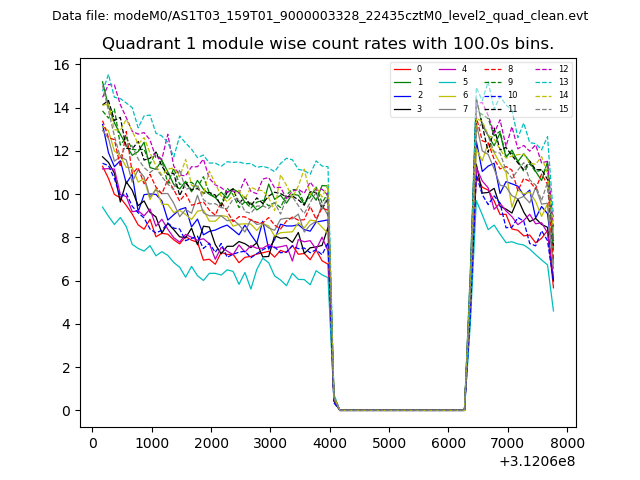
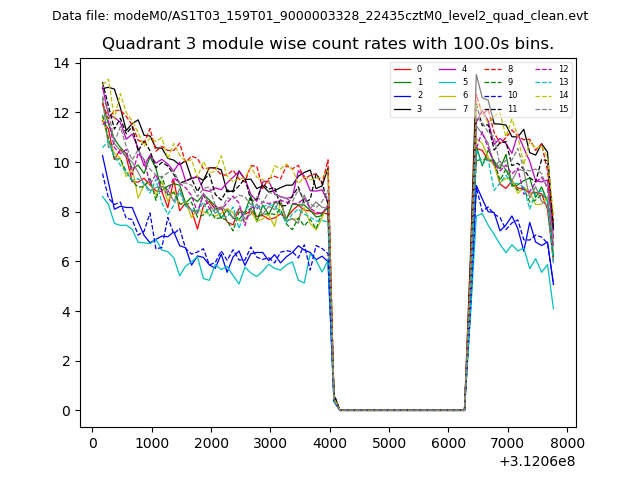
| Module-wise count rates for Quadrant A Data is divided into 100 sec bins |
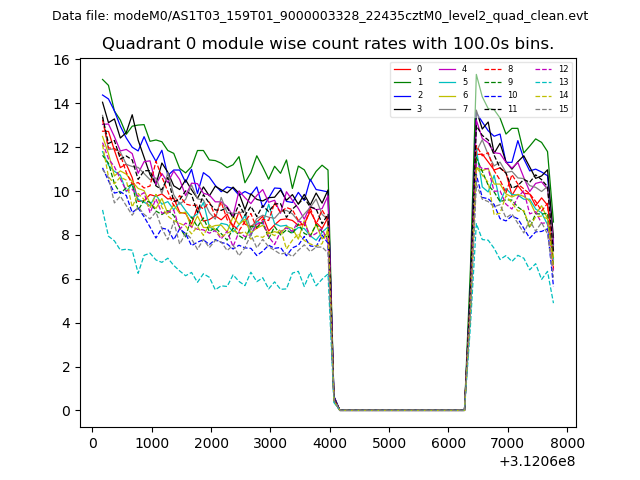 |
 |
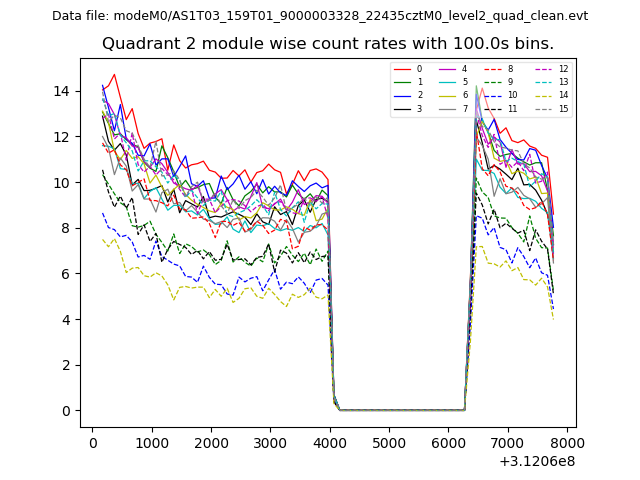
| Module-wise count rates for Quadrant B Data is divided into 100 sec bins |
 |
 |
| Module-wise count rates for Quadrant C Data is divided into 100 sec bins |
 |
 |
| Module-wise count rates for Quadrant D Data is divided into 100 sec bins |
 |
 |
| Parameter | Plot |
|---|---|
| CZT HV Monitor | 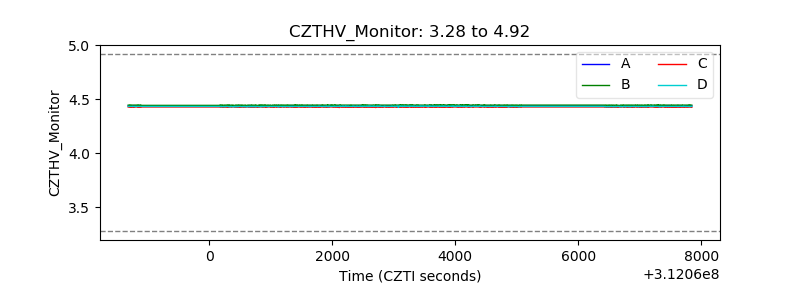 |
| D_VDD | 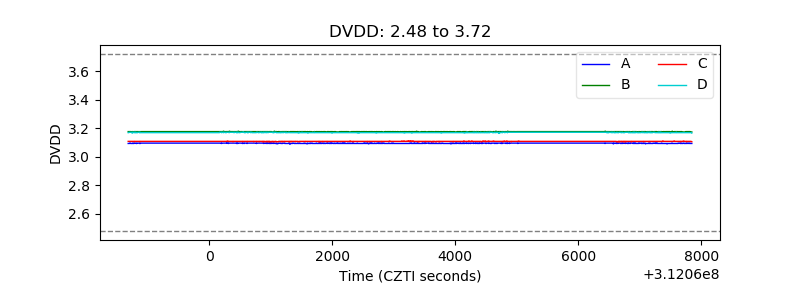 |
| Temperature 1 | 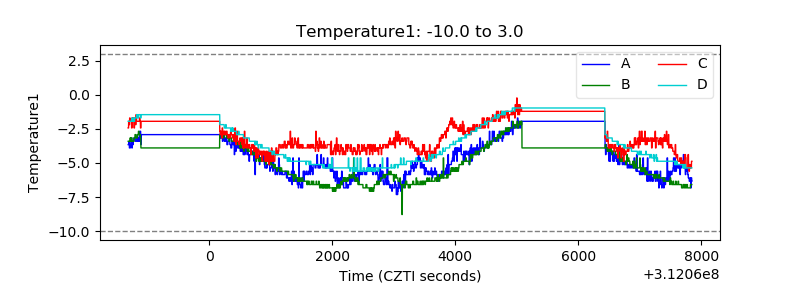 |
| Veto HV Monitor |  |
| Veto LLD | 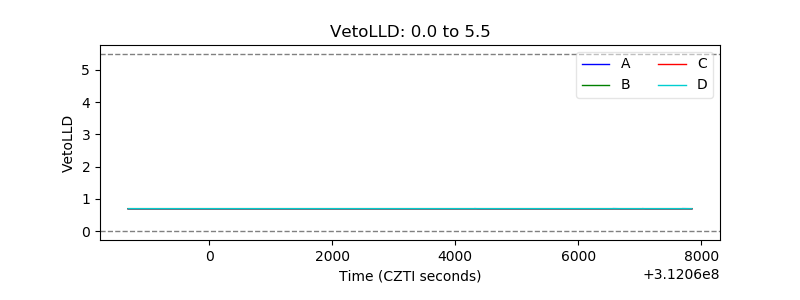 |
| Alpha Counter |  |
| _CPM_Rate | 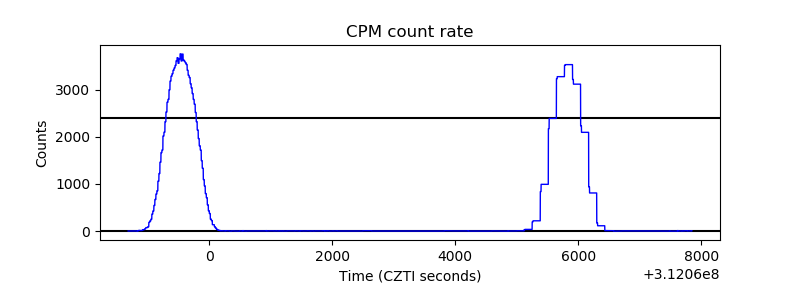 |
| CZT Counter | 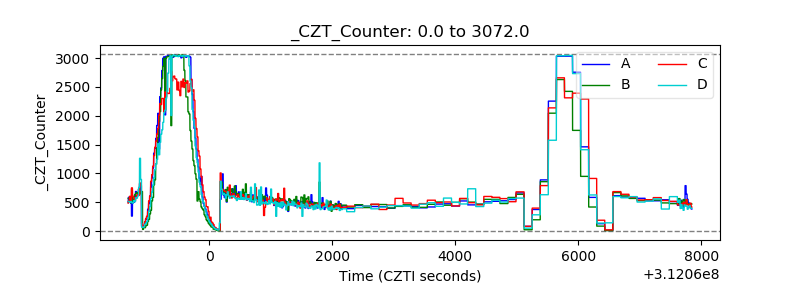 |
| +2.5 Volts monitor |  |
| +5 Volts monitor |  |
| _ROLL_ROT | 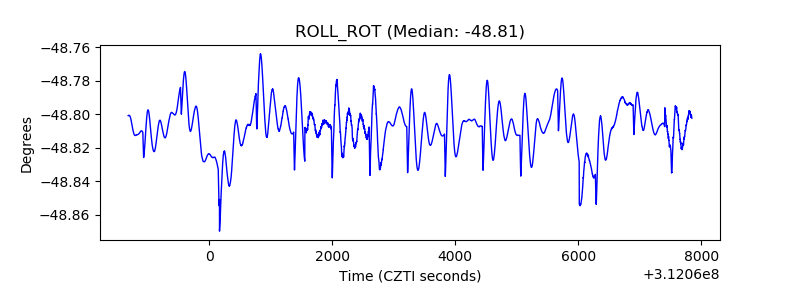 |
| _Roll_DEC | 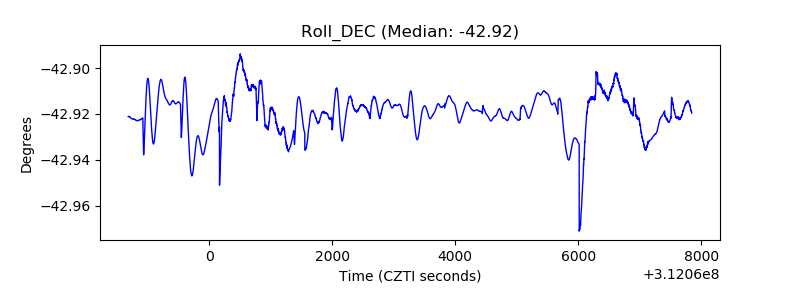 |
| _Roll_RA | 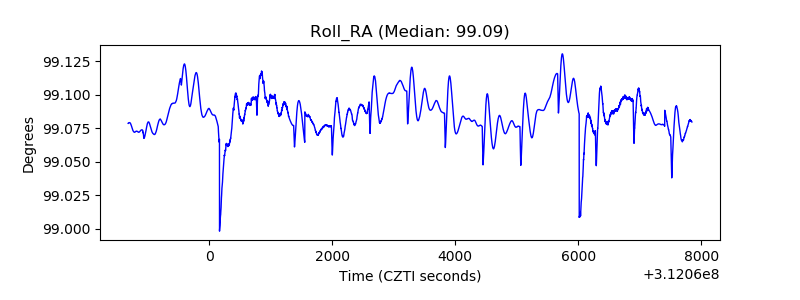 |
| Veto Counter | 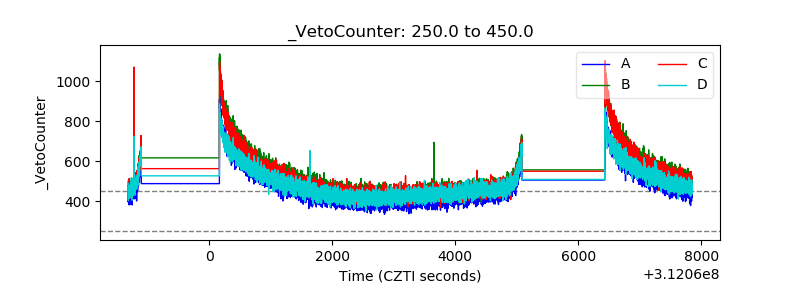 |