| Param | Original file | Final file |
|---|---|---|
| Filename | modeM0/AS1A07_065T01_9000003338cztM0_level2.fits | modeM0/AS1A07_065T01_9000003338cztM0_level2_quad_clean.evt |
| Size (bytes) | 514,897,920 | 509,316,480 |
| Size | 491.0 MB | 485.7 MB |
| Events in quadrant A | 3,177,550 | 3,124,376 |
| Events in quadrant B | 3,046,276 | 3,087,922 |
| Events in quadrant C | 3,142,638 | 2,979,380 |
| Events in quadrant D | 2,748,368 | 2,753,804 |
| Mode SS | |||
|---|---|---|---|
| Quadrant | BADHDUFLAG | Total packets | Discarded packets |
| A | 0 | 1034 | 0 |
| B | 0 | 1034 | 0 |
| C | 0 | 1034 | 0 |
| D | 0 | 1034 | 0 |
| Mode M0 | |||
|---|---|---|---|
| Quadrant | BADHDUFLAG | Total packets | Discarded packets |
| A | 0 | 106269 | 0 |
| B | 0 | 117787 | 0 |
| C | 0 | 108474 | 0 |
| D | 0 | 112583 | 0 |
| Mode M9 | |||
|---|---|---|---|
| Quadrant | BADHDUFLAG | Total packets | Discarded packets |
| A | 0 | 105 | 0 |
| B | 0 | 105 | 0 |
| C | 0 | 105 | 0 |
| D | 0 | 105 | 0 |
| Quadrant | Total seconds | Saturated seconds | Saturation percentage |
|---|---|---|---|
| A | 50704 | 433 | 0.853976% |
| B | 50704 | 840 | 1.656674% |
| C | 50704 | 858 | 1.692174% |
| D | 50704 | 822 | 1.621174% |
Noise dominated data is calculated using 1-second bins in cleaned event files. If a bin has >2000 counts, and if more than 50% of those come from <1% of pixels, then it is considered to be noise-dominated and hence unusable.
| Quadrant | # 1 sec bins | Bins with >0 counts | Bins with >2000 counts | High rate bins dominated by noise | Noise dominated (total time) | Noise dominated (detector-on time) | Marked lightcurve |
|---|---|---|---|---|---|---|---|
| A | 61179 | 50696 | 0 | 0 | 0.00% | 0.00% |  |
| B | 61179 | 50697 | 0 | 0 | 0.00% | 0.00% | 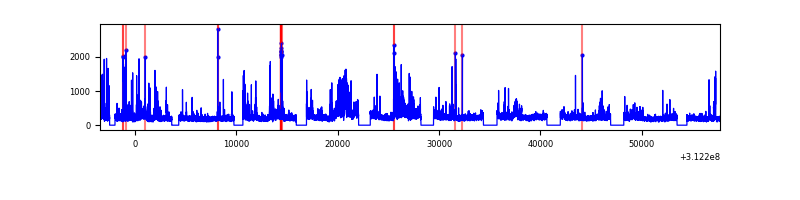 |
| C | 61179 | 50696 | 0 | 0 | 0.00% | 0.00% | 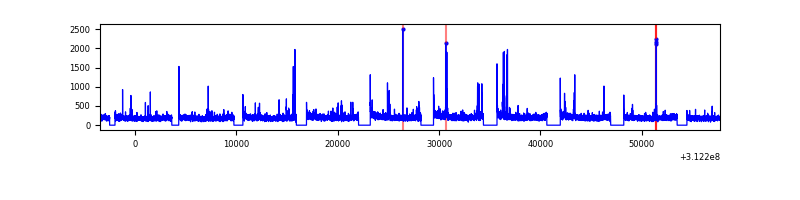 |
| D | 61179 | 50665 | 0 | 0 | 0.00% | 0.00% | 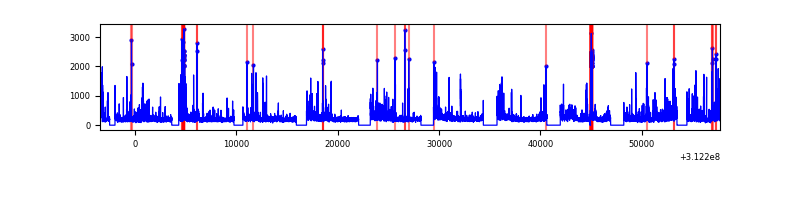 |
Top three noisy pixels from each quadrant. If the there are fewer than three noisy pixels in the level2.evt file, extra rows are filled as -1
| Pixel properties | Quadrant properties | ||||||
|---|---|---|---|---|---|---|---|
| Quadrant | DetID | PixID | Counts | Sigma | Mean | Median | Sigma |
| A | 0 | 29 | 3024 | 10.86 | 828 | 777 | 206.8 |
| A | 7 | 110 | 2442 | 8.05 | 828 | 777 | 206.8 |
| A | 0 | 30 | 2329 | 7.5 | 828 | 777 | 206.8 |
| B | 2 | 9 | 2456 | 10.49 | 805 | 769 | 160.8 |
| B | 2 | 8 | 2073 | 8.11 | 805 | 769 | 160.8 |
| B | 5 | 232 | 2022 | 7.79 | 805 | 769 | 160.8 |
| C | 1 | 80 | 2353 | 7.5 | 828 | 776 | 210.2 |
| C | 1 | 81 | 2337 | 7.43 | 828 | 776 | 210.2 |
| C | 12 | 241 | 2155 | 6.56 | 828 | 776 | 210.2 |
| D | 6 | 231 | 1986 | 6.15 | 783 | 716 | 206.5 |
| D | 10 | 189 | 1983 | 6.14 | 783 | 716 | 206.5 |
| D | 7 | 3 | 1982 | 6.13 | 783 | 716 | 206.5 |
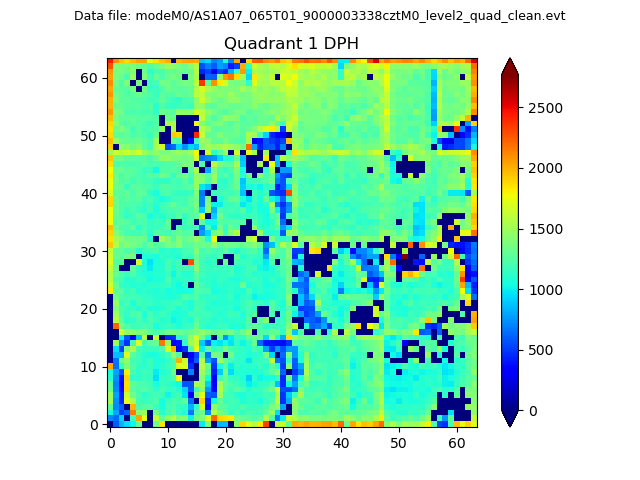
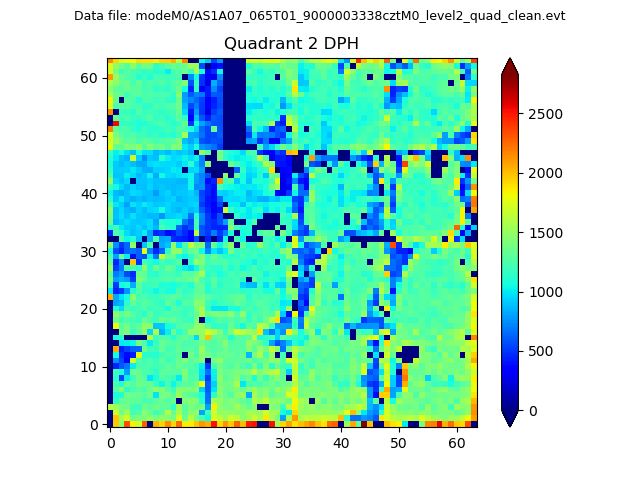
Histogram calculated using DETX and DETY for each event in the final _common_clean file
| Quadrant A | 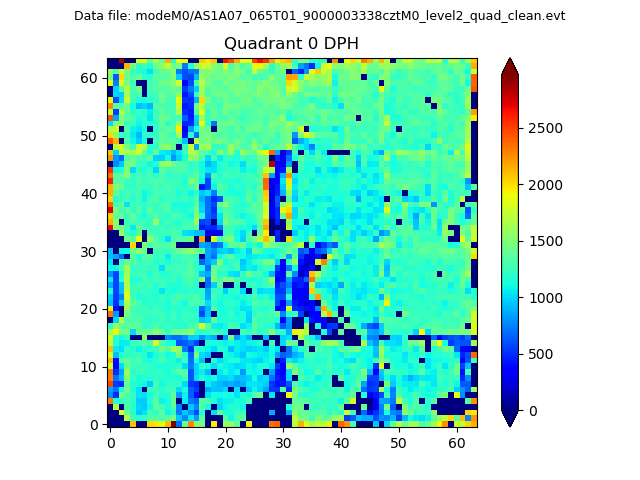 |
 |
Quadrant B |
|---|---|---|---|
| Quadrant D |  |
 |
Quadrant C |
| Plot type | Count rate plots | Images |
|---|---|---|
| Comparison with Poisson distribution Blue bars denote a histogram of data divided into 1 sec bins. Red curve is a Poisson curve with rate = median count rate of data. |
 |
 |
| Quadrant-wise count rates Data is divided into 100 sec bins |
 |
|
| Module-wise count rates for Quadrant A Data is divided into 100 sec bins |
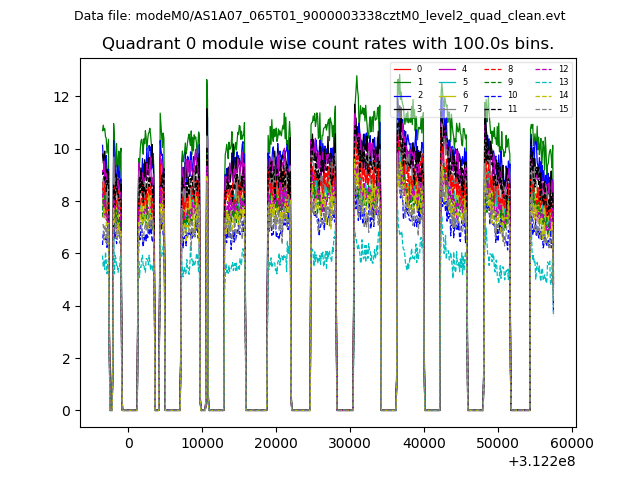 |
 |
| Module-wise count rates for Quadrant B Data is divided into 100 sec bins |
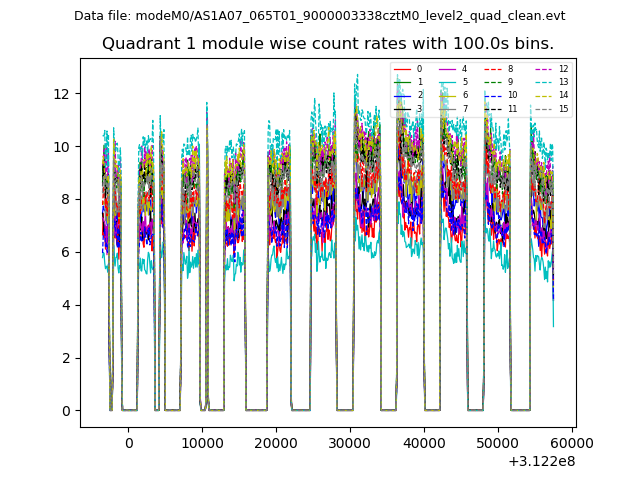 |
 |
| Module-wise count rates for Quadrant C Data is divided into 100 sec bins |
 |
 |
| Module-wise count rates for Quadrant D Data is divided into 100 sec bins |
 |
 |
| Parameter | Plot |
|---|---|
| CZT HV Monitor |  |
| D_VDD | 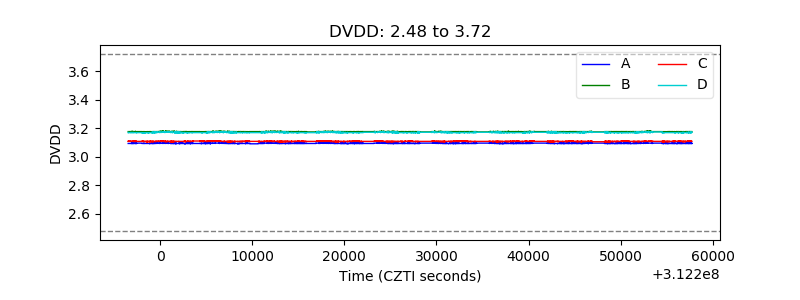 |
| Temperature 1 |  |
| Veto HV Monitor |  |
| Veto LLD | 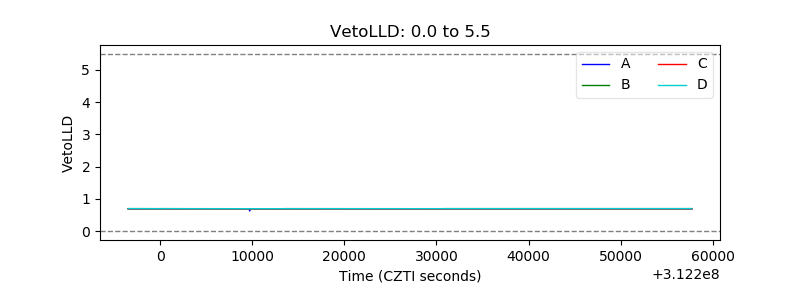 |
| Alpha Counter |  |
| _CPM_Rate |  |
| CZT Counter | 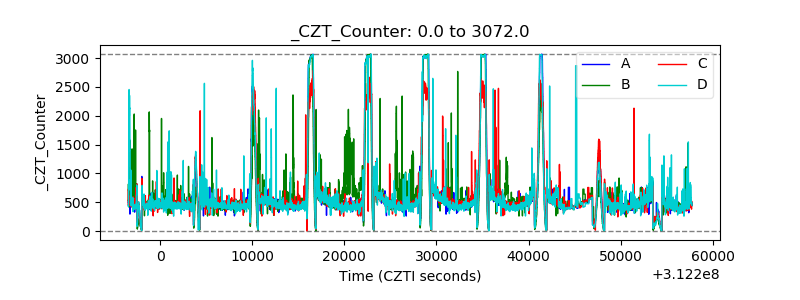 |
| +2.5 Volts monitor |  |
| +5 Volts monitor | 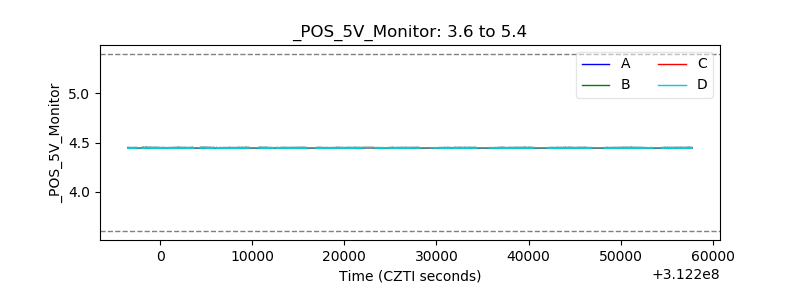 |
| _ROLL_ROT | 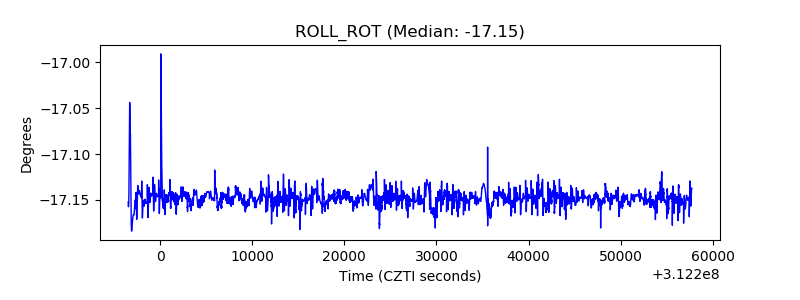 |
| _Roll_DEC | 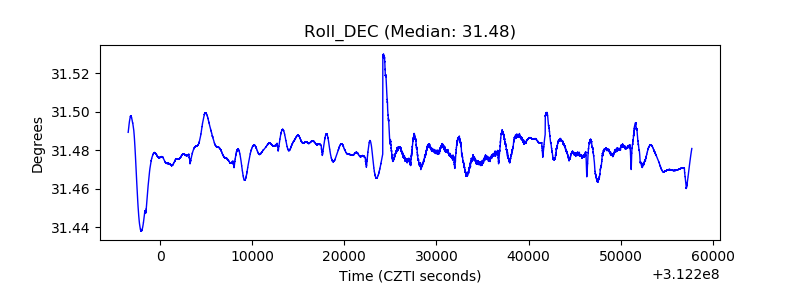 |
| _Roll_RA |  |
| Veto Counter |  |