| Param | Original file | Final file |
|---|---|---|
| Filename | modeM0/AS1A07_065T01_9000003338_22458cztM0_level2.evt | modeM0/AS1A07_065T01_9000003338_22458cztM0_level2_quad_clean.evt |
| Size (bytes) | 564,151,680 | 102,245,760 |
| Size | 538.0 MB | 97.5 MB |
| Events in quadrant A | 3,861,938 | 645,738 |
| Events in quadrant B | 4,465,549 | 649,308 |
| Events in quadrant C | 3,939,590 | 622,585 |
| Events in quadrant D | 4,263,732 | 610,914 |
| Mode SS | |||
|---|---|---|---|
| Quadrant | BADHDUFLAG | Total packets | Discarded packets |
| A | 0 | 168 | 0 |
| B | 0 | 168 | 0 |
| C | 0 | 168 | 0 |
| D | 0 | 168 | 0 |
| Mode M0 | |||
|---|---|---|---|
| Quadrant | BADHDUFLAG | Total packets | Discarded packets |
| A | 0 | 16656 | 2 |
| B | 0 | 18273 | 2 |
| C | 0 | 16812 | 2 |
| D | 0 | 18228 | 3 |
| Mode M9 | |||
|---|---|---|---|
| Quadrant | BADHDUFLAG | Total packets | Discarded packets |
| A | 0 | 12 | 0 |
| B | 0 | 12 | 0 |
| C | 0 | 12 | 0 |
| D | 0 | 12 | 0 |
| Quadrant | Total seconds | Saturated seconds | Saturation percentage |
|---|---|---|---|
| A | 8166 | 110 | 1.347049% |
| B | 8166 | 195 | 2.387950% |
| C | 8166 | 153 | 1.873622% |
| D | 8165 | 231 | 2.829149% |
Noise dominated data is calculated using 1-second bins in cleaned event files. If a bin has >2000 counts, and if more than 50% of those come from <1% of pixels, then it is considered to be noise-dominated and hence unusable.
| Quadrant | # 1 sec bins | Bins with >0 counts | Bins with >2000 counts | High rate bins dominated by noise | Noise dominated (total time) | Noise dominated (detector-on time) | Marked lightcurve |
|---|---|---|---|---|---|---|---|
| A | 9386 | 8166 | 0 | 0 | 0.00% | 0.00% | 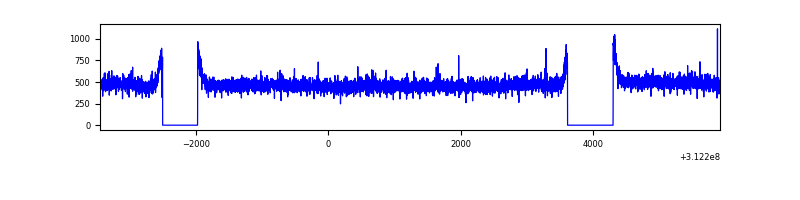 |
| B | 9386 | 8167 | 75 | 75 | 0.80% | 0.92% | 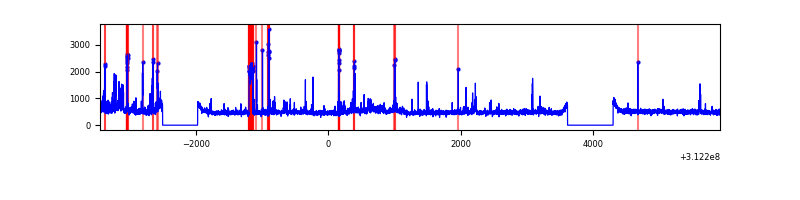 |
| C | 9386 | 8166 | 11 | 11 | 0.12% | 0.13% | 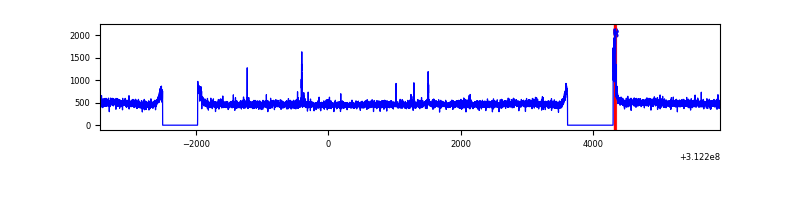 |
| D | 9385 | 8166 | 123 | 123 | 1.31% | 1.51% | 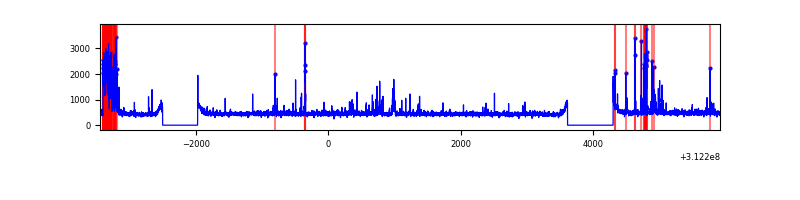 |
Top three noisy pixels from each quadrant. If the there are fewer than three noisy pixels in the level2.evt file, extra rows are filled as -1
| Pixel properties | Quadrant properties | ||||||
|---|---|---|---|---|---|---|---|
| Quadrant | DetID | PixID | Counts | Sigma | Mean | Median | Sigma |
| A | 13 | 254 | 11326 | 50.7 | 1000 | 978 | 204.1 |
| A | 3 | 137 | 9219 | 40.38 | 1000 | 978 | 204.1 |
| A | 0 | 226 | 8626 | 37.47 | 1000 | 978 | 204.1 |
| B | 10 | 245 | 540017 | 2802.83 | 991 | 964 | 192.3 |
| B | 12 | 111 | 24353 | 121.61 | 991 | 964 | 192.3 |
| B | 11 | 111 | 21775 | 108.21 | 991 | 964 | 192.3 |
| C | 14 | 238 | 148933 | 657.5 | 952 | 956 | 225.1 |
| C | 10 | 22 | 74985 | 328.93 | 952 | 956 | 225.1 |
| C | 13 | 61 | 6630 | 25.21 | 952 | 956 | 225.1 |
| D | 1 | 52 | 527675 | 2211.18 | 966 | 935 | 238.2 |
| D | 2 | 234 | 35033 | 143.14 | 966 | 935 | 238.2 |
| D | 13 | 172 | 31277 | 127.37 | 966 | 935 | 238.2 |
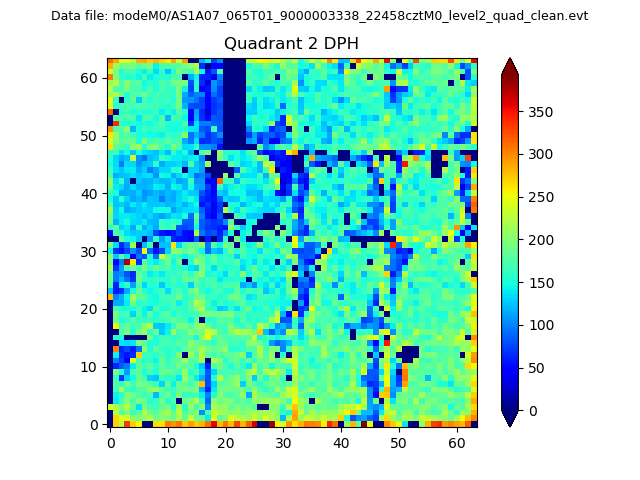
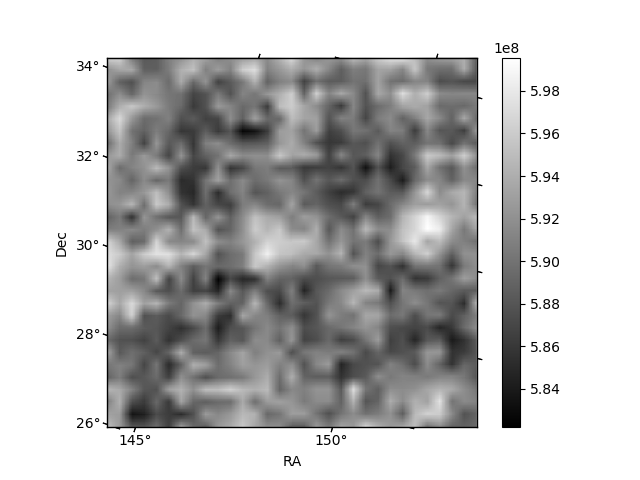
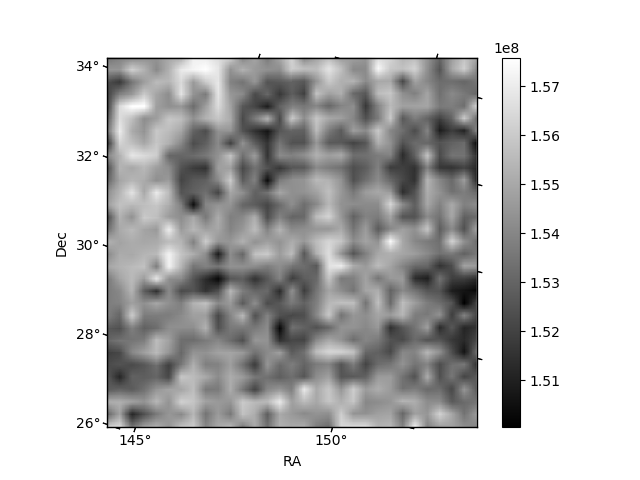
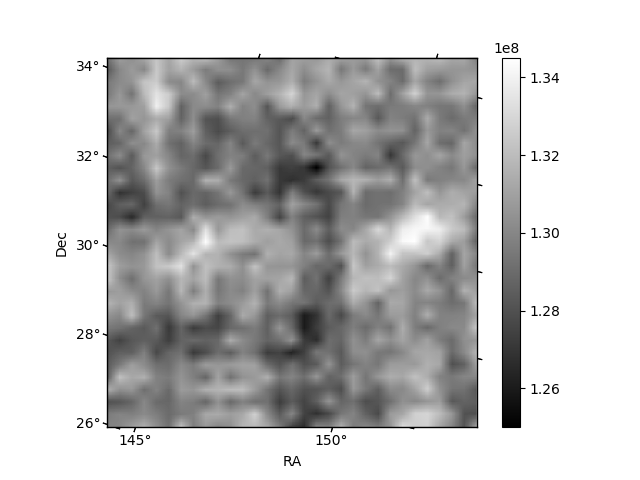
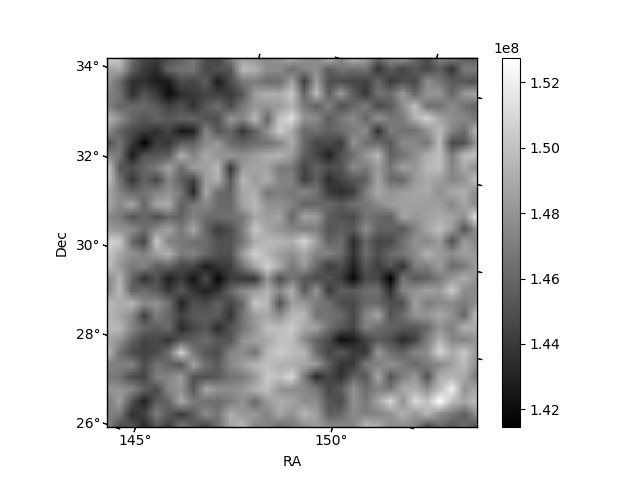
Histogram calculated using DETX and DETY for each event in the final _common_clean file
| Quadrant A | 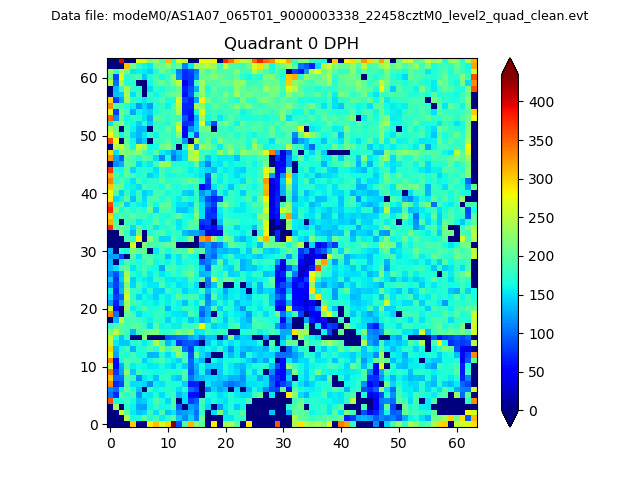 |
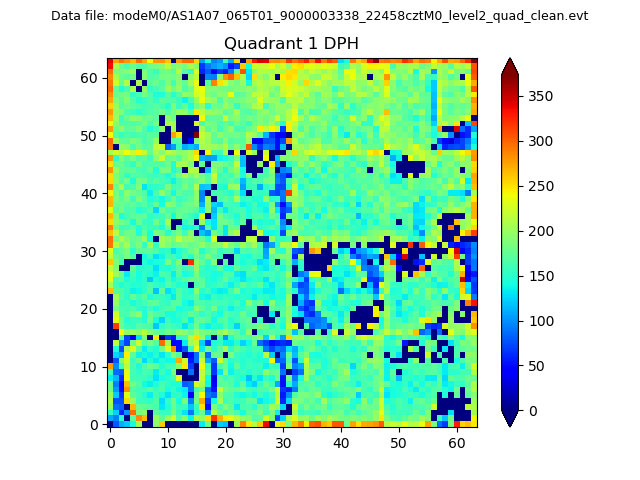 |
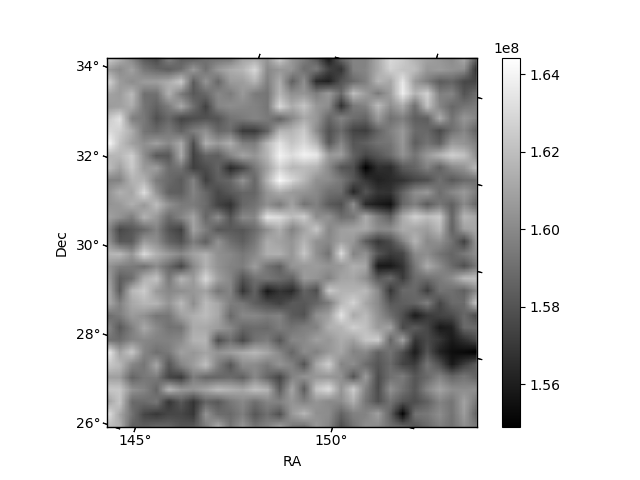
Quadrant B |
|---|---|---|---|
| Quadrant D | 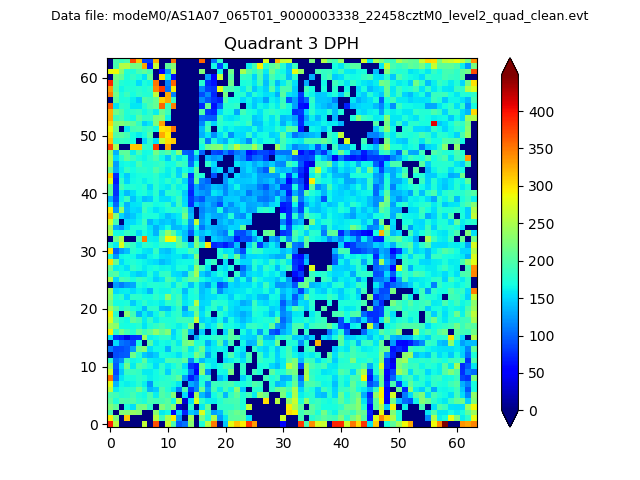 |
 |
Quadrant C |
| Plot type | Count rate plots | Images |
|---|---|---|
| Comparison with Poisson distribution Blue bars denote a histogram of data divided into 1 sec bins. Red curve is a Poisson curve with rate = median count rate of data. |
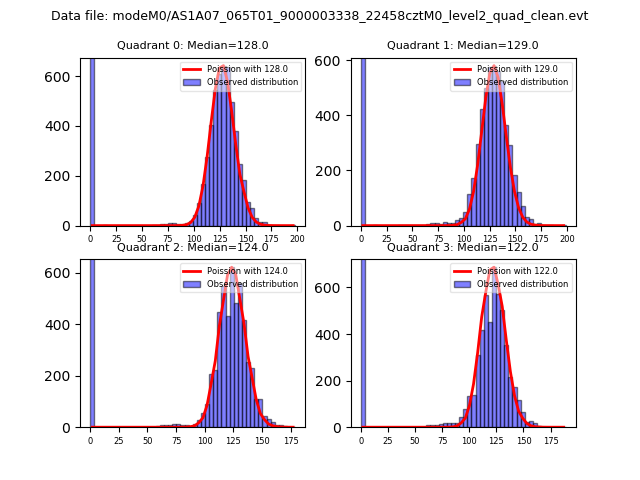 |
 |
| Quadrant-wise count rates Data is divided into 100 sec bins |
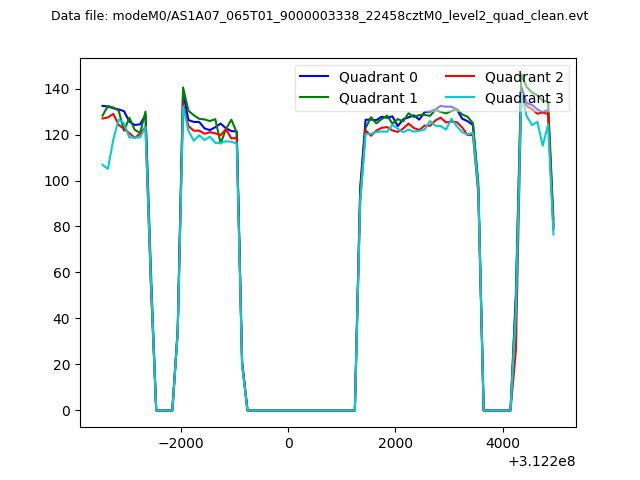 |
|
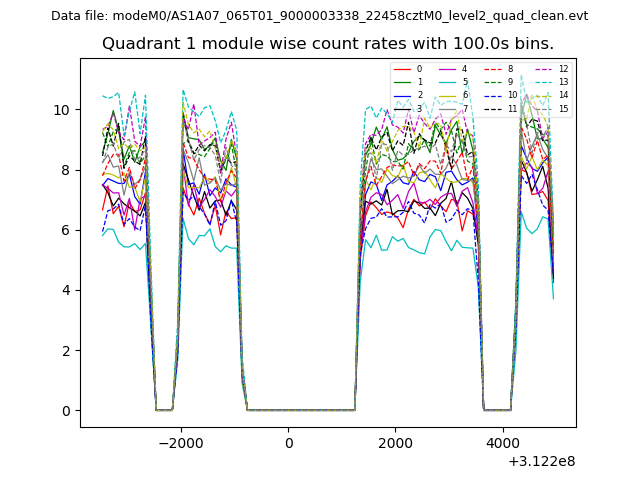
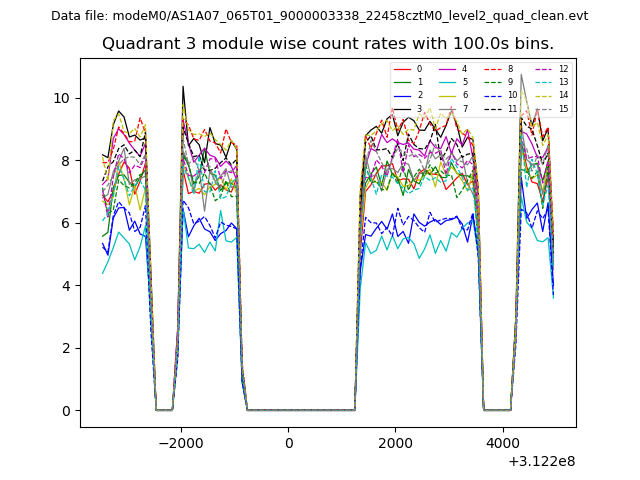
| Module-wise count rates for Quadrant A Data is divided into 100 sec bins |
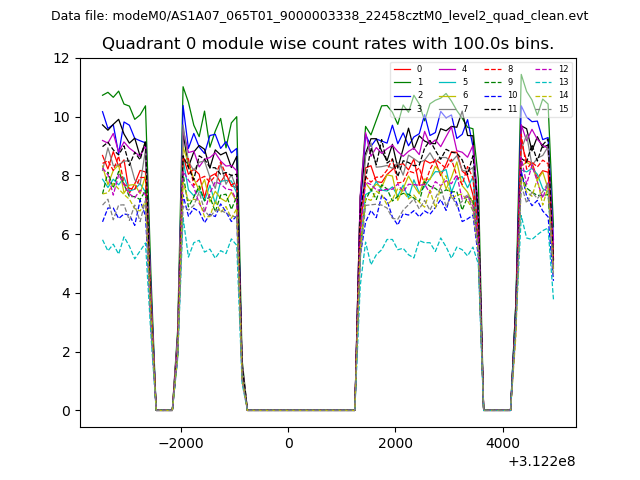 |
 |
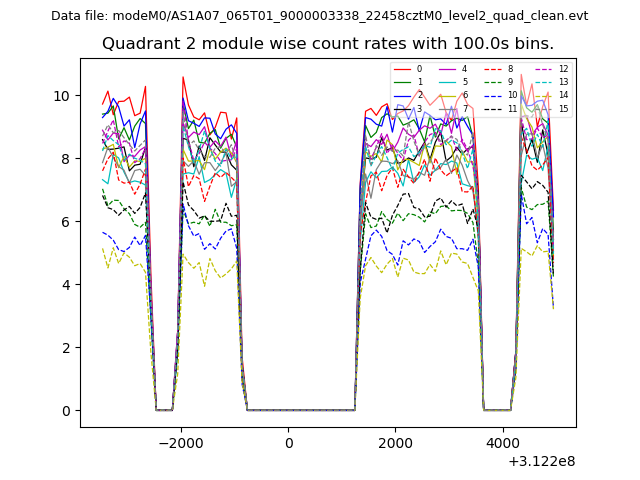
| Module-wise count rates for Quadrant B Data is divided into 100 sec bins |
 |
 |
| Module-wise count rates for Quadrant C Data is divided into 100 sec bins |
 |
 |
| Module-wise count rates for Quadrant D Data is divided into 100 sec bins |
 |
 |
| Parameter | Plot |
|---|---|
| CZT HV Monitor | 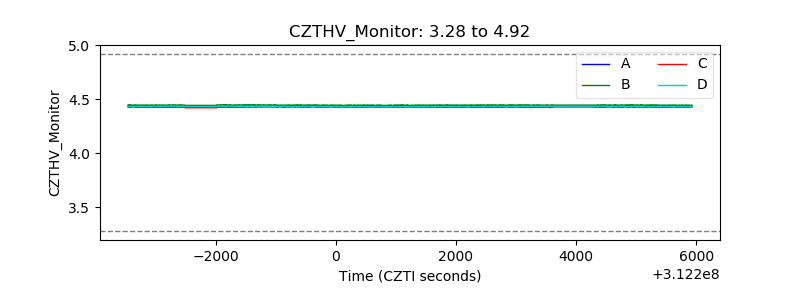 |
| D_VDD | 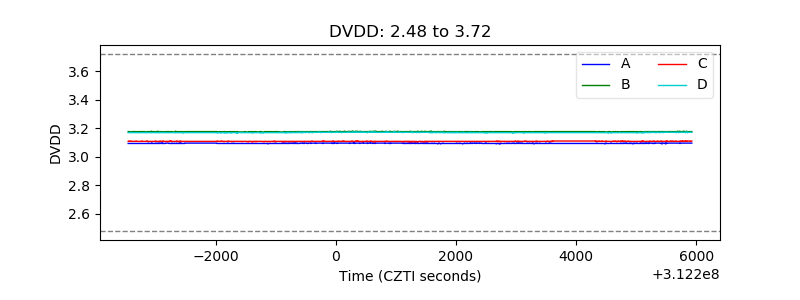 |
| Temperature 1 | 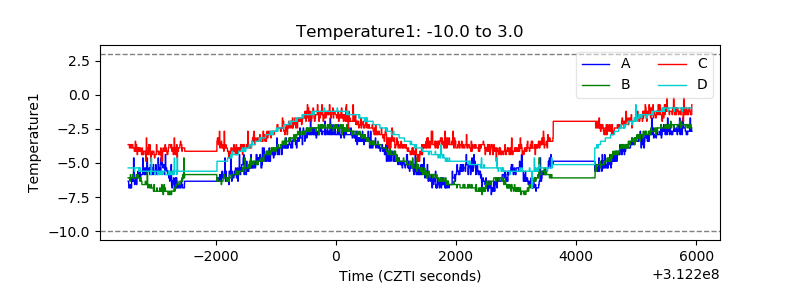 |
| Veto HV Monitor | 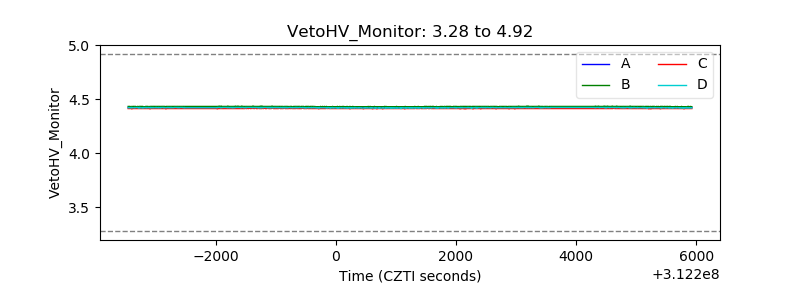 |
| Veto LLD | 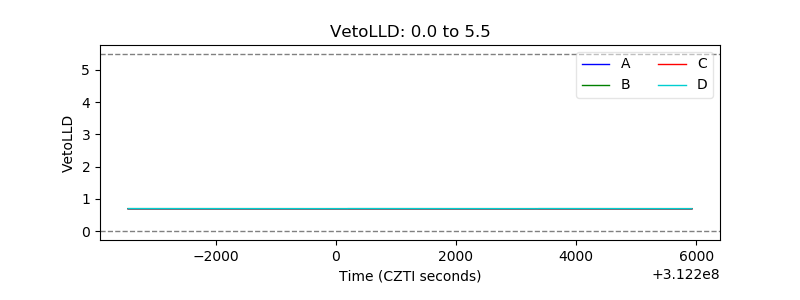 |
| Alpha Counter | 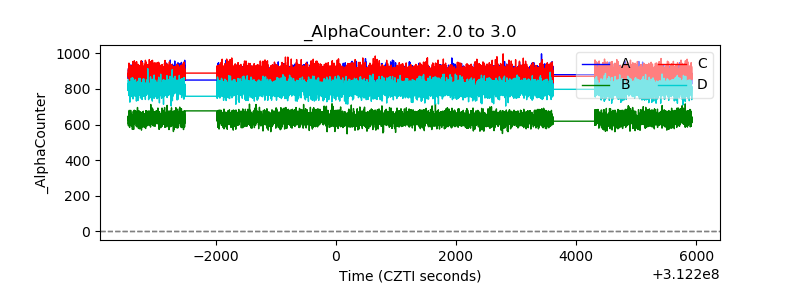 |
| _CPM_Rate | 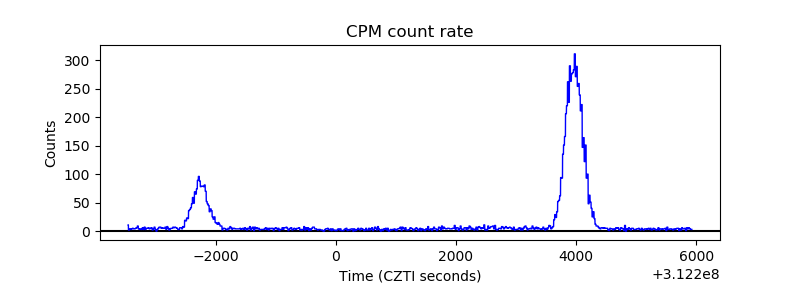 |
| CZT Counter | 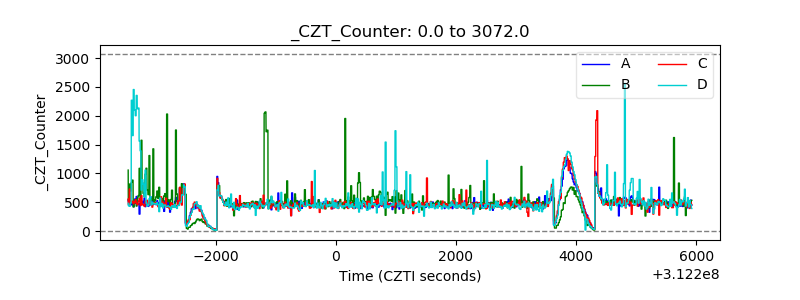 |
| +2.5 Volts monitor | 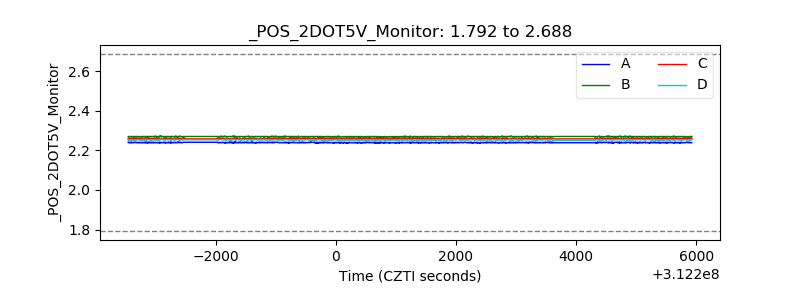 |
| +5 Volts monitor |  |
| _ROLL_ROT | 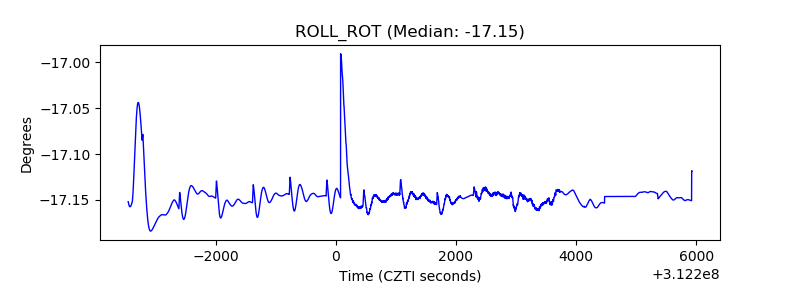 |
| _Roll_DEC | 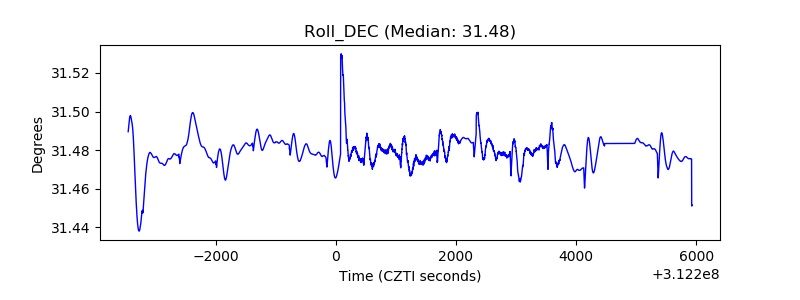 |
| _Roll_RA | 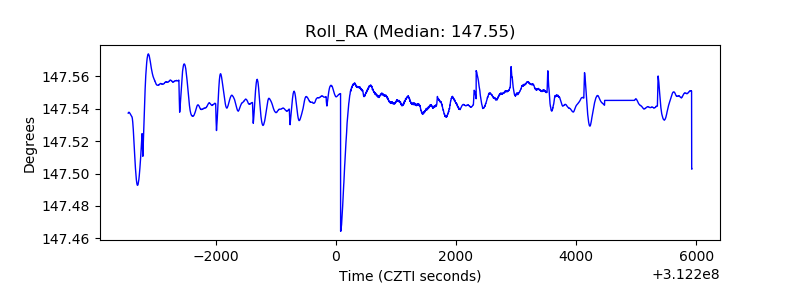 |
| Veto Counter | 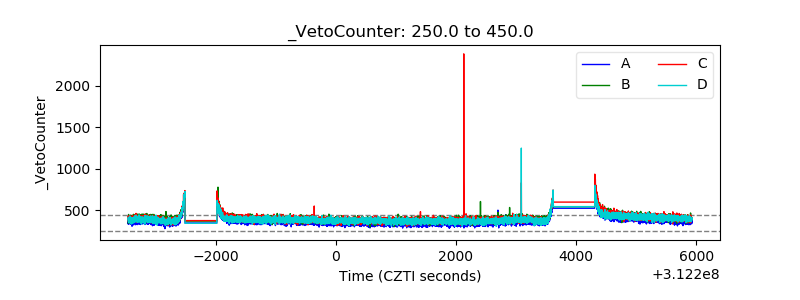 |